Adsorption studies of methylene blue and gentian violet on sugarcane bagasse
modi
fi
ed with EDTA dianhydride (EDTAD) in aqueous solutions: Kinetic and
equilibrium aspects
Karla Aparecida Guimarães Gusmão, Leandro Vinícius Alves Gurgel, Tânia Márcia Sacramento Melo,
Laurent Frédéric Gil
*Grupo de Química Orgânica e Ambiental, Departamento de Química, Instituto de Ciências Exatas e Biológicas, Universidade Federal de Ouro Preto, Campus Universitário Morro do Cruzeiro, 35400-000 Ouro Preto, Minas Gerais, Brazil
a r t i c l e
i n f o
Article history:Received 26 June 2012 Received in revised form 19 December 2012 Accepted 17 January 2013 Available online 21 February 2013
Keywords: Adsorption Methylene blue Gentian violet
Modified sugarcane bagasse EDTA dianhydride
a b s t r a c t
In this study the adsorption of cationic dyes by modified sugarcane bagasse with EDTA dianhydride (EB) was examined using methylene blue (MB) and gentian violet (GV) as model compounds in aqueous single solutions. The synthesized adsorbent (EB) was characterized by FTIR, elemental analysis, and BET. The capacity of EB to adsorb dyes was evaluated at different contact times, pH values, and initial dye concentrations. According to the obtained results, the adsorption processes could be described by a pseudo-second-order kinetic model. The adsorption isotherms were wellfitted by the Langmuir model. Maximum adsorption capacities for MB and GV on EB were found to be 202.43 and 327.83 mg/g, respectively. The free energy change during adsorption of MB and GV was found to be 22.50 and
24.21 kJ/mol, respectively, suggesting that chemisorption is the main mechanism controlling the adsorption process.
Ó2013 Elsevier Ltd. All rights reserved.
1. Introduction
Synthetic dyes have been extensively applied to many techno-logicalfields including the textile industry, leather tanning, paper production, food technology, in photo electrochemical cells, and also for hair coloring products (Forgacs et al., 2004). It is estimated that the amount of synthetic dyes produced worldwide is greater than 10,000 tons per year. Due to the large-scale production of synthetic dyes and their extensive application, they can cause considerable environmental pollution and pose a serious risk to public health (Forgacs et al., 2004).
The effluent discarded by the textile industry causes several problems to the environment due to the presence of a wide range of contaminants such as acids, bases, dissolved solids, and dyes. Amongst all these contaminants, the dyes are probably the most undesirable, since they are non-degradable toxic substances and tend to be quite stable for long periods of time (Gupta et al., 2004). Color changes resulting from the presence of these dyes interfere
with the penetration of solar light in aquatic environments and prevent photosynthesis, thus inhibiting the growth of aquatic biota and also interfering with the solubility of gases in bodies of water. Moreover, direct discharges of synthetic dyes into urban waste-waters in natural environments may cause the formation of toxic carcinogenic breakdown products (Garg et al., 2004).
Due to its commercial and social importance, the impact and toxicity of major dyes released into the environment have been widely studied. Methylene blue dye (MB) is most commonly used in cotton, wood, and silk. It causes a sensation of burning in the eyes and eventually results in permanent damage. Ingestion also pro-duces a burning sensation and can cause nausea, vomiting, deep sweating, mental confusion, and methemoglobinemia (high levels of methemoglobin in the blood), while inhalation causes irregular and rapid breathing after a short period of time (Ahmad et al., 2009). Gentian violet dye (GV) is also very harmful through inhalation, intake, and when it is in direct contact with the skin, causing cancer and severe eye irritation in human beings (Ahmad et al., 2009).
Several methods have been tested to remove color from industrial effluents with the goal of lessening their impact on the environment. Examples include adsorption on organic or inorganic matrices, discoloration by photo-catalysis or photo-oxidation *Corresponding author. Tel.:þ55 31 3559 1717; fax:þ55 31 3559 1707.
E-mail address:[email protected](L.F. Gil).
Contents lists available atSciVerse ScienceDirect
Journal of Environmental Management
j o u r n a l h o m e p a g e : w w w . e l s e v i e r . c o m / l o c a t e / j e n v m a n
processes, microbial degradation, chemical oxidation, ozonation, and coagulation (Gupta et al., 2004;Sun and Yang, 2003).
Adsorption is one of the most effective processes used in dye removal; the most popular absorbent for this task is activated carbon, which is very effective due to its high surface area, micro-porous structure, and high adsorption capacity. However, the application of activated carbon on a large scale as an absorbent elevates the overall costs of the process considerably, making it economically unfeasible. Obviously, the additional expenses pre-sented by the use of adsorption methods to remove dyes from
ef-fluents can be reduced if the adsorbent used is very cheap (Forgacs et al., 2004;Lata et al., 2008).
In recent years, extensive research has been undertaken to develop alternative and economically more attractive adsorbents. Recently, many low cost adsorbents from agricultural wastes and natural materials have been investigated for the removal of dyes from aqueous solutions (Hameed, 2009; Hameed et al., 2009). Sugarcane bagasse is a residue from the sugarcane crushing pro-cess, composed of macromolecules such as lignin (Xiao et al., 2001), polyoses and cellulose (Navarro et al., 1996). These macromole-cules, through their hydroxyl groups, are able to react chemically to produce new adsorbent materials with new adsorption proprieties. Studies toward the application of sugarcane bagasse as an adsorbent material for a variety of pollutants can be found in the literatures (Ho et al., 2005;Karnitz et al., 2007;Pereira et al., 2009;
Xing and Deng, 2009).
The synthetic route employed to prepare an adsorbent material is determined by the types of functional groups available on the solid support surface and the pollutant that is to be removed from the wastewater. Another important point is the cost of the solid support and the chemicals used in the synthesis of the adsorbent material. For new adsorbent materials to be considered attractive alternatives to those currently available, they should offer the advantage of low cost of production and maximum efficiency for the removal of a variety of pollutants from wastewaters. In addition, the recent concept of green chemistry requires that both solid support and chemicals can be recycled. In this regard, our research group has studied sugarcane bagasse, an important Brazilian agri-cultural by-product, as a solid support when derivatized with reagents such as succinic and EDTA anhydrides (Gurgel et al., 2008;
Gusmao et al., 2012; Karnitz et al., 2007; Pereira et al., 2009). Estimated prices of sugarcane bagasse and EDTA disodium based on the current Brazilian market at this present time are approximately US$0.015/kg and US$12.64/kg, respectively. These values are com-patible with the concept of production of a low cost adsorbent. The solvent employed in the modification of bagasse with EDTA is N,N-Dimethylformamide (DMF), which is a common organic sol-vent in industrial applications. In addition, DMF has a low cost and good chemical stability, which allows it to be recovered and reused. In our previous studies, the material synthesized by derivati-zation of sugarcane bagasse (B) with EDTA (which from this point onward will be referred to as EB) (Fig. 1) was prepared after esterification of B with EDTA dianhydride. The first described applications of this adsorbent were to remove heavy metals such as Cu2þ, Cd2þand Pb2þ(Karnitz et al., 2007) and to reduce hardness
caused by divalent cations such as Ca2þand Mg2þ(Karnitz et al., 2009) from spiked aqueous solutions. Due to the high efficiency exhibited by EB in removing divalent cations from spiked aqueous solutions, it was used in later studies to remove metals from actual electroplating wastewater (Pereira et al., 2009). In these studies, it was possible to remove 90% of Zn2þ, which proves that the EB has great potential for the removal of metal ions from real world wastewaters.
More recently, our research group has begun a study involving the removal of dyes from aqueous solutions using adsorbent
materials originally prepared for the purpose of treating metal-contaminated aqueous solutions. One of these adsorbent mate-rials is sugarcane bagasse modified with succinic anhydride (SCB 2). In the adsorption studies, SCB 2 exhibited great capacity for adsorption of methylene blue (MB) and gentian violet (GV) as model compounds in aqueous solutions (Gusmao et al., 2012). The high maximum adsorption capacities displayed by SCB 2 for adsorption of MB and GV in comparison with other adsorbents available in the literature (Table 3) motivated our research group to initiate adsorption studies of MB and GV dyes using EB in spiked aqueous solutions. These adsorption studies were performed using different contact times, pH values, and initial dyes concentrations. The results were evaluated according to four kinetic models and three adsorption models.
2. Materials and methods
2.1. Materials
Sugarcane bagasse was collected from local alcohol and sugar industries in the city of Ouro Preto, Minas Gerais, Brazil. Cationic dyes, methylene blue (MB, C16H18N3SCl,
l
max ¼ 584 nm, MM ¼ 319.85 g/mol) and gentian violet (GV, C25H30N3Cl,l
max¼661 nm, MM¼407.98 g/mol) (seeFig. 1), were purchased from Synth (Brazil) and used without further purification. EDTA disodium salt and acetic anhydride were also purchased from Synth (Brazil) and used without purification. Pyridine was pur-chased from Vetec (Brazil). It was left under reflux overnight with NaOH and then distilled. N,N-Dimethylformamide (DMF) was purchased from Tedia and distilled at reduced pressure before being used.2.2. Sugarcane bagasse preparation
First, sugarcane bagasse was dried under sun light for 6 h. The bagasse stalks were manually broken to reduce their length and then dried in an oven at 90C for 24 h. Afterward, they were
pul-verized in a mill with tungsten rings. The powder was sifted in a four-sieve system (10, 60, 100 and 200 mesh). The fraction from the 100e200 mesh was collected and washedfirst with hot dis-tilled water at 60e70C to eliminate residual sugars and then with
95% EtOH and dried at 90C in an oven. Finally, this fraction was
washed in a Soxhlet apparatus with hexane-ethanol (1:1, v:v) for 4 h, then dried at 90C in an oven to remove organic solvents and
stored in a desiccator prior to use.
2.3. Preparation of EDTA dianhydride (EDTAD)
The EDTA dianhydride was prepared using the methodology described byKarnitz et al. (2007), using EDTA disodium salt and the acetic anhydride. EDTA disodium (50.0 g) was dissolved in a 1000 mL beaker containing 500 mL of distilled water. Con-centrated HCl was added drop by drop until precipitation of H4EDTA occurred. The precipitate was vacuumfiltered and rinsed in 95% EtOH, 99% diethyl ether and subsequently dried in an oven for 2 h at 105C and cooled in a desiccator prior to use.
For the preparation of EDTA dianhydride, 18.0 g of H4EDTA was suspended in 31 mL of anhydrous pyridine in a 250 mL round-bottom flask equipped with a reflux condenser, and 24 mL of acetic anhydride was added to the suspension. The mixture was heated and kept stirring at 65C for 24 h. After this reaction time,
2.4. Functionalization of sugarcane bagasse with EDTAD: synthesis of EB
Functionalization of the sugarcane bagasse with EDTAD was performed according to the methodology described byKarnitz et al. (2007). Sugarcane bagasse (B) (3 g) and EDTAD (9 g) were added to a 250 mL round-bottomflask with 126 mL of anhydrous DMF. The suspension was heated at 75C for 24 h under gentle stirring. At the
end of the reaction, the suspension was vacuum filtered using a sintered glass funnel and rinsed consecutively in DMF, distilled water, a saturated solution of sodium bicarbonate, distilled water and finally with 95% EtOH. Afterward, the sugarcane bagasse modified with EDTAD (EB) was dried in an oven at 100C for 1 h
and stored in a desiccator prior to use.
2.5. Characterization of the EB
The EB was characterized by weight gain, FTIR and elemental analysis. The KBr pellet was prepared by mixing 1 mg of the EB with 100 mg of KBr. FTIR analysis was carried out in a Nicolet Impact model 410 spectrometer. The FTIR spectrum was recorded from 4000 to 400 cm 1with a resolution of 4 cm 1and 32 scans per sample. The elemental analysis of C, H, N and O was made on an instrument of elemental analysis, a CHNS/O Perkin Elmer 2400 analyzer Series II.
2.6. pH of point of zero charge (pHZPC)
The pH of point of zero charge (pHZPC) for EB was determined using the mass titration method as described byNoh and Schwarz (1990). Sodium nitrate (NaNO3) solutions with pH values of 3, 6, and 9 were prepared using 0.1 mol/L HNO3and 0.1 mol/L NaOH. Six aliquots of 20.0 mL each were taken from the solution and trans-ferred to 50 mL Erlenmeyerflasks. Different amounts of EB were then added to the Erlenmeyerflasks to give suspensions of 0.05, 0.1, 0.5, 1.5, and 10%. The equilibrium pH was measured after 24 h of shaking.
2.7. BET surface area and pore size
The experiments to obtain the surface area, volume and width of the EB micropores were carried out on a NOVAÒ
Surface Area Analyzer model 1000, Quantachrome Instrument.
2.8. Adsorption experiments
EB was used for dye (MB and GV) adsorption in aqueous solutions using a batch adsorption process. All the adsorption experiments were performed at 25C. The adsorption data were
modeled by several kinetic and isotherm models.
2.8.1. Kinetic study of adsorption of MB and GV onto EB
Samples of EB (20 mg) were weighed and added to 250 mL Erlenmeyerflasks with 100.0 mL of dye solution, 200 mg/L for MB or 450 mg/L for GV. The Erlenmeyerflasks were shaken at constant speed (150 rpm) with pH between 7.0 and 8.0 at 25C for different
time intervals (10, 20, 30, 45, 60, 90, 120, 180, 360, 540, 720, and 1440 min). At the end of each adsorption time, samples were subjected to centrifugation (centrifugal ExcelsaÒ
II, Mod 206 BL) at 3600 rpm for 20 min to separate the phases. The residual concen-trations of MB and GV in the supernatant phase were determined by UVeVis spectrophotometry (Biospectro, SP220) at wavelengths of 661 and 584 nm, respectively. The amount of dye adsorbed onto EB in each period of time was calculated using the following equation.
qt ¼
"C
i Cf
V w
#
(1)
whereqtis the amount of dye adsorbed (mg) per weight of EB (g) at timet,Vthe volume of dye solution (L),Cithe initial concentration of dye (mg/L),Cfthe concentration of dye at timet(mg/L) andwthe weight of the EB (g).
2.8.2. Adsorption as a function of pH
In order to evaluate the effect of pH on the adsorption of dyes onto EB, 20.0 mg samples of EB were added to 250 mL Erlenmeyer
flasks with 100.0 mL of dye solution of known concentration, 200 mg/L and 300 mg/L for MB and GV, respectively. The pH of each mixture was adjusted to values between 2 and 10 by adding drops of HCl and NaOH solutions (0.01e0.1 mol/L). The Erlenmeyerflaks were kept stirring until a point of equilibrium was reached (10 h and 15 h for MB and GV, respectively). Throughout the experiments the pH was checked and if any variation took place,
the pH was corrected to the initial value chosen for each set of experiments using HCl and/or NaOH solutions (0.01e0.1 mol/L). After shaking, the samples were subjected to centrifugation at 3600 rpm for 20 min to separate the phases and the final concentration of each dye solution was determined by UVeVis spectrophotometry. The amount of dye adsorbed onto EB at each pH was calculated according to Eq.(1).
2.8.3. Adsorption isotherms
Experiments with dyes (MB and GV) and EB were performed to determine the adsorption isotherms. Samples of EB, 20.0 mg, were added to 250 mL Erlenmeyer flasks containing 100.0 mL of dye solutions of known concentration, varying from 50 to 300 mg/L for MB and from 150 to 400 mg/L for GV. The experiments were performed at pH 8.0 for both dyes, for the time required to reach the equilibrium. The pH was adjusted to the optimum value for adsorption using drops of HCl and NaOH solutions in concentra-tions ranging from 0.01 to 0.1 mol/L. The equilibrium times used in the experiments were obtained from kinetic studies (10 h and 15 h for MB and GV, respectively). The amount of dye adsorbed at equilibrium, qe (mg/g) was calculated using the following equation.
qe ¼ ðCi CweÞ V (2)
whereCiandCeare the concentrations of the dye in the liquid phase (mg/L) at time 0 andt(equilibrium), respectively,Vthe volume of dye solution (L), andwthe weight of EB (g).
2.9. Free energy of adsorption
According to Liu (2009), the Gibbs free energy change (
D
G)indicates the degree of spontaneity of an adsorption process. The
D
Gof adsorption is calculated as follows:D
G ¼ RTlnKa (3)
whereRis the gas constant 8.314 J/K mol,T(K) the absolute tem-perature, and Ka is the thermodynamic equilibrium constant without units. The Langmuir equilibrium constant has been often used for calculation of
D
Gusing Eq.(3)in adsorption studies (Liu, 2009). However, it should be pointed out that the thermodynamic equilibrium constant in Eq. (3) is unitless, whilst the Langmuir constant has units of L/mol.Liu (2009)has demonstrated in detail that the relationship between the Langmuir equilibrium constant,KL, and the thermodynamic equilibrium constant,Ka, can be given
by Eq.(4).
Ka ¼
K
L
g
e ð1 mol=LÞ
(4)
where
g
eis a function of the ionic strength (Ie)ðlogg
e ¼ Az2IeÞ of the solute at adsorption equilibrium and the charge carried by the solute (z) (DebyeeHückel law). According toLiu (2009), in the case of neutral adsorbates or adsorbates with weak charges, Eq.(4)turns to:
D
Gz RTln½KL ð1 mol=LÞ ¼ RTlnKL (5)
This approach implies that for adsorbates with weak charge, e.g., organic compounds such as dye molecules, the Langmuir equilib-rium constant with units of L/mol can be reasonably used for determination of
D
G. A detailed reading of Liu’s discussion isstrongly recommended by authors to avoid erroneous use of this approach in the calculation of
D
G.3. Results and discussion
3.1. Synthesis and characterization
EB was prepared as described in Section2.4and as depicted in
Fig. 1, from which a product was obtained with a weight gain of 50.7% (Table 1). The nitrogen content was determined by elemental analysis and this information permitted calculation of the quantity of EDTA units introduced into the bagasse matrix after esterification of the hydroxyl groups.
As can be seen inTable 1, there was a considerable increase in nitrogen content after modification with EDTAD, which was also accompanied by significant weight gain, indicating a successful reaction and the incorporation of amine functions in the modified material (EB).
3.2. FTIR spectroscopy
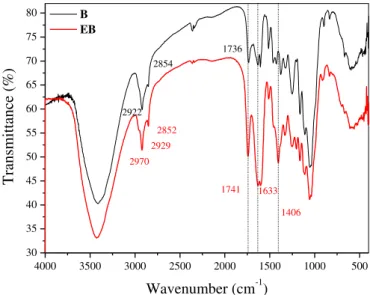
The spectra of bagasse before (B) and after modification with EDTAD (EB) are shown in Fig. 2. When comparing the infrared spectrum of EB to the spectrum of unmodified bagasse, the appear-ance of strong bands at 1741 cm 1can be attributed to axial defor-mation of the ester bond (eOeC]O), and bands at 1633 and 1406 cm 1 are attributed to asymmetric and symmetric axial de-formations of carboxylate (eCOO ). These bands confirmed the introduction of EDTA dianhydride via formation of ester linkages with consequent release of carboxylate functions (Karnitz et al., 2007).
3.3. Surface area, volume and width of the micropores
By modeling the adsorption of gases by porous materials, it is possible to evaluate various characteristics of the porous solids, such as surface area, pore volume and width. Obtaining these parameters is important since they are related to the sites available for adsorption. The surface area, average pore volume and average pore diameter were determined and found to be 1.458 m2/g, 0.00394 cm3/kg and 7.810 nm, respectively. The surface area of EB is small in comparison with other adsorbents such as activated car-bons. For instance,Royer et al. (2009)used carbonized pine-fruit shell with a surface area of 702 m2/g, average pore volume of 0.00023 cm3/kg, average pore diameter of 5.28 nm, and pHPZCof 3.85; with this material they achieved a maximum adsorption capacity of 529 mg/g of methylene blue. EB has a very low surface area in comparison with carbonized pine-fruit shell; however, the pore diameter of EB is larger than that of carbonized pine-fruit shell. According toIp et al. (2009), the presence of wider pores favors higher adsorption capacities, especially for larger dye molecules. The surface chemistry of the adsorbents is another important factor that controls the adsorption of adsorbate. Ac-cording toIp et al. (2009), surfaces extensively functionalized with carboxylate groups can readily chemisorb cationic dyes.
3.4. Point of zero charge (pHPZC)
The point of zero charge (pHPZC) can be used to characterize an adsorbent material, since it indicates the pH at which the adsorbent material has a net zero surface charge (Reed et al., 2000).
Table 1
Elemental analysis, the quantity of EDTA units introduced on bagasse and weight gain.
Material C (%) H (%) N (%) CEDTA(mmol/g) Weight gain (%)
B 43.98 6.02 0.13 e e
The adsorbent surface has a net positive charge at pH<pHPZC, while at pH > pHPZC, the surface has a net negative charge. Therefore, the adsorption of cationic dyes is favored when the pH is greater than the pHPZC, while the adsorption of anionic dyes is favored at pH values lower than the pHPZC(Srivastava et al., 2008). The pH value for the potential of zero charge for EB was 7.5, indi-cating that when the pH of the solution is greater than the pHPZC, the adsorbent has a negatively charged surface that can attract positively charged dyes (MB and GV) (El Qada et al., 2008).
3.5. Adsorption of methylene blue (MB) and gentian violet (GV) onto EB
3.5.1. Adsorption kinetic study
The effect of contact time on adsorption of MB and GV onto EB is shown inFig. 3. The adsorption of both dyes was rapid in the initial phase and gradually decreased with time until equilibrium was reached. At this point, the amount of dye adsorbed reached a steady state with the amount of dye in solution (Hameed, 2008). The high adsorption rate in the initial period (first 100 min) may be due to
the large number of sites available in the initial phase, resulting in a concentration gradient which tends to increase the adsorption of dyes in the early stages. As time passes, this concentration gradient is reduced due to the accumulation of dye particles on the adsorption sites, leading to a decrease in adsorption rate in the later stages (Uddin et al., 2009).
EDTA is a hexadentate ligand. It has four carboxylate and two amine groups. According toDean and Lange (1999), pKavalues for its carboxylic groups are equal to 0.0, 1.5, 2.0, and 2.69, and pKa values for its amine functions are equal to 6.13 and 10.37. When EDTAD is grafted on bagasse via esterification, these values of pKa probably change, but they may be used to give an idea of the dissociation constants of EDTA molecules bonded on the surface of the bagasse. Above pH 7, all carboxylic groups are deprotonated and one amine group has a non-shared electron pair. This means that the EB surface is negatively charged and the positively charged dye molecules can interact with adsorption sites contain-ingeCOO groups.
The equilibrium times for the adsorption of MB and GV dyes onto EB were found to be 10 and 15 h, respectively. These times were used in the adsorption assays as a function of pH and in studies of the adsorption isotherms for each dye.
3.5.2. Adsorption study as a function of pH
The pH is an important factor controlling the adsorption pro-cess. Adsorption of MB and GV onto EB as a function of pH is shown inFig. 4. The favorable adsorption in basic pH can be attributed to the nature of the cationic dyes and the functional groups on the solid support surface (eCOOH). In acidic pH, an excess of H3Oþions decreases the concentration of carboxylate functions (eCOO ) on the adsorbent and increases the concentration of the protonated form (eCOOH), causing a decrease in the number of negatively charged sites, which in turn does not favor the adsorption of pos-itively charged dye molecules (Garg et al., 2004). When the pH is increased to values higher than the pHZPC of the EB (7.5), the number of negatively charged sites on the surface of the adsorbent increases and the amount of MB and GV adsorbed also increases. This can be explained by an electrostatic interaction between the basic dyes and the negatively charged surface of the EB. A similar tendency was observed for MB adsorption onto tea waste, with an optimum pH of 8.0 (Uddin et al., 2009), and pine bark waste, with an optimum pH of 8.5 (Royer et al., 2009). Therefore, the pH chosen for the study of the adsorption isotherms was 8.0 for all EB/dye systems.
0 100 200 300 400 500 600 700 800 900 1000 1100 1200 1300 1400 1500 0
25 50 75 100 125 150 175 200 225 250 275 300 325 350
MB GV
Nonlinear pseudo-second-order model Nonlinear pseudo-second-order model qt
(mg/
g)
Time (min)
Fig. 3.Evolution of the adsorption of MB and GV dyes onto EB as a function of time.
2.0 2.5 3.0 3.5 4.0 4.5 5.0 5.5 6.0 6.5 7.0 7.5 8.0 8.5 9.0 9.5 30
45 60 75 90 105 120 135 150 165 180 195 210 225 240
MB GV
qt
(mg/
g)
pH
Fig. 4.Evolution of the adsorption of MB and GV dyes onto EB as a function of pH. 4000 3500 3000 2500 2000 1500 1000 500
30 35 40 45 50 55 60 65 70 75 80
1736 2854
2852 2929
2970
2922
B EB
Transmittance (%)
Wavenumber (cm
-1)
1741
1406 1633
3.5.3. Adsorption isotherms
The aim of this study was to understand the dyeeadsorbent interaction through the validity of the models and alsofind pa-rameters that allow for comparison, interpretation and prediction of the adsorption data of the EB (Hamdaoui, 2006). Several iso-therm equations are available and three important isoiso-therms were applied to fit the equilibrium data of this study: the Langmuir, Freundlich and Tempkin isotherms.
The Langmuir isotherm theory assumes monolayer coverage of adsorbate on a homogeneous surface of adsorbent (Langmuir, 1918). Graphically, the Langmuir isotherm is characterized by a plateau. Therefore, at equilibrium, the saturation point is reached when adsorption cannot occur. Adsorption occurs at specific sites on the homogeneous surface of the adsorbent. Once a dye molecule occupies a site, there can be no absorption there.
A well-known linear expression for the Langmuir isotherm is shown as follows:
Ce
qe ¼
1
Qmaxbþ
Ce
Qmax (6)
where Qmax andbare the Langmuir constants, representing the maximum adsorption capacity of the solid phase and the constant energy related to the heat of adsorption, respectively, whileCe(mg/ L) is the concentration of adsorbate in the liquid phase at equilib-rium and qe (mg/g) is the amount of dye adsorbed on the solid phase at equilibrium, respectively.
The values ofQmaxandbcan be determined from the intercept and the slope of the plot of Ce/qe versusCe from the linearized Langmuir equation. One of the essential characteristics of the Langmuir isotherm can be expressed by a separation factor, RL, which is defined as follows:
RL ¼
1
1þ ðbCiÞ (7)
whereCiis the initial concentration of dye. The value ofRLindicates whether an isotherm is irreversible (RL¼0), favorable (0<RL<1), linear (RL¼1) or unfavorable (RL>1).
The Freundlich isotherm (Freundlich, 1906) is an empirical equation which is applicable to adsorption on heterogeneous sur-faces and is not restricted to the formation of a monolayer. It is assumed that an increase in the adsorbate concentration also increases the amount adsorbed on the surface of the adsorbent. The Freundlich isotherm can be expressed in its linear form as follows:
lnqe ¼ lnkfþ 1
n lnCe (8)
whereqe (mg/g) represents the amount of dye adsorbed on the solid phase at equilibrium, Ce (mg/g) is the concentration of adsorbate in the liquid phase at equilibrium, kf(mg/g) (L/mg)1/n indicates the adsorption capacity, and nreflects the intensity of adsorption according to the Freundlich theory, which gives an idea of the favorability of the adsorption. If the value of 1/nfalls in the range from 0 to 1 it indicates that the adsorption is favorable. The values ofkfand 1/nare calculated from the intercept and slope of the plot of lnqeversus lnCe.
Tempkin and Pyzhev (1940)considered the effects of some in-direct adsorbate/adsorbent interactions in the adsorption isotherm and suggested that due to these interactions the heat of adsorption of all molecules in the layer decreases linearly with coverage. The Tempkin and Pyzhev isotherm can be expressed in its linear form as follows:
qe ¼ BtlnAtþBtlnCe (9)
where
Bt ¼ RTb (10)
The constantBt(L/mg) is related to the heat of adsorption,At (mg/L) is a constant of the Tempkin isotherm,b(J/mol) is the energy constant of the Tempkin isotherm,R (8.314 J/K mol) is the gas constant andT(K) is the absolute temperature.
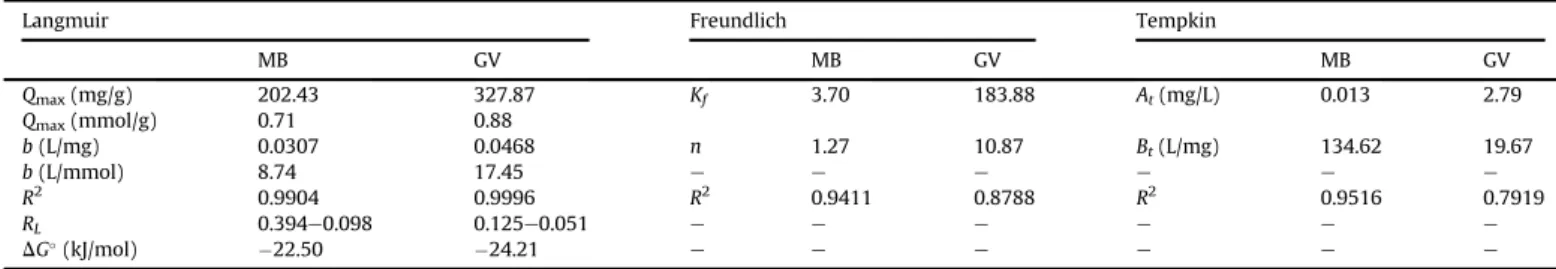
Table 2andSupplementary Table 1show the values of corre-lation coefficients and parameters of each isotherm for adsorption of MB and GV dyes onto B and EB. From these data, it was possible to conclude that the Langmuir model bestfits the experimental data for both dyes and the adsorbent material, because this model exhibits an R2 value closer to unity than the other models. Ac-cording to the Langmuir model, when a molecule is adsorbed on an adsorbent site, this site becomes unavailable to other molecules. Thus, saturation of sites occurs and a monolayer of dye molecules is formed. The monolayer values (Qmax) found for the EB adsorbent were 202.43 mg/g for MB and 327.87 mg/g for GV, whilst theQmax values for unmodified bagasse (B) were 48.50 mg/g for MB and 85.62 mg/g for GV. Comparisons between theQmaxvalues for B and EB reveal that EB can adsorb 4.17 times more MB than B and 3.83 times more GV. Therefore, these results show that the functional-ization of B with EDTA dianhydride was effective in improving the adsorption capacity of B, producing an interesting material in terms of its chemical functionality and application. As can be seen, the calculated RL values are between 0 and 1, indicating that the adsorption of dyes onto B and EB is a favorable process.Fig. 5and
Supplementary Fig. 1show the linearfit of the Langmuir model to the experimental data of adsorption for MB and GV dyes onto B and EB. As can also be seen inTable 2, the values for free energy change (
D
G) for adsorption of MB and GV on EB were found to be 22.50and 24.21 kJ/mol, respectively; whilst, as can be seen in
Supplementary Table 1,
D
Gvalues for adsorption of MB and GV onB were 29.16 and 23.96 kJ/mol, respectively. These values sug-gest that the main mechanism of adsorption of MB and GV onto B and EB is chemisorption.
Table 3shows the maximum adsorption capacities for MB and GV dyes obtained in this study and those reported in the literature. As can be seen in Table 3, EB showed a greater capacity for adsorption of GV in comparison with MB. Furthermore, when EB is compared to other adsorbent materials, it can be seen that it presents an intermediate capacity for adsorption of MB. Among the adsorbent materials presented inTable 3, two adsorbent materials showed a higher adsorption capacity than EB for adsorption of GV. In addition, SB-EDTAD (Xing et al., 2010) presents a smaller adsorption capacity for MB than EB. A comparison between EB and SB-EDTAD suggests that the methodology used in this study to graft EDTAD on sugarcane bagasse to produce EB was more effective than that used byXing et al. (2010). However,Xing et al. (2010)did not provide any additional characterization beyond FTIR analysis, such as weight gain and/or elemental analysis, and it was therefore not possible to discern the quantity of EDTA introduced into sug-arcane bagasse and the degree of functionalization of the modified material. In comparison with clay minerals such as Kaolin (Ghosh and Bhattacharyya, 2002) and Bentonite (Bellir et al., 2012;Hong et al., 2009) (Table 3), EB exhibited higher adsorption capacity for MB and GV.
modification of sugarcane bagasse (B) with succinic anhydride (SCB 2, 6.0 mmol/g,eCOOH) (Gurgel et al., 2008) than with EDTA dianhydride (EB, 2.36 mmol/g,eCOOH). In calculating the number of functional groups on EB, it was considered that each unit of EDTA introduced adds three acid carboxylic groups to the solid support (monoesterification). Thus it is expected that, due to its greater number of chelating sites, SCB 2 presents a higher adsorption capacity than EB for the cationic dyes studied; since more chelating sites are available, more cationic molecules can interact by binding to the surface of the adsorbent.
3.5.4. Adsorption kinetics
The kinetics of adsorption of a solute onto a solid surface is often complex. The mechanism of adsorption depends on the physical and/or chemical properties of the adsorbent as well as the process of mass transport. To investigate the mechanism of dye adsorption, three kinetic models were considered, pseudo-first-order, pseudo-second-order and the Elovich equation. These models are the most commonly used to describe the adsorption of dyes and other pol-lutants such as heavy metals onto solid adsorbents.
Lagergren (1898) proposed a method for the analysis of adsorption, namely pseudo-first-order kinetics, whose mathemat-ical equation in linear form is represented below:
logðqe qtÞ ¼ logqe
k1
2303t (11)
where qe (mg/g) and qt (mg/g) are the amounts of adsorbate adsorbed on the surface of the adsorbent at equilibrium and at a given timet(min) andk1(min 1) is the pseudo-first-order rate constant.
Ho and McKay (1998)proposed a pseudo-second-order kinetic model for the analysis of adsorption, whose mathematical for-mulation is shown in its linear form as follows:
t
qt ¼
1
k2q2eþ
1
qet (12)
where qe (mg/g) and qt (mg/g) are the amounts of adsorbate adsorbed on the surface of the adsorbent at equilibrium and at a given timet(min) andk2(g mg 1min 1) is the pseudo-second-order rate constant.
The Elovich equation is a kinetic equation related to the chem-isorption process (Juang and Chen, 1997). This equation is often validated for systems where the surface of the adsorbent is het-erogeneous. The linear form of the Elovich equation is given as follows:
qt ¼ 1
b
lnðab
Þ þ1b
lnt (13)where
a
(mg g 1min 1) is the initial adsorption rate andb
(g mg 1) is the relationship between the degree of surface coverage and the activation energy involved in the chemisorption.As can be seen inTable 4, theR2values for the pseudo-second-order equation are closer to unity than the pseudo-first-order and Elovich equations. Thus, the pseudo-second-order kinetic model describes the adsorption of the dyes more accurately. Moreover, the values of qe,calc calculated from the pseudo-second-order model
0 25 50 75 100 125 150 175 200 225 250 275 300 325 0.0
0.1 0.2 0.3 0.4 0.5 0.6 0.7 0.8 0.9 1.0 1.1 1.2 1.3 1.4
MB GV
Linear Langmuir model fit Linear Langmuir model fit
Ce /qe
(L/
g
)
Ce (mg/L)
Fig. 5.Langmuir isotherms for the adsorption of MB and GV dyes onto EB.
Table 3
Comparison of maximum adsorption capacities for MB and GV dyes with literature data.
Adsorbent Dye Qmax(mg/g) Reference
EB MB 202.43 This study
Succinylated sugarcane bagasse (SCB 2)
MB 478.47 Gusmao et al. (2012)
Brazilian pine-fruit Shell MB 252 Royer et al. (2009) Carbonaceous Brazilian
pine-fruit shell
MB 529 Royer et al. (2009)
Tea waste MB 85.16 Uddin et al. (2009)
Wood sawdust MB 120.48 Ahmad et al. (2009)
Esterified wheat straw MB 312.50 Gong et al. (2008)
EDTAD-SB MB 115.3 Xing et al. (2010)
Kaolin (C6) MB 20.49 Ghosh and Bhattacharyya
(2002)
Bentonite MB 173.0 Hong et al. (2009)
EB GV 327.87 This study
Succinylated sugarcane bagasse (SCB 2)
GV 1273.16 Gusmao et al. (2012)
Esterified wheat straw GV 227.27 Gong et al. (2008)
Wood sawdust GV 341 Chakraborty et al. (2005)
Sunflower seed hulls GV 92.59 Hameed (2008)
Activated carbon prepared from rice husk
GV 64.875 Mohanty et al. (2006)
Bentonite GV 108.57 Bellir et al. (2012)
Table 2
Parameters of the adsorption isotherms for MB and GV dyes onto EB.
Langmuir Freundlich Tempkin
MB GV MB GV MB GV
Qmax(mg/g) 202.43 327.87 Kf 3.70 183.88 At(mg/L) 0.013 2.79
Qmax(mmol/g) 0.71 0.88
b(L/mg) 0.0307 0.0468 n 1.27 10.87 Bt(L/mg) 134.62 19.67
b(L/mmol) 8.74 17.45 e e e e e e
R2 0.9904 0.9996 R2 0.9411 0.8788 R2 0.9516 0.7919
RL 0.394e0.098 0.125e0.051 e e e e e e
were more consistent with the experimental adsorption values
(qe,exp) than those calculated from the pseudo-first-order model. For
the MB dye, the experimental and calculated values were found to be 191.97 and 192.31 mg/g, and 338.22 and 357.14 mg/g for the GV dye.Fig. 6shows the linearfit of the pseudo-second-order model to the experimental data of adsorption of MB and GV dyes onto EB.
The pseudo-second-order model is also presented as the best model to describe the adsorption of cationic dyes by other bio-sorbents, such as in the adsorption of MB on pineapple waste (Hameed et al., 2009), and of MB and GV onto esterified wheat straw with citric acid (Gong et al., 2008).
3.6. Adsorption mechanism
Adsorption kinetics is usually controlled by different mecha-nisms. The intra-particle diffusion theory (Weber and Morris, 1963) is derived from Fick’s law and assumes that the diffusion of the liquid film surrounding the adsorbent is negligible, and intra-particle diffusion is the only rate controlling step of the adsorp-tion process. Eq.(12)shows the mathematical expression used to study this phenomenon.
qt ¼ kid
ffiffi
t
p
þC (14)
wherekid(mg/g min½) is the intra-particle diffusion rate constant andCis the value of the intercept of the plot ofqtagainst t½.
If intra-particle diffusion was involved in the adsorption, then a plot of qt against t½ would result in a linear relationship that allows calculation of the value ofkidfrom the slope. TheCintercept values give an idea of the boundary layer thickness, i.e., the larger the intercept, the greater the effect of the boundary layer. The values ofCandkidfor the linear segments are shown inTable 5.
Fig. 7shows plots ofqtagainstt½for the adsorption processes of MB and GV dyes onto EB. It is possible, from the plots ofqtagainst t½, to distinguish three phases in the adsorption processes. These results imply the possibility that the adsorption processes involve more than a single kinetic stage. Thefirst stage is an instantaneous adsorption and is probably due to strong electrostatic attraction between the dye and the outer surface of the adsorbent. The second stage is a gradual adsorption stage, which can be attributed to intra-particle diffusion of dye molecules through the pores of the
Table 4
Kinetic parameters for the adsorption of MB and GV dyes onto EB.
MB GV
qe,exp(mg/g) 191.97
qe,exp(mg/g) 338.22
Pseudo-first-order model
k1(min 1) 0.0038 0.0035
qe,calc(mg/g) 18.81 173.20
R2 0.7379 0.9513
Pseudo-second-order model
k2(g/mg min) 0.0012 0.000053
qe,calc(mg/g) 192.31 357.14
R2 1 0.9977
Elovich equation
a(mg/g min) 92.6105 31.13
b(g mg 1) 0.11 0.018
R2 0.8913 0.9501
0 100 200 300 400 500 600 700 800 900 1000 1100 1200 1300 1400 1500 0.0
0.5 1.0 1.5 2.0 2.5 3.0 3.5 4.0 4.5 5.0 5.5 6.0 6.5 7.0 7.5 8.0 8.5
MB GV
Linearized pseudo-second-order model fit Linearized pseudo-second-order model fit
t/q
t
(min/g.mg
)
Time (min)
Fig. 6.Pseudo-second-order modelfit for the adsorption of MB and GV dyes onto EB.
Table 5
Kinetic parameters of the intra-particle diffusion model for the adsorption of MB and GV dyes onto EB.
MB GV
1st stage 2nd stage 3rd stage 1st stage 2nd stage 3rd stage
kid(mg/g min½) 9.55 2.79 0.13 17.56 5.71 0.61 C(mg/g) 112.70 150.48 187.33 44.86 183.86 315.31
R2 0.9815 0.9994 0.7264 0.9044 0.9518 0.9397
0 3 6 9 12 15 18 21 24 27 30 33 36 39 42 45 135
140 145 150 155 160 165 170 175 180 185 190 195
q
t(mg/g)
MB
0 3 6 9 12 15 18 21 24 27 30 33 36 39 42
80 100 120 140 160 180 200 220 240 260 280 300 320 340 360
GV
q (m
g/
g)
t (1/2) (min1/2)
t (1/2) (min1/2)
adsorbent. Thefinal stage corresponds to the equilibrium adsorp-tion, when the dye molecules occupy all the active sites on the adsorbent (Ahmad et al., 2009). The values ofkidwere determined from the slopes of the respective linear plots and are presented in
Table 5.
The straight lines with higher slope values have largerkidand consequently a higher adsorption rate per unit time. For the dyes studied (MB and GV), it can be seen inFig. 7that as time passes the rate of adsorption decreased, being lower in the equilibrium stage of the system (third step), when all the adsorption sites are already occupied. The values ofCwere calculated from the intercepts of the straight lines and represent the thickness of the dye adsorbed onto the EB (Table 5).
4. Conclusions
The EB adsorbent prepared from sugarcane bagasse proved to be effective for the removal of MB and GV dyes from aqueous solutions by an adsorption process. The FTIR spectrum of EB showed the appearance of strong bands at 1743 cm 1, 1631 cm 1 and 1406 cm 1that confirmed the introduction of EDTA dianhydride into the lignocellulose matrix. Three adsorption kinetic models were tested and the pseudo-second-order model fit the exper-imental data well. The intra-particle diffusion study yielded three linear regions, which suggested that dye adsorption involves more than one kinetic stage. The Langmuir modelfit the experimental data well, suggesting the adsorption occurs in a monolayer. The maximum adsorption capacities for the adsorption of MB and GV dyes onto EB were found to be 202.43 and 327.87 mg/g, respectively.
Acknowledgments
The authors are grateful to Universidade Federal de Ouro Preto (UFOP), Fundação de Amparo a Pesquisa do Estado de Minas Gerais (FAPEMIG), and Conselho Nacional de Desenvolvimento Científico e Tecnológico (CNPq) for funding this research.
Appendix A. Supplementary data
Supplementary data related to this article can be found at
http://dx.doi.org/10.1016/j.jenvman.2013.01.017.
References
Ahmad, A., Rafatullah, M., Sulaiman, O., Ibrahim, M.H., Hashim, R., 2009. Scavenging behaviour of meranti sawdust in the removal of methylene blue from aqueous solution. J. Hazard. Mater. 170, 357e365.
Bellir, K., Bouziane, I.S., Boutamine, Z., Lehocine, M.B., Meniai, A.H., 2012. Sorption study of a basic dye“Gentian violet”from aqueous solutions using activated bentonite. Energy Proced. 18, 924e933.
Chakraborty, S., De, S., DasGupta, S., Basu, J.K., 2005. Adsorption study for the removal of a basic dye: experimental and modeling. Chemosphere 58, 1079e1086.
Dean, J.A., Lange, N.A., 1999. Handbook of Chemistry. McGraw-Hill.
El Qada, E.N., Allen, S.J., Walker, G.A., 2008. Adsorption of basic dyes from aqueous solution onto activated carbons. Chem. Eng. J. 135, 174e184.
Forgacs, E., Cserhati, T., Oros, G., 2004. Removal of synthetic dyes from wastewaters: a review. Environ. Int. 30, 953e971.
Freundlich, H., 1906. Concerning adsorption in solutions. Z. Phys. Chem.eStoch. Ve.
57, 385e470.
Garg, V.K., Kumar, R., Gupta, R., 2004. Removal of malachite green dye from aqueous solution by adsorption using agro-industry waste: a case study of Prosopis cineraria. Dyes Pigm. 62, 1e10.
Ghosh, D., Bhattacharyya, K.G., 2002. Adsorption of methylene blue on kaolinite. Appl. Clay Sci. 20, 295e300.
Gong, R.M., Zhu, S.X., Zhang, D.M., Chen, J., Ni, S.J., Guan, R., 2008. Adsorption behavior of cationic dyes on citric acid esterifying wheat straw: kinetic and thermodynamic profile. Desalination 230, 220e228.
Gupta, V.K., Mittal, A., Krishnan, L., Gajbe, V., 2004. Adsorption kinetics and column operations for the removal and recovery of malachite green from wastewater using bottom ash. Sep. Purif. Technol. 40, 87e96.
Gurgel, L.V.A., de Freitas, R.P., Gil, L.F., 2008. Adsorption of Cu(II), Cd(II), and Pb(II) from aqueous single metal solutions by sugarcane bagasse and mercerized sugarcane bagasse chemically modified with succinic anhydride. Carbohydr. Polym. 74, 922e929.
Gusmao, K.A.G., Gurgel, L.V.A., Melo, T.M.S., Gil, L.F., 2012. Application of succiny-lated sugarcane bagasse as adsorbent to remove methylene blue and gentian violet from aqueous solutionsekinetic and equilibrium studies. Dyes Pigm. 92,
967e974.
Hamdaoui, O., 2006. Batch study of liquid-phase adsorption of methylene blue using cedar sawdust and crushed brick. J. Hazard. Mater. 135, 264e273.
Hameed, B.H., 2008. Equilibrium and kinetic studies of methyl violet sorption by agricultural waste. J. Hazard. Mater. 154, 204e212.
Hameed, B.H., 2009. Spent tea leaves: a new non-conventional and low-cost adsorbent for removal of basic dye from aqueous solutions. J. Hazard. Mater. 161, 753e759.
Hameed, B.H., Krishni, R.R., Sata, S.A., 2009. A novel agricultural waste adsorbent for the removal of cationic dye from aqueous solutions. J. Hazard. Mater. 162, 305e311.
Ho, Y.S., McKay, G., 1998. Kinetic models for the sorption of dye from aqueous solution by wood. Process Saf. Environ. Prot. 76, 183e191.
Ho, Y.S., Chiu, W.T., Wang, C.C., 2005. Regression analysis for the sorption isotherms of basic dyes on sugarcane dust. Bioresour. Technol. 96, 1285e1291.
Hong, S., Wen, C., He, J., Gan, F.X., Ho, Y.S., 2009. Adsorption thermodynamics of Methylene Blue onto bentonite. J. Hazard. Mater. 167, 630e633.
Ip, A.W.M., Barford, J.P., Mckay, G., 2009. Reactive Black dye adsorption/desorption onto different adsorbents: effect of salt, surface chemistry, pore size and surface area. J. Colloid Interf. Sci. 337, 32e38.
Juang, R.S., Chen, M.L., 1997. Application of the Elovich equation to the kinetics of metal sorption with solvent-impregnated resins. Ind. Eng. Chem. Res. 36, 813e820.
Karnitz, O., Gurgel, L.V.A., de Melo, J.C.P., Botaro, V.R., Melo, T.M.S., Gil, R.P.D.F., Gil, L.F., 2007. Adsorption of heavy metal ion from aqueous single metal solution by chemically modified sugarcane bagasse. Bioresour. Technol. 98, 1291e1297.
Karnitz, O., Gurgel, L.V.A., de Freitas, R.P., Gil, L.F., 2009. Adsorption of Cu(II), Cd(II), and Pb(II) from aqueous single metal solutions by mercerized cellulose and mercerized sugarcane bagasse chemically modified with EDTA dianhydride (EDTAD). Carbohydr. Polym. 77, 643e650.
Lagergren, S.Y., 1898. Zur Theorie der sogenannten Adsorption gelöster Stoffe, Kungliga Svenska Vetenskapsakademiens. Handlingar 24, 1e39.
Langmuir, I., 1918. The adsorption of gases on plane surfaces of glass, mica and platinum. J. Am. Chem. Soc. 40, 1361e1403.
Lata, H., Garg, V.K., Gupta, R.K., 2008. Adsorptive removal of basic dye by chemically activated Parthenium biomass: equilibrium and kinetic modeling. Desalination 219, 250e261.
Liu, Y., 2009. Is the free energy change of adsorption correctly calculated? J. Chem. Eng. Data 54, 1981e1985.
Mohanty, K., Naidu, J.T., Meikap, B.C., Biswas, M.N., 2006. Removal of crystal violet from wastewater by activated carbons prepared from rice husk. Ind. Eng. Chem. Res. 45, 5165e5171.
Navarro, R.R., Sumi, K., Fujii, N., Matsumura, M., 1996. Mercury removal from wastewater using porous cellulose carrier modified with polyethyleneimine. Water Res. 30, 2488e2494.
Noh, J.S., Schwarz, J.A., 1990. Effect of HNO3treatment on the surface-acidity of
activated carbons. Carbon 28, 675e682.
Pereira, F.V., Gurgel, L.V.A., de Aquino, S.F., Gil, L.F., 2009. Removal of Zn(2þ) from electroplating wastewater using modified wood sawdust and sugarcane bagasse. J. Environ. Eng.eASCE 135, 341e350.
Reed, B.E., Vaughan, R., Jiang, L.Q., 2000. As(III), As(V), Hg, and Pb removal by Fe-oxide impregnated activated carbon. J Environ Eng-Asce 126, 869e873.
Royer, B., Cardoso, N.F., Lima, E.C., Vaghetti, J.C.P., Simon, N.M., Calvete, T., Veses, R.C., 2009. Applications of Brazilian pine-fruit shell in natural and carbonized forms as adsorbents to removal of methylene blue from aqueous solutionsekinetic and equilibrium study. J. Hazard. Mater. 164, 1213e1222.
Srivastava, V.C., Mall, I.D., Mishra, I.M., 2008. Adsorption of toxic metal ions onto activated carbonestudy of sorption behaviour through characterization and
kinetics. Chem. Eng. Process. 47, 1275e1286.
Sun, Q.Y., Yang, L.Z., 2003. The adsorption of basic dyes from aqueous solution on modified peat-resin particle. Water Res. 37, 1535e1544.
Tempkin, M., Pyzhev, V., 1940. Kinetics of ammonia synthesis on promoted iron catalysts. Acta Physicochim. URSS 12, 327e356.
Uddin, M.T., Islam, M.A., Mahmud, S., Rukanuzzaman, M., 2009. Adsorptive removal of methylene blue by tea waste. J. Hazard. Mater. 164, 53e60.
Weber, W.J., Morris, J.C., 1963. Kinetics of adsorption on carbon from solution. J. Sanitary Eng. Division 89, 31e60.
Xiao, B., Sun, X.F., Sun, R.C., 2001. The chemical modification of lignins with succinic anhydride in aqueous systems. Polym. Degrad. Stab. 71, 223e231.
Xing, Y., Deng, D.H., 2009. Enhanced adsorption of malachite green by EDTAD-modified sugarcane bagasse. Separat. Sci. Technol. 44, 2117e2131.