A climatological study of the
trospospheric circulation over the Amazon region
Abstract
Clímatological and monthly means are computed for radiosonde data at Manaus and Belém (1968-1976). Geopotencial height and wind data at upper leveis show evidence of the meridional movement of a strongly divergent high pressure system associated with the area of maximum convection. At low leveis, the wínds, par-tícularly at Manaus, show an annual cycle linked to the meridional displacement of the equatorial trough and its accompanying area of maximum convectlon (upper levei high pressure system). On the average, the pre-cipitable water (Pw) is greater at Manaus than at Be-lém . However, evidence is presented indicating that this is not always the case and that considerable diurnal variation in Pw exists at each station. Mean monthly vertical motions are calculated for the area withln the triangle formed with Belém, Manaus and Vílhena as the vertices. These vertical motions show a strong rela-tionship to monthly rainfall totais within the triangle indicating that interannual and monthly rainfall variations may be due to large scale atmospheric circulation changes.
lNTRODUCTION
Until the late 1960's radiosonde data for the Amazon Basin were virtually non-existent, and little was know about the mean atmospheric circulation of thG reg ion. The first studies to incorporate radiosond edata for this region were thcse by Dean (1971) and Newell et
a/.
(1972). In both studies, less than two years of datél were availabla from the Amazon region. Marqueset a/.
(
1977) studied precipitable watei· and water vapor flux for the Amazon Basin baseá on the radiosonde data for M3naus and Belém durina ·1974. Obviously, the amount of data used in the above studies is insufficient to establish climatological means.In an attempt to establish more representa-tive means for the wi nd and temperatura fields Sobral (1979) analyzed upper air data for ali of
Vernon E. Kousky (,_) Mary T. Kagano (*)
South America for the period 1969-1973. Marques (1978) made a comprehensive study of the upper air circulation over the Amazon Basin, using radiosonde data for severa! stations in northern South America for the period 1972-1975. H e concluded that the At lantic Ocean supplies water vapor to the Amazon region throughout the year and that seasonal variations in rainfall are due to the apparent meridional displacement of the Sun. Marques noted that the layer from the surface up to 500 mb is characterized by water vapor flux convergence over most of the Amazon Basin implying that the region acts as a water vapor sink .
Marques made no reference to year-to-year variations in rainfall, although large variations from the mean of ± 30 % do occur. These vari-ations may be due to large scale tropospheric circulation changes within mid-latitudes. such as those which have been related to rainfall variability over the semi-arid regions of Northeast Brazil (Namias, 1972; Hastenrath & Heller. 1977; Kousky, 1979). The effects that such cha nges have on the tropical circulation are still not clearly understood. However, the mid-latitude circulation pattern may affect the pattern of divergence and convergence within the tropics, as suggested by Namias (1972) and Kousky ( 1979). which would ai ter the tropical circulation pattern.
In this paper we will describe certaln aspe<.ts of the upper air cl imatology for the Amazon Basin based on radiosonde data for the period 1968-1976. Special emphasis will be given to physical explanations for observed ch3racteristics. Clearly, the results for such a short period of t ime must be considered tenta-tive.
( • ) - Instituto de Pesquisas Espaciais. São José dos Campos, SP.
DATA
The radiosonàe data for the period 1968-1976 were acquired from the National Climatic Center (NCC), Asheville, North Carolina, U.S.A., and are archived on magnetic tape. In general, the data available from NCC repre-sent only a fraction of the total number of observations made. With the assistance of the Instituto de Atividades Espacias, (IAE), which is a part of the Centro Técnico Aeroespacial, São José dos Campos, Brazil, radiosonde data were acquired for Belém (1°23'S, 48° 29'W) and Manaus (3°8'S, 60<> 1 'W) for the period 1 January-31 December 1974. These data will be compared in this article to the data available trom NCC.
Ali data were subjected to consistency checks in order to filter out errors. Tempera-ture data were considereâ erroneous if the lapse rate became superadiabatic. This test should be fairly reliable, since the data availa-ble were taken at 8-9 AM and 8-9 PM during times when surtace superadiabatic lapse rates do not normally occur. Once detected, errone-ous temperaturas were replaced by interpo-lated values. Relative humidity was, in general, left with its original value, wind data were checked for vertical consistency, and geopo-tential heights were calculated using the hypsometric equation. Precipitable water was calculated using data at both significant and standard leveis up to the levei at which the temperatura became colder than -40. 1°C and relative humidity data were no longer available.
REsuLTS (Ciimatological means)
GEOPOTENTIAL HEIGHT AND SURFACE PRESSURE The monthly climatological means for geopotential hetght, calculated using the entire data record (1968-1976), are shown in Fig. 1. Th~ curves for Manaus and Belém have certain basic similarities, such as the annual lation at low leveis and the semiannual oscil-lation at high leveis. The maximum geopo-tential height, for the upper troposphera
(300-200 mb), occurs at both stations during the Southern Hemisphere Fali season (Aprii-May) . A secondary maximum at high leveis
744-occurs in the Spring (October at Belém and Noverber at Manaus) . At low leveis a single maximum is observed during the Southern Hemisphere Winter (July) and a single broad minimum is observed during the Summer months. At ali leveis the curves show more irregularity at Manaus than at Belém. The curves for surface pressure (Fig. 2) show characteristics similar to the curves of geopo-tential height at 1000 mb.
WIND
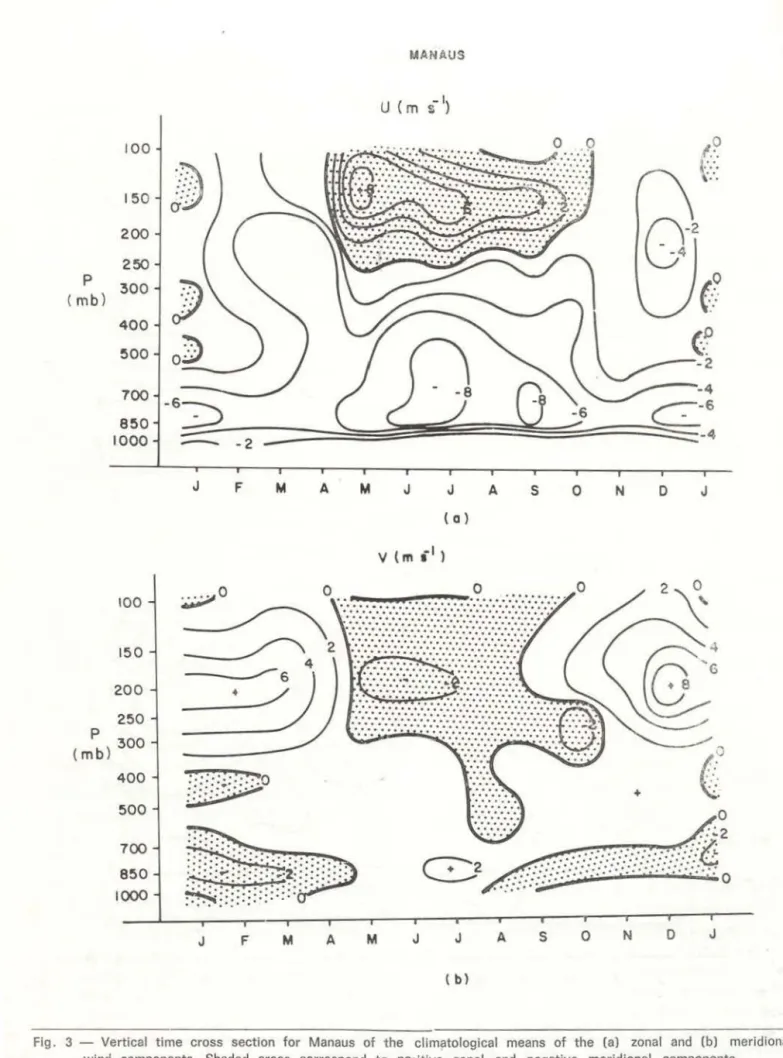
The monthly climatological mean zona! (u) and meridional (v) wind components for Ma-naus and Belém are shown in Figs. 3 and 4, respectively. At high leveis (200 mb), at Ma-naus, the wind is from the south or southeast during the period December through April. The wind abruptly shifts to the northwest in May with the westeriy component continuing until November and the northerly component con-tinuing until September.
At low leveis (850 mb) the u-component remains negative (easterly) throughout the year, while the v-component is positive (southerly) during the period May-Augu~t and negative (northerly) the rest of the year. The northedy component is strongest from January to March.
At Belém the situation is somewhat differ-ent. Near 200 mb winds are predominantly southwesterly during the period October to March, southeasterly in April and westerly or northwesterly from May to September. At low leveis, southeasterly winds prevail throughout the year reaching a distinct maximum in July and a relativa minimum from February through April.
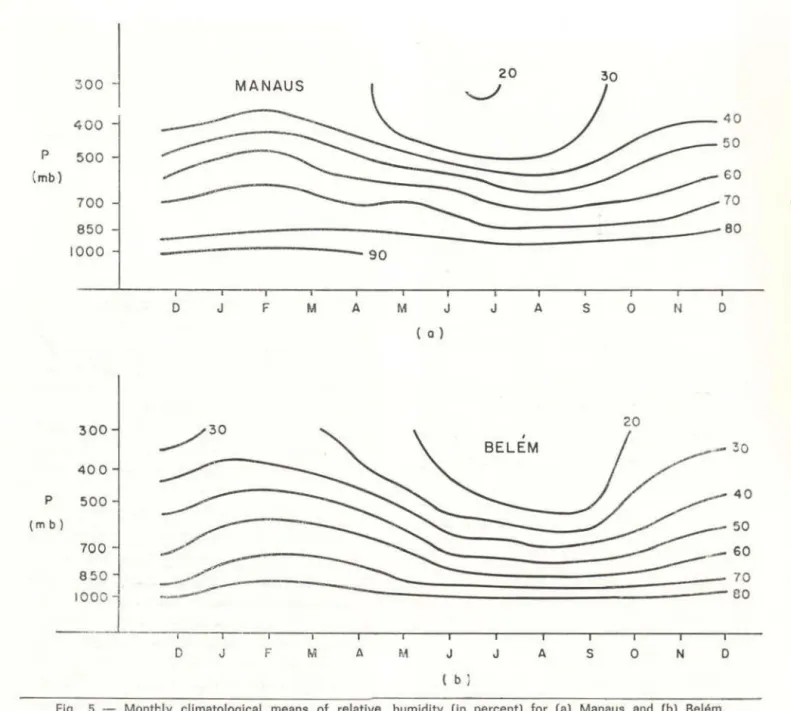
RELATIVE HUMIDlTY AND PRECIPITABLE WATER The monthly climatological means of reta-tive humidity are shown in Fig.
s.
In general,the two stations show quite similar results with the relative humidity being highest during the period Januêlry-April and lowest from June through September. The annual variability of relative humidity increases with increasing ·height.
Ê
400 E ..J ..Jsoo
~ 200
z
~ 100
ct:
D.I,IIIAIII.I.IASOND
f f i i i i
D .I '111 A 111
(a)
lllb ISO
soo
400
soo
700
150
1000
i
S O N D
I
-10111400 E E 300
..J ..J ~
z
200c-
100a:
--
r--~~
BEL EM
I-
-
-po-
'"""r--'"""po-O J F M A W J J A S O H O
mb 150
100
150
l-10111
soo
400
soo
D . I ' fll AM .I .I AS O N D
(b)
Flg. 1 - Deviations of geopotencial height (at standard pressure leveis) from the cllmatologlcal means and his· togram of monthly mean ralnfall computed for the perlod 1968-7976 at (a) Manaus and (b) Belém . Height scale ls
lndlcated at rlght of figure.
The monthly climatological means of pre-cipitable water (Fig . 6) hav an annual variation similar to that of rei ative humidity . Fig. 6 also shows a falrly good positive correlation between precipitable water and precipitation. One ~lso notes that the precipit::tble water is greater at Manaus than at Belém, a feature also noted by Marques
et ai.
(1977) and by M::trques(1978).
DrscussxoN (Ciimatological means)
The semlannual oscillation noted in the geopotentian height. at high leveis (Fig. 1). is probably due to the latitudinal displacement of maximum convective activity and, therefore, maximum precipitation . In areas of maximum precipitation the atmosphere, experiences heating due to the release of latent heat during condensation . This heating produces a greater thickness between pressure leveis. thus pro-ducing, at high leveis a maximum in ge-opotential height.
Durlng the perlod June through September. the maximum rainfall occurs north of the equator in southern Venezuela and eastern Colombia (Snow, 1976). In October and No-verber this activity shifts southward over western Amazonas and continues to shift southward and southeastward until in January it reaches the area of Bolívia and Mato Grosso,
p
( mb)
O J F M A M J J A S O N O
Fig . 2 - Monthly Climatological means of surface pressure for Manaus and Belém.
746-Brazil. In March the activity begins to shift northward until in April it is located over the Amazon River. From May to June the maximum in rainfall shifts nortwestward towards Vene-zuela and Colombia.
This same seasonal shift in maximmu con-vective activity is noted in average brightness charts made from polar orbiting satellite data
(Fig. 7) .
By considering the effects of continuity. divergence at h1gh leveis must be associated with rising air motion at mid-levels and con-vergence at low leveis . This signifies that at low leveis, in the region of maximum con-vective activity, relatively low pressure must be present. Once formed, the system as a who le is to som'3 degree self-maintained. Low levei mass and water vapor convergence leads to strong convection, which in turn produces heating due to condensation within the lower and middle troposhere . This heating results in a greater thickness between pressure leveis and the development at high leveis of a high pressure system characterized by divergence. The divergence aloft favors the maintenance of the surtace low pressure area .
lt is not clear what the initial causes are for thP. development of this circulation system. Perhaps strong solar heating acts initially to lower surface pr&ssure and increase instability. Perhaps topographic influences, such as those produced by the Andes, act to organize con-vectior. which In turn may produce the high aloft. Whatever the initial causes are. it is apparent from the discussion above that once formed the system has certain feed back mechanisms which permit its self-maintenance for long periods of time .
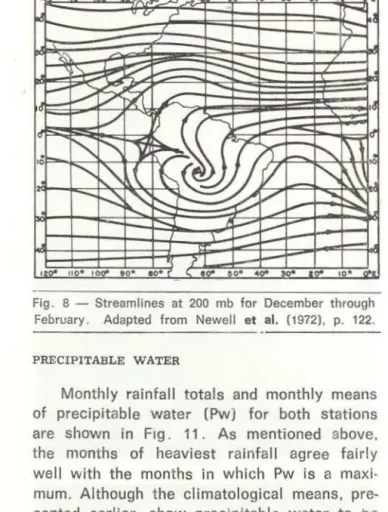
The wind data are in basic agreement with the geopotential height data. During the period that the 200 mb high is situated over Bolívia and Mato GrossO', Brazi!, winds at high leveis strongly diverge from this region and cross the equator (e. g. south-southeasterly winds at Manaus and southerly winds at Belém) . This wind distribution is similar to that obtained by Newell
ata/.
(1972) (see Fig. 8). The low levei winds at Manaus are from the northeast thus supporting the idea of a surface low pressure100
150
200
250 p 300 ( mb)
400
500
700
850 1000
100
150
200
250 p ( mb ) 300
400
500
700
850 1000
J F A
____,-- 4
--·-!)
::"::.:
:::.~o~
J F M A M
tAAN AUS
J J
( a )
A
s
o
No
+
o
1:.
::
,.
..
J
o
.:.:2
8
2 ..::i/
J.r.::<'f::
~'
u·:
:·::::J/f
o
J J A
s
o
No
J( b)
Fig. 3 - Vertical time cross section for Manaus of the climatological means of the (a) zona I and (b) meridional wind components. Shaded areas correspond to po;ltive zonal and negativa meridional components.
100
150
200
p
250
( mb )
300
400
500
100
150
200
p
250
( mb)
300
748-400
500
700
850
1000
J
J
I
BELEM
u (
ms
1)c-
-8-
-6--4
F M A M J J A S
o
No
J(a)
v (
m 5
1)F
M
A
M
J J A S O N O J( b)
Flg. 4 - As In Fig. 3, exêept for Belém.
300
~
MANAUS...._/
20 30400 40
50 p 500
(mb) 60
700 70
850 80
1000 90
o
J F A M J J As
o
No
( o )
300
,
20BEL EM
400p 500 40
(m b) 50
700
~
~
850 - 70
1000
-ao
o
J F M A J J As
o
No
( b )
Fig . 5 - Monthly climatological means of relativa humidity (in percent) for (a) Manaus and (b) Belém.
system to the south of Manaus. At Belém the low levei winds remain southeasterly but are weaker during the period February through April. Thus, in the average, the intertropical trough zone remains north of Belém during the entire year but is closest from February through April. This agrees with the results of Has-tenr:.th & Lamb ( 1977) . lt seems probable that a trough of low pressure extends from near the mouth of the Amazon, the mean position of the !ntertropical trough over the Atlantic (Hastenrath & Lamb, 1977), to Mato Grosso and Bolívia along which convergence and he.1ce convective activity is a maximum.
A climatological ...
Between April and May the meridional wind component at low leveis at Manaus switches from northerly to southerly indicating that the equatorial trough over the continent is shifting to north of Manaus. This is ac-companied at high leveis at both stations by a wind shift to t.he west-northwest. Also both stations show rainfall decreasing during the period May-June as the main convective ac-tivity shifts north and northwestward towards height and surface pressure curves at Manaus, Venezuela and Golombia. 8oth Newell
et a/.
E E ..J ..J <{ lL
z
<{ a: E E ~ Cl. E E ... ..J ..J <{ lL..z
<{ a: 300 200 100 50 45 40 300 200 100 MANAUS DJFMA MJJASOND OJFMAMJJASONDr,..-,
r~ I I
I I I ... .,.., ' I I I I I I . SELEM
r~ I I I I I ri
: : I : : 1 1 I I
I 1 I I I L--;-, : :
I I I I I I I ·-~~J""i I I I I I I I I I I I I I I I I I I I I I I I I I 1 I 1 I I 1 1 I I
O J F M A M J J A S O N O
Fig. 6 - Monthly climatological means of precipitable water (mm) for Manaus (solid llne) and Belém (dashed llne) and the corresponding histogram of monthly mean rainfall for each station calculated for the perlod
1968-1976.
circulation over Venezuela and Colombia. although both works do show the presence of a ndge. lhe results at 200 mb for April and October (Sobral, 1979), agree with the dis-cussion é:lbove in that the high is located over western Amazonas in October and over central Amazonas in April .
lhe greater irregularity in the geopotential noted previously (see Fig. 1), may be a result of cold frontal penetrations into the Amazon Basin during the Southern Hemisphere Winter. Such cold frontal penetrations have been shown to have a significant effect on temperature, wind and cloudiness over the Amazon Basin (see e. g. lrewartha, 1961; Brinkman
et ai.,
1971; Parmenter, 1976). lt appears plausible that the low levei temperatura variations be
750-associated with variations in the geopotential hetght calculated at uppe!" leveis. In this re-spect, intruding r.old frontal systems may have ,a pronounced cffect on the intensity of the 200 mb high and convective activity over tropical Brazil.
REsur.Ts (Montl·.ly means) WIND
Cert?.in characteristics of the monthly mean wind components for Manaus and Belém, Fig. 9 and 1 O, respectively, repeat with some regularity from one year to the next. lhe seasonal variation in the 850 mb v-component at Manaus (Fig . 9b) is readily apparent as v, in general, switches from northerly to southerly lduring the period Aprii-May and from southerly in September. lhe 850 mb, v-component at Ma-naus (Fig. 9a) is, in general, weakest in April and November, which are the times when the equatorial trough over the continent passes Manaus (see discussion in previous section) . lhe low levei wind field at Belém also shows a certair. regularíty from one year to the next . lhe 850 mb southerly winds (Fig . 10b) reach a maximum each year from June to August and are at a minimum from December through March (sometimes through Apnl). !The USO mb zonal wind comopnent at Belém (Fig. 10b) is notas regular as the v-component. However, the 1000 mb zonal wind does show certain regularity in that there are m;nimal present from December through April each year.
lhe upper troposheric zonal winds at both stations (Fig. 9a and 1 Oa) show the presence of westerlies during the Southern Hemisphere winter months, although the intensity and times of occurrence are quite variable. Also, due to the !'elative position of the 200 mb high with respect to Manaus and Belém, Belém normally does not observe mean easterlies during the Southern Hemisphere Summ.:.r, a feature which is observable with regularity at Manaus (see Fig. 8 for an illustration of the above) .
Fíg . 7 - Mean brightness charts constructed from visible satellite data. (After Miller and Feddes 1971 , pp. 21 O, 214, 218 and 222).
Fig. 8 - Streamlines at 200 mb for December through February. Adapted from Newell et ai. (1972), p. 122.
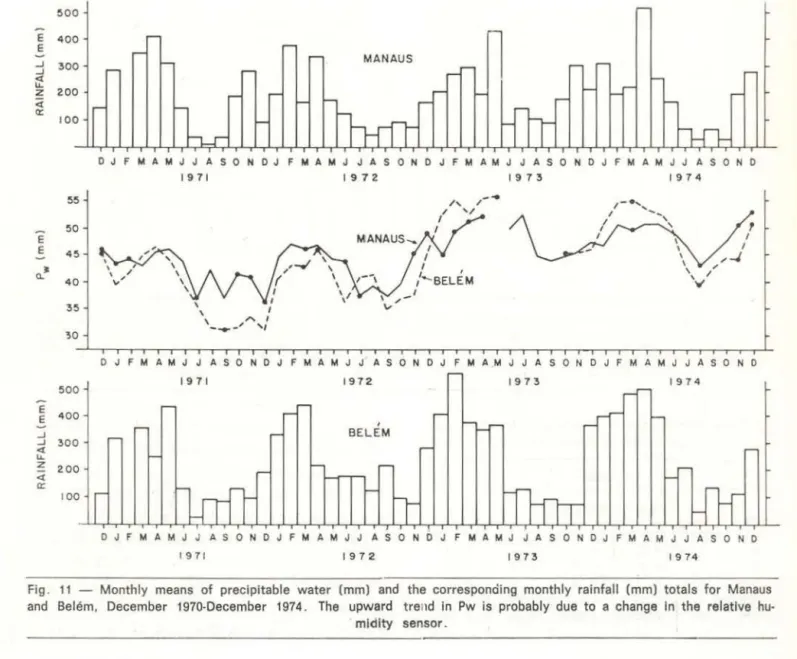
PRECIPITABLE WATER
Monthly rainfall totais and monthly means of precipitable water (Pw) for both stations are shown in F1g. 11. As mentioned above, the months of heaviest rainfall agree fairly well with the months in which Pw is a maxi-mum. Although the cl imatological means, pre-sented earlier, show precipitable water to be greater at Manaus than at Belém, it is apparent from Fig. 11 that this is not always the case. During the Southern Hemisphere Summers of 1973 and 1974 Belém, registered higher values o f Pw than Manaus.
The upward trend in Pw noted at both stations is probably due to the use of a differ-ent relative humidity sensor beginning about the end of 1972 .
A comparison made between monthly means of precipitable water calculated using the NCC data and Pw calculated using the
more complete data set available from IAE
showed very little difference.
DISCUSSIONS (Monthly means)
As mentioned in the introduction, annual rainfall at stations within the Amazon Basin varies by as much as ::!: 30 % from the long
term mean. lt was suggested that such vari-ations may be due to large scale circulation changes such as those shown to correlate with
752-rainfall anomalies in Northeast Brazil. To exemplify how the large scale flow affects rainfall over the Amazon Basin, the horizontéll divergence within the triangle formed by
Ma-naus, Belém and Vilhena was calculated at each standard pressure levei using monthly mean winds. The method for calculating th<-horizontal divergence is the same as that f irst propo.:;ed by Bellamy (see Haltiner & Martm, 1957: 315 or Kagano, 1979).
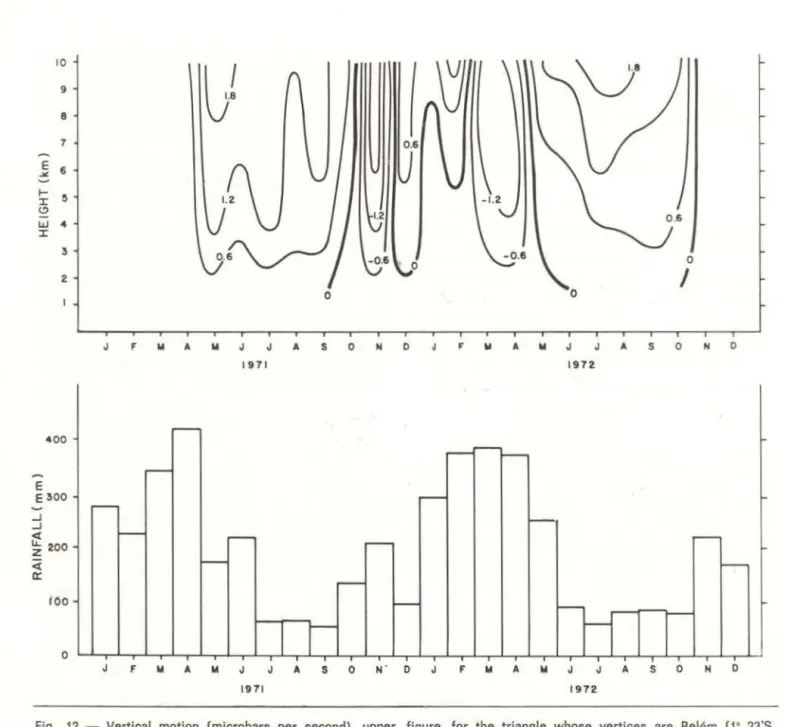
The horizontal divergences were then used to calculate vertical motions using the conti-nuity equation. The results for 1971 and 1972 are shown in Fig. 12. Also indicated in Fig. 12 ar8 the monthly rainfall totais averaged for three stations within the triangle. Note that the months characterized by sinking motion
(w
>
O) are, in general, the driest months . Consider the period October-December 197"1 . October was characterized by nearly zero mean vertical l]lOtion, while November had strongrising motion (w<
O). December, on the othe1 hand, was characterized by sinking motior; (w>
0) . Note that rainfall was heavi-est d•Jring November and then dropped off markedly in December. The monthly mean relative humidity showed the same variation as the rainfall. Precipitable water (Fig. 11) at both Manaus and Belém shows a reduction from November to December. Thus it appears that large scale convergence or divergence has a pronounced effect on rainfall and moisture content of the air over the Amazon Basin. Thisresult is in general agreement with the results o f Marques ( 1978) .
Recently, Kousky (1980) and Marques -(1978) showed considerable diurna! variation in rainfall activity at Belém, which he attribut€d ot the local land-sea breeze circulation systems. During the nightrime considerable convergence and rainfall occurs along the coast (Soure). while Belém remains dry. lf we assume rising motion along the coast due to convergence between the southeast trades and relatively light, or even possibly offshore winds along the coast, then to complete the circul:~tion
sinking motion would be expected at points just inland, e_ g. near Belém. The sinking motion would have the effect of drying the air, thus gíving Belém a relatively low value of Pw.
100
®
150200
250 p (mb) 300
400
500
700 (.{)
850
::> 1000
<(
z
100
<(
~ 150
200
250
p 300
(mbl 400
500
@
700 850 1000
(
JFMAM~JASONOJFMAMJJASONOJFMAMJJASONOJFWAMJJASONO
I
l
4J
V(msl)
ylr(:v
·~ ~
u·
o
o
. .
V
.
4
J F M A M J J A S O N O J F M A M J J A S O N O J F . ~ ~ ~
j j
Á
~O
~bl
j
~ ~l
~j j
Á
~O
~bl
1971 1972 1973 1974
Fig . 9 - Vertical time cross sectlons for Manaus o f the monthly mean (a) zona I and (b) meridional wind components. Shaded areas correspond to positiva zonal and negativa meridional components.
Once the sea breeze develops and begins to propagate inland, reaching Belém during the late afternoon, rising motion would lead to increasing values of Pw . In fact, increased
conv ~ ctive activity at any location would tend
to moisten the troposphere thus increasing the vaiue of Pw.
Although most .c;ounding<> within tropical
Br~ zil are made at 1200, an effort was made to take 0000 GMT soundings during June-Septem-ber 1974 in collaboration with the GARP Atl3ntic Tropic é~ l Experiment. lhe monthly mean values of Pw at both the 0000 GMT and 1200 GMT times for both Manaus and Belém are listed in Table 1. The effect of the sea breeze at Belém is quite obvious with an
~o o
E E 400
...J 300
...J
~
z 200
<l
0:
100
average of 12 % more precipitable water at 0000 GMT. The results at Manaus do not show this same sort of diurna! variation . In fact, on
the average the precipitable water content at, 0000 GMT is slightly less than at 1200 GMT .
A possible explanation for this apparent reversal at Mar.::~us may be inferred from the results of Kousky (1980) . Kousky suggested thRt nocturnal precipitation, occurring about 500 km lnland from the coast, is a result of sea breeze induced convection which continues o propagate inland during the nighttime hours. To support this hypothesis, Kousky presented a sequence of infrared satellite pictures for July 1979 which cl early shows the formation of convection along the coast and its subse-quent inland propagation .
OJFMAMJ J ASONOJFMAMJJASONOJFMAMJJASONO J FMAM JJ ASON O
E
E
o.•
E E
...J ...J <l
u.
~
<l
0:
~~
~o
4~
40
3~
~o
~ 00
400
3 00
200
100
1971 1972 1973 1974
'
I I
I ,_J
'
\ /"
v
O JFMAMJJASONOJF M AMJJASONOJFMAMJJASONDJFMAMJJASOND
19 71 1972 19 73 1 974
, BEL EM
OJ FMAM JJ A SO NO J FMAMJJ ASONOJ FMAM J J ASOND JF MAM JJ A SO N O
I 9 7 1 19 7 2 1973 1974
Fig . 11 - Monthly means of precipitable water (mm) and the corresponàing monthly rainfall (mm) totais for Manaus and Belém, December 1970-December 1974. The upward treud in Pw is probably due to a change In the relativa
hu-mldlty senso r .
lO
LI
9
8
7
E 6
~
1-~
r
(!)
w 4
r
3
o
2
I
o
o
J F
..
A..
J J A s o N o F..
A..
J J A s o N o1971 1972
-4 00
---
....----E
E 300
r
-..J..J
r--
....----
-
....----~
~ 200
<
r--
-«
r--too
-
r
-l
r
-o
J F W A M J J A S O N ' O J F W A M J J A S O N O
1971 1972
Fig. 12 - Vertical motlon (microbars per second), upper figure, for the triangle whose vertices are Belém ( 1• 23'S, 49• 29'W) Manaus (3• S'S, 60• 1'W) and Vilhena (12• 44'S, 60" B'W). and a histogram of mean monthly rainfall wlthin the trlangle. Statlons used In calculatlng the mean ralnfall are : Alto Tapajós (7• 21'S, 57• 31 'W), Altamira (3• 13'S, 52'
12'W) and ltaituba (4• 16'S, 55• 59'W). Negativa values correspond to resing motion.
TABLE 1 - Monthly means of preclpitable water (em) at Belém and Manaus (June-September 1974)
Manaus Belém
~---~~---~---::~\1200
GM joooo GM' I )OOO GMTI12oo GMT-June 4.95 4.76 5.03 5.24
July 4 .96 4.53 4.31 5. 12 August 4.31 4.36 3.93 4.59 September 4.56 4.65 4.26 4.71
Mean 4.63 4.57 4.38 4.92
756-lt seems plausible to conclude that the organizecJ convection associated with the coastal sea breeze is an import:mt mechanism increasing the precipitable water. The in-creased water content in the column, especially in the lower troposphere (850-700 mb) is t hen advected inland whether or not it is associated with active conv'3ctive cells, and arrives in the Manaus area in the early morning (around
·1200 GMT) . For the moisture to be advected
1000 km in about 18 to 21 hours indicates a speed of 13-15
m s·\
whlch is falrly close to the climatologlcal mean wind speeds during thf' period June through September (Figs. 3 and 4).CoNCLUSIONS
The seasonal variation in rainfall over Amazonas appears to be related to the position and intensity of a high pressure system loc:~ted
in the upper troposphere (200 mb). l he winds and geopotential height at both stations agree well with the argument that the the high makes a complete circuit beginning in January over Bolívia and Mato Grosso, Brazil, moving northward in April to the equator, then northwestward to Venezuela and Colombia by June and July, and finally returning to Bolívia by way of Peru and western Amazonas, Brazil. lntenmnual variations in the intensity of this high may be linked to mid-latitude influences such as the low latitude penetration of cold frontal systems.
Monthly variations in total precipitation have been shown to be related to the di-vergence and vertical motions calculated using monthly mean winds over a fairly large area'. This suggests that large scale circulation ch<tnges are p"obably the main cause for inte:·Mnual and monthly rainfall variations.
On the average, the precipitable water is greater at Manaus than at Belém. However, evidence has been presented which shows that this is not always the case and that the diurna! variation of Pw. differences between the monthly means claculated at 1200 GMT and those calculated at 0000 GMT, may be quite large.
ACKNOWLEDGEMENTS
The authors wish to thank Dr. Antonio Di-vino Mo11ra for reviewing the m:~nuscript and
also for his encouragement and suggestions during the preparation of this paper. We also wish to thank the peraonnel at the Instituto de Atividades Espaciais, Centro Técnico
Ae-A climatological . ..
roF:sp:~cia l , São José dos Campos, for their support in acquiring radlosonde data for Ma-naus and Belém.
This work is an extension of the second author's M. Se. dissertation.
lt was partially supported by Financiadora Estudos e Projetos (FINEP) through Convênio
B 28/79/ 002/ 00/ 00 Modelagem Atmosférica
FINEP/ CNPq.
Resumo
São calculadas as médias climatológicas e men-sais para os dados de radiossondagem de Manaus e Be-lém, para o período de 1968 a 1976. Os dados de ?ltu-ra geopotencial e vento, nos níveis superiores, most?ltu-ram evidência do deslocamento meridional do sistema de alta pressão associado à área de convecção máxima. Em baixos níveis, os ventos, particularmente em Manaus, mostram um ciclo anual ligado ao deslocamento meri-dional do cavado equatorial e sua área de convenção máxima (sistema de alta pressão na alta atmosft!ra) . Em média a água precipltável (pw) é maior em Manaus que Belém. Porém, está em evidência que isso nem sempre é o caso e que existe uma considerável varia-ção diurna em Pw em cada estavaria-ção . As médias men-sais de movimento vertical são calculadas para a 1\rea dentro do triângulo Belém, Manaus e Vllhena, como os vértices. Existe uma correlação multo forte entre o mo-vimento vertical e os totais mensais de precipitação dentro do triângulo, indicando que as variações Inter-anuais e mensais na precipitação podem ser atribUidas às mudanças na circulação atmosférica de grande esca-la .
REFERENCES
BRINKMANN, W.l.; WEINMAN. J.A. & RIBEIRO. M.N. Goés
1971 - Air temperaturas in Central Amazonla. I.
Act a Amaonica, 1 (2): 51·56 . DEAN, G.A.
1971 - Three-dimensional wind structure over South America and associated ralnfall over Brazil. Fia. State Univ., Oep. Meteoro!., Rept.. 71-4: 122p.
HALTINER, G.J . & MARTIN, F.L.
1957 - Dynamical and Physical Meteorology. Mc-Graw-Hill. 470p.
HASTENRATH, S. & HELLER. L.
1977 - Oynamics of climatic hazards in Northeast Brail. Quart. J. Roy Met eor. Soe., 103: 77-92.
HASTENRATH, S. & LAMB, P.
1977 - Climatic Atlas of the Tropical Atlantic and Eastern Pacific Oceans. Univ. of Wisconsin Press, 1 06p.
KAGANO, M.T.
1979 - Um estudo climatoiG-gico e sinótico utilizan-do dautilizan-dos de radiossondagem (1968·1976) de Manaus e Belém. M. Se. dissertation. São José dos Campos, lnst. de Pesq. Espaciais. 82p.
KOUSKY, V.E.
1979 - Frontal influences on Northeast Brazil. Mon. Wea. Rev., 107: 1140·1153.
1980 - Diurna! rainfall variation in Northeast Brazil. Mon. Wea. Rev., 108: 488-498.
MARQUES, J.
1978 - A transferência horizontal de vapor d'água na troposfera e a hodrologia da bacia ama· zônica . Ph.D. dissertation. Univ. de São Paulo, Escola Superior de Agricultura "Luiz de Oueiróz". 11 p.
MARQUES, J.; SANTOS, J.M. dos; VILA NOVA, N.A. &
SALATI, E.
1977 - Precipitable water vapor f lux between Be· lém and Manaus. Acta Amazonica, 7 (3): 355·62.
MILLER, D. & FEDDES, R.G.
1971 - Global Atlas of relative cloud cover 1967-1970. Washington, Dept. Comm. NOAA, US Air Force (AWS). 237p.
758-NAMIAS, J.
1972 - lnfluence of Northern Hemisphere general clrculation on drought In Northetst Brazll. Tellus, 24: 336-342.
NEWELL, R.E.; KIDSON, J.W.; VINCENT, D.G. &
BOER, G.J.
1972 - The General circulation of the Tropical atmosphere . Massachusetts, lnst. ot Tech. 258p.
PARMENTER, F.C.
1976 - A Southern Hemisphere cold front passage at the equator. Buli. Amer. Meteor. Soe. 57: 1435-1440.
SNOW, J.W.
1976 - The climate of northern South America. Climates of Central and South America. v. 12, World Survey of Climatology. W. Sch· werdtfeger, Ed., Elsevier. p. 295-403 . SOBRAL, Z.R.
1979 - Um estudo climatológico dos campos de vento e de t emperatura nos niveis
superio-res sobre a América do Sul. M. Se. disser-tation. São José dos Campos, lnst. Pesq. Espaciais. 88p.
TREWARTHA, G.T.
1961 - The Eart's Problem Climates . University of Wisconsin Press. 334p.
(Aceito para publicação em 25/ 05/ 81)