Crop Breeding and Applied Biotechnology 12: 145-150, 2012 Brazilian Society of Plant Breeding. Printed in Brazil
Genetic control of resistance to gray leaf spot of maize in tropical germplasm
André Humberto de Brito1*, Livia Maria Chamma Davide2, Renzo Garcia Von Pinho1, Rafael Pelloso de Carvalho2 and Matheus Costa dos Reis1
Received 16 August 2010 Accepted 13 October 2011
Abstract - The main goal of this study was to assess the nature and magnitude of gene effects for resistance to Cercospora leaf spot. A randomized block design with three replications was used. The data were obtained at the plant level by assessing the disease severity. The data were analyzed per experiment, using the average data per plot. A dominant-additive genetic model without epistasis was considered, with estimation of the components of means and variance. The genetic control of resistance to gray leaf spot is polygenic with predominance of the additive effects. Dominance was observed in a few small-effect loci and high heritability values.
Key words: Cercospora zeae-maydis, genetic resistance, Zea mays.
1 Universidade Federal de Lavras (UFLA), Departamento de Fitotecnia, CP 3037, 37.200-000, Lavras, MG, Brazil. *Email: [email protected] 2 Universidade Federal da Grande Dourados (UFGD), Faculdade de Ciências Agrárias, CP 322, 79.825-070, Dourados, MS, Brazil
INTRODUCTION
Gray leaf spot, whose etiologic agent is the fungus Cerco-spora zeae-maydis is currently one of the main leaf diseases of maize in Brazil, both in terms of losses it has caused to susceptible hybrids as well as its broad distribution in all maize-producing regions of the country (Brito et al. 2008). As of 2000, this endemic disease, appearing in the form of small and sparse spots on leaves, began to assume epidemic propor-tions in various regions of the country (Juliatti et al. 2004).
In Brazil, maize breeders agree that one of the main causes of inconstancy in the use of commercial hybrids is the high severity of diseases such as gray leaf spot (GLS), with the appearance of variations in the pathogen population, brought about mainly by the planting of susceptible hybrids and by changes in the production system. These facts evidence the need of breeding hybrids with genetic resistance to GLS (Vieira et al. 2009). Fortunately, the effectiveness of this strategy has already been demonstrated in the U.S. and in Africa, where GLS-losses had been reported prior to those in Brazil (Menkir and Ayodele 2005, Derera et al. 2008).
Research addressing the type of gene action involved in resistance to gray leaf spot indicated the predominance of additive gene action (Menkir and Ayodele 2005, Derera et al. 2008). Nevertheless, some of these reports described
significance of the non-additive effects and suggested that
to fully explain the inheritance mode of GLS resistance, the models would have to include the dominance effects.
Research based on the mapping of quantitative trait loci (QTLs) for resistance largely corroborated these results. Additive genetic effects were reported with consistent quantitative trait loci (QTLs) mapped on chromosome 2 by Bubeck et al. (1993); on chromosome 1 by Saghai Maroof et al. (1996) and on chromosome 4 by Gordon et al. (2004). Dominant gene action was observed by Shagai Maroof et al. (1996) for the QTL mapped on chromosome 4, by the
influence of the susceptible parent plant B73. This QTL is
the same as mapped by Gordon et al. (2004), occupying exactly the same position on chromosome bin 4.08, with dominant gene action. However, in this case, dominance was derived from the parent plant VO613Y.
In a study by Pozar et al. (2009), QTLs related to resistance to C. zeae-maydis in Brazil were mapped and characterized by means of microsatellite markers (SSR - Simple sequence repeats) and single nucleotide markers (SNP - Single nucleo-tide polymorphism). According to the same author, the QTL combination has an impact on the effectiveness of selection procedures monitored by markers in breeding programs for the development of commercial hybrids.
Although QTL mapping allows a more rapid develop-ment GLS-resistant hybrids by molecular marker-assisted selection, the chance for the emergence of variations in the pathogen population is great, resulting in QTL x environment
interaction, reinforcing the importance of field selection.
The course of any breeding program is facilitated if in-formation on the genetic control of the target trait is available (Lüders et al. 2008), which allows breeders to choose the most adequate working strategy. Nevertheless, it is important to highlight that the studies reported in the literature used germplasm adapted to the distinct edaphoclimatic conditions of Brazil. Although these studies have generated valuable information, they are generally only applicable to the source
of specific germplasm and for the range of environments
tested (Falconer and Mackay 1996). In addition, there is little information resulting from the study of inheritance of GLS-resistance in maize in Brazil using divergent breeding lines and their hybrid generations. The purpose of this study was to analyze the nature and magnitude of the genetic effects of resistance to gray leaf spot (GLS) based on assessments of lines with divergence for GLS- resistance and hybrid generations.
MATERIAL AND METHODS
The lines GNS31, GNS30 and GNS84 from the genetic breeding program of the company Geneseeds - Recursos Genéticos Ltda. were assessed and the generations F1, F2, BC11 and BC21, derived from the crosses GNS30 x GNS31 and GNS84 x GNS31. The lines GNS30 and GNS31 were obtained from the same population resulting from lines derived from the germplasm Cateto and Caribean. Both
have flint kernels, short plant height and a semi-late cycle.
GNS31 is susceptible and GNS30 resistant to GLS. Line GNS84 was obtained from selfed varieties of Tuxpeno germplasm; it has medium dent kernels, medium plant height, an early cycle and GLS-resistance. Seeds of the parent lines and the F1 F2, BC11 and BC21 generationswere
obtained in the 2007/2008 growing season, by selfing and crosses performed in the field.
The experiments were initiated on two sowing dates about one month apart (11/19/2008 and 12/15/2008), in an experimental area of the Universidade Federal de Lavras (lat 21o 14’ S, long 45o 00’ W and alt 918 m asl), MG, Brazil.
According to Köppen’s classification, the local climate is
Cwa (subtropical, with rainy summers and dry winters). The
soil of the experimental area was classified as Dystrophic
Red Latossol, with clayey texture and 9 % slope.
Two experiments were conducted for each sowing date and cross, in a randomized block design with three replica-tions. Each replication consisted of 11 plots, one per parent
line and F1 generation, two per BC11, two per BC21 and four per F2 generation. In this way, it was possible to use plots of always the same size, namely four 5-m rows, spaced 0.8 m apart. Thus, the representativity of the segregating populations was increased, to around 80 plants per plot.
For both experiments on both sowing dates, 400 kg ha-1 of N-P2O5-K2O fertilizer (as 8-28-16+0.5% zinc) was applied at sowing. When the plants had 4-5 leaves, 300 kg ha-1 urea (as 30–00–20) was applied as top dressing. A second application of N- fertilizer (100 kg ha-1 urea) was top-dressed when the plants had 8-9 leaves. Crop treatments and pest control were duly applied according to the crop requirements.
The onset of the disease occurred by natural infection. To assess disease severity, 20 plants from each plot were labeled
for data collection at the time of flowering and evaluated 95
days after plant emergence. For this purpose, the disease-affected leaf area was visually assessed, based on a graded scale of 1 - 9, proposed by Pinho et al (2001), where: 1 = 0
% (highly resistant); 2 = 1 % (resistant); 3 = > 1 % and ≤ 10 % (resistant); 4 = > 10 % and ≤ 20 % (moderately resistant); 5 = > 20 % and ≤ 30 % (moderately susceptible); 6 = > 30 % and ≤ 40 % (moderately susceptible); 7 = > 40 % and ≤ 60 % (susceptible); 8 = > 60 % and ≤ 80 % (susceptible);
9 = > 80 % (highly susceptible).
The experimental data for both sowing dates were analyzed in parallel, for the two crosses. For this purpose, the phenotypic variance was estimated within the plots and the mean values per plot subjected to analysis of variance, according to the following statistical model, considering
all effects as fixed, except for the effect of experimental
error: Yij = m + ti + bi + eij, in which: Yij value observed from generation i in block j; m general mean; tieffect of generation i (i=1, ..., 6); bj: effect of block j (j=1, 2 and 3); eij: effect of experimental error.
Estimates of the genetic mean components were ob-tained using the weighted least square method (Kearsey and Pooni 1996). An additive-dominance model without epistasis was considered, with estimation of the following parameters: m: mean of the homozygotic genotypes; a: sum of the effects of the homozygotic genotypes in relation to the midpoint (additive effects) and d: sum of the effects of the heterozygotic genotypes in relation to the midpoint (dominance effects). The average dominance degree (d/a) was calculated from these estimates.
The genetic variance components were estimated con-sidering that the origin of the phenotypic variance of the parent lines and the F1 generation is only environmental (s2
E), that is, s 2
P1, s 2
P2, s 2
F1 = s 2
contains, in addition to the environmental variance, additive genetic variance (s2
A) and dominance genetic variance (s 2
D), that is, s2
F2=s 2
A+s 2
D+s 2
E and the sum of the phenotypic variances of the two backcrosses contains: s2
BC11+s 2
BC21= 1s2
A+2s 2
D+1s 2
E. The phenotypic variance components,
s2 A,s
2 D and s
2
E, were estimated using the procedure proposed by Mather and Jinks (1984).
All analyses were performed using software SAS (SAS Institute Inc 1993), Proc GLM for analyses of variances between generations and the Proc IML to estimate the mean
and variance genetic components. The model fitting was verified based on estimates of the determination coefficients,
involving the observed and expected values. The narrow-sense heritability (h2
r) and number of genes (K) involved in the trait control were estimated by the ex-pressions proposed by Ramalho et al (1993).
RESULTS AND DISCUSSION
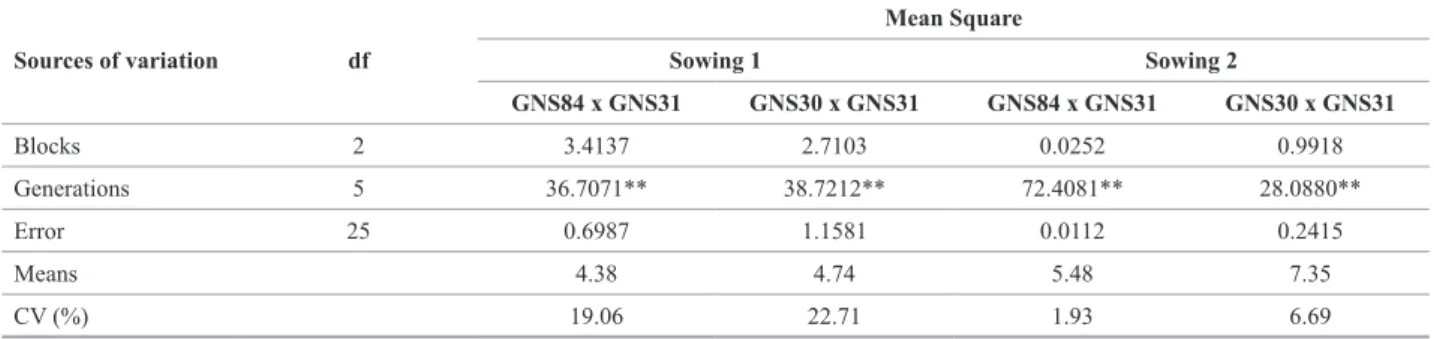
From the results of analyses of variance (Table 1),
significant differences (p < 0.01) were observed between the different generations, i.e., between the parent lines, F1 hybrids and segregating generations (F2, BC11 and BC21) for the two crosses. The variation between the parent lines and the other generations involved (Table 2) was high. The existence of variation is an essential condition for the study of genetic control of the trait.
With the exception of the means of the parents and of the F1 and BC21 generations of the cross GNS31 x GNS84, the means of the generations of the two crosses increased
significantly in the second sowing (Table 2). This is prob -ably due to the fact that the inoculum concentration in the experiments of the second sowing was higher. In addition, the environmental conditions of the second sowing were more favorable for the establishment of the pathogen.
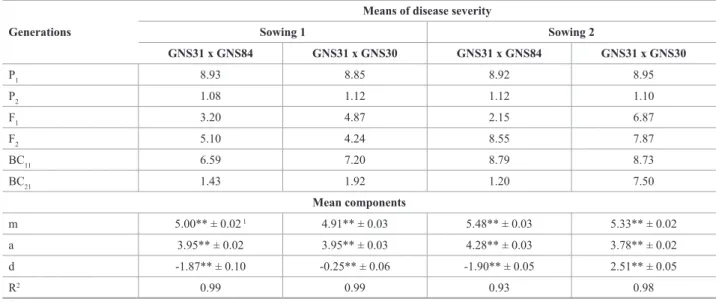
Regardless of the sowing date, high disease severity was observed for the susceptible line GNS31, common to both crosses, with scores ranging from 8.85 to 8.95. For cross GNS30 (P1) x GNS31 (P2), the mean disease severity of the GLS-resistant line GNS30 was 1.1, while the performance of the F1 hybrid was intermediate to the parent lines, in both sowings. In the cross GNS84 (P1) x GNS31 (P2), line GNS84 had a disease severity of 1.1 and the F1 hybrid a performance similar to that of the resistant parent, with score
3.20 and 2.15 for the first and second sowing, respectively.
Differences of this magnitude were also reported elsewhere (Coates and White 1998, Menkir and Ayodele 2005). The prerequisite of divergent parents, one of the basic conditions for the study of genetic control, was also met.
In principle, these results suggest that the additive effects are predominant in the control of resistance to C. zeae-maydis, since in the segregating generations there are non-effective alleles. The means of the F1 and F2 generations, near the midpoint of the parent lines, also indicate predominance of the additive effects in the trait control.
The study of mean components showed that the additive-dominance model was adequate to explain the variation
observed. For both crosses of the first sowing, the correla -tions between the estimated and the expected means were
close to unity, as well as the coefficient of determination
of the model (R²). The estimates of the mean components (Table 2) showed that the additive (a) and dominance (d)
effects were significantly different from zero (p ≤ 0.01) for
the two crosses for both sowings. The negative estimates of d indicate dominance in the direction of reducing the disease severity, which is a favorable condition for breed-ing programs for resistant hybrids, with the exception of the positive value obtained for cross GNS31 x GNS30 in the second sowing, due to the increase in disease severity observed in the segregating generations.
Table 1. Summary of analysis of variance for disease severity (scores) of Cercospora zeae-maydis obtained in experiments for assessment of parent lines and F1, F2, BC11 and BC21 generations of two crosses and two sowings dates (1: 11/19/2008 and 2: 12/15/2008)
Sources of variation df
Mean Square
Sowing 1 Sowing 2
GNS84 x GNS31 GNS30 x GNS31 GNS84 x GNS31 GNS30 x GNS31
Blocks 2 3.4137 2.7103 0.0252 0.9918
Generations 5 36.7071** 38.7212** 72.4081** 28.0880**
Error 25 0.6987 1.1581 0.0112 0.2415
Means 4.38 4.74 5.48 7.35
CV (%) 19.06 22.71 1.93 6.69
The average dominance degree (d/a) obtained from these estimates was 0.06 and 0.66 for GNS31 x GNS30,
and 0.47 and 0.44 for GNS31 x GNS84, for the first and
second sowing respectively, suggesting partial dominance. The results recorded here are in agreement with most reports in the literature regarding predominance of additive effects
and significant dominance effects (Thompson et al. 1987,
Elwinger et al. 1990, Ulrich et al. 1990, Donahue et al. 1991, Gevers et al. 1994, Coates and White 1998, Verma 2001, Menkir and Ayodele 2005, Derera et al. 2008).
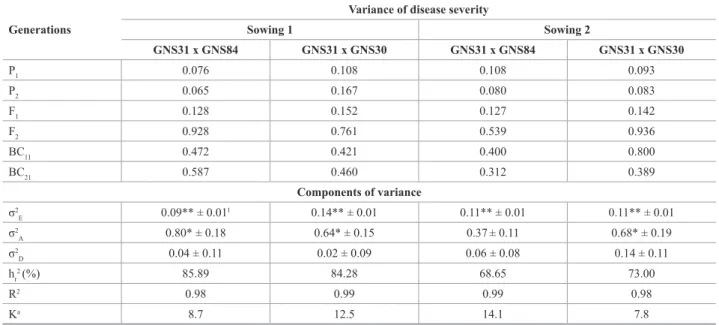
Phenotypic and genetic variance components (Table 3) showed that the additive-dominance model explained
nearly all variation, which can be verified by the R² esti-mates. Corroborating the study of mean components, the variance components showed greater importance of the additive effects in the inheritance of GLS-resistance. The estimates of additive variance (sˆ2A) were, for the most part,
significantly different from zero. Additive variance may be defined as a linear relationship between the genotypic values
of the plants of a population and the number of favorable alleles they have (Cruz et al. 2004). Thus, the prevalence of additive effects in the genetic control of GLS-resistance indicates that superior genotypes, with greater concentration of favorable alleles and therefore a condition favorable to
genetic breeding, can easily be identified.
The predominance of additive gene effects in GLS-resistance in maize was also observed in the studies of Bubeck et al. (1993), Saghai Maroof et al. (1996), Clements et al. (2000), Gordon et al. (2004) and Juliatti et al. (2009).
However, the dominance variance proved to be very small
for the two crosses, for both sowings, with non-significant val -ues, contrary to the results obtained by the mean components on the importance of the dominance effects on the resistance control for these crosses. Nevertheless, it must be highlighted that in the estimates of genetic components of variance, using the least square method, dominance variance corresponds to the deviations of the linear regression equation used in obtaining additive variance (Bernardo 2002). Therefore, the estimates of dominance variance may be underestimated since this method tends to minimize the deviations in
rela-tion to the regression line. Significant dominant effects were
also described by Elwinger et al (1990), Gevers et al. (1994), Coates and White (1998), Verma (2001) and Menkir and Ayo-dele (2005), indicating that the genetic trait control may vary between different resistance sources. This must be considered in breeding programs, where the resistance sources should be characterized to ensure an effective selection process.
Heritability estimates for the first sowing were greater
and show that the environmental effect was more pronounced for the second sowing (Table 3). This fact may explain the unexpected result of the generation means in the second sowing and mainly shows that studies involving horizontal genetic resistance to pathogens may be affected by late sowing, in which the pathogen pressure may be greater.
Additive genetic variation was high, indicating a great possibility of success with selection. Heritability estimates with a higher genetic than environmental variation have been reported elsewhere (Coates and White 1998).
Table 2. Means of disease severity (scores) of Cercospora zeae-maydis of generations assessed and estimates of mean components for mean severity of gray leaf spot obtained in two crosses and in two sowings dates (1: 11/19/2008; 2: 12/15/2008)
Generations
Means of disease severity
Sowing 1 Sowing 2
GNS31 x GNS84 GNS31 x GNS30 GNS31 x GNS84 GNS31 x GNS30
P1 8.93 8.85 8.92 8.95
P2 1.08 1.12 1.12 1.10
F1 3.20 4.87 2.15 6.87
F2 5.10 4.24 8.55 7.87
BC11 6.59 7.20 8.79 8.73
BC21 1.43 1.92 1.20 7.50
Mean components
m 5.00** ± 0.02 1 4.91** ± 0.03 5.48** ± 0.03 5.33** ± 0.02
a 3.95** ± 0.02 3.95** ± 0.03 4.28** ± 0.03 3.78** ± 0.02
d -1.87** ± 0.10 -0.25** ± 0.06 -1.90** ± 0.05 2.51** ± 0.05
R2 0.99 0.99 0.93 0.98
1 Standard error of the estimate
With the identification of predominance of the additive
effects and high heritability estimates, it becomes clear that the chances of obtaining GLS-resistant lines by selection are great. According to Kearsey and Pooni (1996), the results found related to dominance (d – small and significant; sˆD2
- insignificant) indicate a low dominance level in resistance
inheritance. In other words, there are few small-effect loci with dominance on the trait control. This shows that the most recommended breeding strategy would be to obtain hybrids from resistant lines, taking advantage of the additive effects of the large-effect loci of the parents and the dominance that will be expressed in divergent loci of smaller effect.
In relation to the number of genes involved in the re-sistance control of this pathogen, considering the absence of dominance, the presence of 11.4 genes, on average, was observed when the cross GNS84 x GNS31 was considered
and 10.2 genes, on average, for the cross GNS30 x GNS31, considering both sowing dates. These results show that the genetic control is polygenic. Studies performed by Bubeck et al. (1993) showed that various quantitative trait loci (QTLs) with additive gene action are associated with resistance, indicating that it is horizontal or polygenic.
The high heritability and the great importance of the additive gene effect in the trait control are favorable for breeding for characteristics controlled by several genes.
ACKNOWLEDGEMENTS
The authors express their gratitude to the Coordena-doria de Aperfeiçoamento de Pessoal de Nível Superior (CAPES) and Fundação de Amparo à Pesquisa do Estado de Minas Gerais (FAPEMIG) for funding this study and a research grant.
Table 3. Variance of generations assessed and estimates of the components of genetic and environmental variance for mean severity (scores) of
Cercos-pora zeae-maydis, obtained in two crosses and at two sowing dates (1: 11/19/2008; 2: 12/15/2008)
Generations
Variance of disease severity
Sowing 1 Sowing 2
GNS31 x GNS84 GNS31 x GNS30 GNS31 x GNS84 GNS31 x GNS30
P1 0.076 0.108 0.108 0.093
P2 0.065 0.167 0.080 0.083
F1 0.128 0.152 0.127 0.142
F2 0.928 0.761 0.539 0.936
BC11 0.472 0.421 0.400 0.800
BC21 0.587 0.460 0.312 0.389
Components of variance
σ2
E 0.09** ± 0.01
1 0.14** ± 0.01 0.11** ± 0.01 0.11** ± 0.01
σ2
A 0.80* ± 0.18 0.64* ± 0.15 0.37± 0.11 0.68* ± 0.19
σ2
D 0.04 ± 0.11 0.02 ± 0.09 0.06 ± 0.08 0.14 ± 0.11 hr
2 (%) 85.89 84.28 68.65 73.00
R2 0.98 0.99 0.99 0.98
Ka 8.7 12.5 14.1 7.8
1 Standard error of the estimate
a Number of genes with absence of dominance
Controle genético da resistência à cercosporiose
do milho em germoplasma
tropical
Resumo - O objetivo deste trabalho foi estudar a natureza e a magnitude dos efeitos gênicos da resistência à Cercosporiose. Foi utilizado o delineamento experimental de blocos ao acaso, com três repetições. A avaliação da resistência foi realizada utilizando escala diagramática com notas. Os dados obtidos foram analisados por experimento, utilizando-se médias de parcela. Foi conside-rado um modelo aditivo-dominante sem epistasia, com a estimação dos componentes de média e de variância. O controle genético da resistência à Cercosporiose é poligênico, com predominância dos efeitos aditivos, com dominância em poucos locos de pequeno efeito e alta herdabilidade, condição essa favorável à seleção.
REFERENCES
Bernardo R (2002) Breeding for quantitative traits in plants. Stemma, Woodbury, 369p.
Brito AH, Pinho RGV, Souza Filho AX and Altoé TF (2008) Avaliação da severidade da Cercosporiose e rendimento de grãos em híbridos comerciais de milho. Revista Brasileira de Milho e Sorgo7: 19-31.
Bubeck DM, Goodman, MM, Beavis, WD and Grant D (1993) Quantitative trait loci controlling resistance to gray leaf spot in maize. Crop Science 33: 838-847.
Clements MJ, Dudley JW and White DG (2000) Quantitative trait loci associated with resistance to gray leaf spot of corn. Phytopathology 90: 1018-1025.
Coates ST and White DG (1998) Inheritance of resistance to gray leaf spot in crosses involving selected resistant inbred lines of corn. Phytopathology88:972-982.
Cruz CD, Regazzi AJ and Carneiro PCS (2004) Modelos biométricos aplicados ao melhoramento genético. UFV, Viçosa, 480p.
Derera J, Tongoona P, Kevin VP, Vivek B, Laing MD and Rij NCV (2008) Gene action controlling gray leaf spot resistance in Southern African Maize Germplasm. Crop Science48: 93-98.
Donahue PJ, Stromberg EL and Myers SL (1991) Inheritance of reaction to gray leaf spot in a diallel of 14 maize inbreds. Crop Science 31: 926-931.
Elwinger GF, Johnson MM, Hill RR and Ayers JE (1990) Inheritance of resistance to gray leaf spot of corn. Crop Science 30: 350-358.
Falconer DS and Mackay TFC (1996) Introduction to quantitative genetics. Longman, Essex, 464p.
Gevers HO, Lake JK and Hohls T (1994) Diallel cross analysis of resistance to gray leaf spot in maize. Plant Disease 78:379-383.
Gordon GS, Bartsch M, Matties I, Gevers HO, Lipps PE and Pratt RC (2004) Linkage of molecular markers to Cercospora zea-maydis resistance in maize. Crop Science44: 628-636.
Juliatti FC, Appelt CCNS, Brito CH, Gomes LS, Brandão AM, Hamawaki OT and Melo B (2004) Controle da feosféria, ferrugem comum e cercosporiose pelo uso da resistência genética, fungicidas e épocas de aplicação na cultura do milho. Bioscience Journal 20: 45-54.
Juliatti FC, Pedrosa MG, Silva HD and Silva JVC (2009) Genetic mapping for resistance to gray leaf spot in maize. Euphytica169: 227-238.
Kearsey MJ and Pooni HS (1996) The genetical analysis of quantitative traits. Chapman and Hall, London, 381p.
Lüders RR, Galbieri R, Fuzatto MG and Cia E (2008) Inheritance of resistance to Verticillium wilt in cotton. Crop Breeding and Applied Biotechnology 8: 265-270.
Mather K and Jinks JL (1984) Introdução à genética biométrica. Ribeirão Preto: SBG, 242p.
Menkir A and Ayodele M (2005) Genetic analysis of resistance to gray leaf spot of midaltitude maize inbred lines. Crop Science45: 163-170.
Pinho RGV, Ramalho MAP, Resende IC, Silva HP and Pozar G (2001) Reação de híbridos comerciais de milho às ferrugens polissora e tropical. Pesquisa Agropecuária Brasileira36: 439-445.
Pozar G, Butruille D, Diniz HS and Viglioni JP (2009) Mapping and validation of quantitative trait loci for resistance to cercospora infection in tropical maize (Zea mays L.). Theoretical and Applied Genetics 118: 553-564.
Ramalho MAP, Santos JB and Zimmermann MJO (1993) Genética quantitativa em plantas autógamas: aplicações ao melhoramento do feijoeiro.UFG, Goiânia, 271p.
Saghai Maroof MA, Yue YG, Xiang ZX, Stromberg EL and Rufener GK
(1996) Identification of quantitative trait loci controlling resistance to
gray leaf spot disease in maize. Theoretical and Applied Genetics 93: 539-546.
SAS Institute Inc (1993) SAS System. SAS, Cary, 18 v.
Thompson DL, Bergquist RR, Payne GA, Bowman DT and Goodman MM (1987) Inheritance of resistance to gray leaf spot in maize. Crop Science 27: 243-246.
Ulrich JF, Hawk JA and Caroll RB (1990) Diallel analysis of maize inbreds for resistance to gray leaf spot. Crop Science 30: 1198-1200.
Verma BN (2001) Gray leaf spot disease of maize: loss assessment, genetic studies and breeding for resistance in Zambia. In Proceedings of eastern and southern Africa regional maize conference and symposium on low-nitrogen and drought tolerance in maize. CIMMYT, Nairobi, p. 60-65.