Printed version ISSN 0001-3765 / Online version ISSN 1678-2690 http://dx.doi.org/10.1590/0001-3765201620150698
www.scielo.br/aabc
Diversity of anurans in dry forest fragments of a subtropical region in Brazil
EDuarDo J. Dos santos1
and Carlos E. ContE1,2
1
Instituto Neotropical: Pesquisa e Conservação/INPCON, Rua Purus, 33, Bacacheri, 82520-750 Curitiba, PR, Brasil 2
Departamento de Zoologia, Universidade Federal do Paraná/UFPR. Av Cel Francisco H dos Santos, 210, Jardim das Américas, 81531-970 Curitiba, PR, Brasil
Manuscript received on October 6, 2015; accepted for publication on March 1, 2016
aBstraCt
This study aimed to identify and compare the diversity between two areas within different matrices located in the Mesophytic Semideciduous Forest; to compare composition and diversity registered to other assemblages; and to evaluate which criteria used here were the most important when sampling them. Data was obtained from September 2011 to March 2012 from 10 sites with different habitats in two areas of mid northern state of Paraná, southern Brazil. We recorded 18 species. Alfa-diversity between the areas did not vary, but the population within one of them was more stable, suggesting better distribution and equity of species in the available habitat. Beta-diversity in the region was high; a result attributed to the species Dendropsophus nanus. Comparing the sampled areas to others in the Semideciduous Forest, the quantity of sampled breeding sites was the most important variable for higher records of richness. Geographical distance was a determinant factor for the distinction between localities. Different factors were determinant for the variation in richness and composition of species in the area. Hence, the conservation of fragments and their associated habitat need to be prioritized.
Key words: Atlantic Forest, Semideciduous Forest, inventory, richness, abundance, comparison.
Correspondence to: Eduardo José dos Santos E-mail: ejs.1988@yahoo.com.br
IntroDuCtIon
The loss of global diversity is currently one of the biggest international concerns, and studies indicating population declines and species extinction have been frequent in the last few decades (Lawton and May 1995, Houlahan et al. 2000, Myers et al. 2000, Thomas et al. 2004a, b, IUCN 2015). Amphibians are amongst the groups with most worrying status, having 30 to 40% of their known species estimated to be threatened of extinction (IUCN 2015).
Among the several factors which might lead to population declines of amphibians (see review in Young et al. 2004, Blaustein and Kiesecker
2002), fragmentation and loss of habitat have been considered the ones of greater impact (Alford and Richards 1999, Cushman 2006). Fragmentation
is defined as a process in which a continuous environment is progressively divided into smaller and isolated portions, ultimately resulting in total
habitat loss (Didham 2010). Fragmentation is frequently caused by anthropic activities, and such process implies in changes on the composition
disrupting the climatic and vegetal condition in the habitat of several populations of amphibians. This consequently induces a reduction of such populations and their diversity, causing local extinctions (Fahrig 2003, Gagné and Fahrig 2007).
Anurans are particularly sensitive to the effects
of fragmentation (Fahrig 2003, Bell and Donnelly 2006, Cushman 2006, Becker et al. 2007, Gagné and Fahrig 2007) due to their physiology and behavior (Duellman and Trueb 1986, Wells 2007). Diversity, distribution and dynamics within an assemblage
may be modified in different intensities because of
the climate (John-Alder et al. 1988, Duarte et al. 2012) and the vegetal composition (Keller et al. 2009, Silva et al.2012).
A biome extremely degraded by the process of fragmentation is the Atlantic Forest (AF), which
was identified as hotspot for conservation due to its status of extremely threatened and to the high rates of diversity and endemism (Myers et al. 2000). The Mesophytic Semideciduous Forest (MSF) is an ecosystem within the AF. MSF occurs from Serra da Mantiqueira, a range of mountains in the states of São Paulo, Minas Gerais and Rio de Janeiro, to the state of Rio Grande do Sul, Brazil, and to the Northeast of Argentina, usually below 800 m of altitude (Veloso et al.1991). Is it severely degraded because of the advances of agricultural activities throughout the last decades (Roderjan et al. 2002, Mikich and Oliveira 2003). In spite of presenting lower potential diversity when compared to other AF ecosystems, due to the characteristics of the climate and of the vegetation where it occurs (Veloso et al. 1991, Roderjan et al. 2002), the MSF holds a high richness of anurans, with 111
registered species, five of which are considered to
be endemic (Garcia et al. 2007).
When the quantity and extension of remnants in the Atlantic Forest are compared to the quantity of studies carried out in this biome, one can easily notice the urgent need to improve the knowledge in several areas and sites (Eterovick et al. 2005,
Silva et al. 2006, Conte and Machado 2005, Conte and Rossa-Feres 2007, Knispel and Barros 2009, Rossa-Feres et al. 2011). That is the case of the MSF, which still needs more attention (Bernarde and Anjos 1999, Machado et al. 1999, Bernarde and Machado 2001, Machado and Bernarde 2003, Rossa-Feres et al. 2011). In this sense, it is imperative that the knowledge about diversity, dynamics and structure of assemblages occurring in fragments is improved, so that it is possible to accurately identify population declines and predict
negative effects of anthropic activities (Eterovick
et al. 2005).
Our objectives were (1) to determine and compare the alpha and beta diversity of the
anurofauna occurring in two areas with different
matrices in the MSF; (2) to test the variation in
diversity between different habitat and fragments
within each sampled area; (3) to compare the composition and richness to other assemblages in fragments sampled within MSF and (4) to verify the most important criteria of sampling when recording the richness in these assemblages.
MatErIals anD MEtHoDs
STUDY SITE
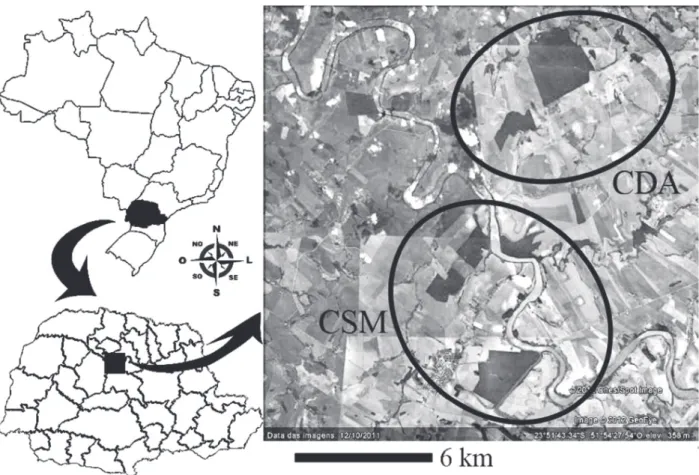
We collected data in two areas in the outskirts of the cities of São Pedro do Ivaí and Fênix, mid northern region of the state of Paraná, Brazil (Figure 1). In each area, we sampled two fragments and the
habitat next to them. The first area (CDA) has its
51º58’W; ~300 ha). All fragments are between
five and 12 km distant from each other, and they
are spatially isolated by roads, rivers, pastures and plantations (Mikich and Oliveira 2003).
The areas are located in the MSF, whose main characteristic is the distinction of two periods of the year with contrasting climates, one being wetter with high temperatures and the other being drier with cooler temperatures. During drier periods, 20– 50% of trees lose their leaves, uncovering the forest canopy and forming several clearings (Veloso et al. 1991, Roderjan et al. 2002). The climate type is humid subtropical (Cfa of Köeppen’s classification), with mean annual temperatures ranging from 16 to 29ºC (Mikich and Oliveira 2003). Annual precipitation varies between 1.400 and 1.500 mm,
with a concentration of rains between November and March, and a drier period between June and August (Mikich and Oliveira 2003). The region is at an altitude of 350 m.
SAMPLING
We collected the data during 12 field expeditions,
between September 2011 and March 2012. Every 15 days, in average, three-day samples were carried out. There was an effort of seven hours a day, totaling 252 hours in 36 days of sampling.
Five habitat were sampled in each area, equally distributed as: two temporary ponds, one permanent pond and two transects, being one in the forest interior and one alongside a river at the edge of the forest (Table I).
For each fragment we used the following sampling methods: (1) sampling at breeding sites (Scott and Woodward 1994), in which the perimeter of each pond/lake and transects of 100 meters in streams/river were searched, and all individuals visualized or heard emitting reproductive calls were identified and quantified; (2) acoustic search in transects (Conte and Rossa-Feres 2007), performed in transects of 100 meters delimited in the interior of the forest, which were slowly searched, being
identified and quantified all individuals emitting
reproductive calls far from wetlands, within a maximum limit of two meters for each side of the transect.
We sampled between 6 pm and 2 am, period of intense activity for most species (Duellman and Trueb 1986). We considered the total abundance for each species as the sum of all samplings together. In order to avoid mistakes caused by the variation of the calling period of anuran species, the sequence of habitat sampling in each phase was different (Conte and Rossa-Feres 2007). The nomenclature for the species registered in this paper followed Frost (2015). We identified species, both in adult
and tadpole stages, through taxonomic revision using available literature and museum data.
When possible, we collected one male and one female individual as voucher specimens. They were anesthetized with Benzocaine 5%, killed in weak alcohol (10%) and then stored in containers with alcohol 70%. Animal handling and collecting procedures were authorized and licensed by Ministério do Meio Ambiente (MMA), Instituto Chico Mendes de Conservação da Biodiversidade (ICMBio) and Sistema de Autorização e Informação em Biodiversidade (SISBIO) - License number 28999-1. Specimens collected were deposited at
the Scientific Collection of the Zoology and Botany
Department of UNESP (DZSJRP), campus of São José do Rio Preto, state of São Paulo, Brazil.
STATISTICAL ANALYZES
Diversity
We compared the alpha-diversity (Magurran 2004) between areas through the construction of rarefaction curves and the use of Mau-Tau’s index
and its confidence intervals of 95% (Coddington et
taBlE I
Characterization of the habitats sampled in the areas CDa and CsM, located in the mid northern region of the state of Paraná, between september 2011 and March 2012. regarding the acronyms, the
first letter indicates the type of habitat sampled (T = transect; P = pond; L = lake and S = stream); the second indicated the physiognomy in which the habitat in inserted (I = interior of the forest; E = edge of the forest; O = open area). Type of vegetation: He = herbaceous; Bu = bushes; Ab = arboreous; Pt = pteridophytes; Aq = aquatic. (*) = Not applicable. Values of size (S) shown in square meters and of
average depth (D) in meters.
Locality Habitat Type of vegetation % internal
Vegetation cover in the habitat
S D
% marginal
CDA
rBa
TI1 He, Bu, Ab, Pt * 100 100 0
RI1 He, Bu, Ab, Pt 0 100 100 0
PB1 He, Bu, Ab, Pt 5 25 2576 2.2
LI1 He, Bu, Ab, Pt, Aq 30 97 1650 3
FSV PB2 He, Bu, Ab, Pt, Aq 80 90 270 2.5
CSM
VES RI2 He, Bu, Ab, Pt 10 100 100 0
LI2 He, Bu, Ab, Pt, Aq 20 100 792 3
FCa
TI2 He, Bu, Ab, Pt * 100 100 0
PA3 He, Bu 85 100 1406 0.5
al. 1996). To visualize the distribution of abundance of occurring species, and its consequent contribution to the alpha-diversity in each area, we built Whittaker graphs (Whittaker 1965, Krebs 1999), with the abundance values of species transformed in their log, and positioned in descending order (Magurran 2004). These values were compared to models of theoretical curves to determine the best adjustment of each curve generated and the best biological explanation for the pattern of diversity found in the sampled areas (Magurran 2004).
In order to estimate beta-diversity (Magurran 2004) in the region, we compared the areas sampled by the abundance of species occurring in all sampled habitat, according to their value of dissimilarity in the SIMPER analysis (Similarity of Percentages; Clarke 1993). Beta-diversity of a region is low when values of dissimilarity between areas are low (Clarke 1993, Roberts et al.2006). We considered the values of dissimilarity high when
it surpassed 70%. We listed only the species with higher relative contribution to dissimilarity, until the total value of 90% of contribution was reached. We performed analyses through program EstimateS v 8.0 (Colwell 2013), using 1000 randomizations, and PAST v. 1.96 (Hammer et al. 2001).
Comparison with other assemblages
We compared the composition of the assemblage to 11 other localities within MSF whose anurofauna had been studied (Table II). In order to represent the differences graphically, we performed an analysis of non-metric multidimensional scaling (nMDS). Such analysis uses data from a similarity matrix to generate a graph in which the distance or the similarity between each group is shown in two axis (Clarke and Warwick 1994). For that, we used a matrix of presence-absence, with inventories of each locality divided into two categories: (1) those geographically inserted above and (2) those
taBlE II
list and description of localities with inventoried anurofauna inserted in the Mesophytic semideciduous Forest
considered in this research. RPPN: Reserva Particular do Patrimônio Natural; PARES: Parque Estadual; ESEC: Estação Ecológica; FLES: Floresta Estadual. Sampling effort presented as: months (m); days (d) and hours (h).
locality or town state richness Effort Coordinates reference
RPPN Reserve Barbacena and
surroundings/São Pedro do Ivaí PR 14 7m; 36d/252h 23º48’18”S, 51º55’55”W Present study Vila Rica do Espírito Santo and
surroundings/Fênix PR 15 7m; 36d/252h 23º52’42”S, 51º58’16”W Present study PARES Rio Guarani/Três Barras
do Paraná PR 23 12m; 24d 25º27’S, 53º07’W
Bernarde and Machado 2001/2000 PARES Mata dos Godoy/Londrina PR 24 12m; 45d 23º27’S, 51º15’W Bernarde and Anjos 1999
Guararapes SP 26 28m; 75d 21º15’S, 50º38’W Bernarde and Kokubum 1999
PARES Morro do Diabo/Pontal
do Paranapanema SP 21 13m 22º33’S, 52º18’W Vasconcelos et al. 2009
Icém SP 12 12m 20º34’S, 49º19’W Silva and Rossa-Feres 2007
Santa Fé do Sul SP 20 12m; 18d 20º11’S, 50º53’W Santos et al.2007
Nova Itapirema SP 27 15m 21º04’S, 49º32’W Vasconcelos and Rossa-Feres
2005 ESEC dos Caetetus/Gália and
Alvinlândia SP 34 35m; 63d/314h 22º24’11”S, 49º42’05”W Brassaloti et al.2010
Mata São José/Rio Claro SP 24 12m 22º22’S, 47º28’W Zina et al.2007
FLES ‘Edmundo Navarro de
below Paraná River, which is the biggest river in the South of Brazil and might act as a geographical barrier for the assemblages located in the MSF. Later, we plotted the data according to Jaccard’s index of similarity. This analysis was performed on the program PAST v. 1.96 (Hammer et al.2001).
In order to verify whether geographical distance is a determinant factor for the composition and distribution of assemblages, we performed a Mantel test of correlation (Manly 2008). This test
determines the significance of correlation between
matrices of similarity or of distance based on multidimensional data and the posterior calculus using Monte Carlo permutations (Manly 2008). This analysis was performed through the program R (R Core Team 2012).
After determining the difference in composi -tion between the sampled assemblages, we evalu-ated them regarding their dependence on the
re-corded richness based on different variables. Thus,
we determined the size of each sampled area, the quantity and the number of types of sampled habi-tat. Then, we performed an analysis of correlation matrix (Zar 1999) through the program PAST. We delimited a polygon ranging the outermost sam-pling sites from each locality using Google Earth tool, and we determined the total area of each lo-cality sampled using the program GE-Path v. 1.4.6 (Sgrillo 2012). Through the evaluation of published data, we obtained the number of habitat and the number of types of habitat sampled in each local-ity. We characterized and considered seven types of habitat in the analysis as follows (Appendix I): (1) marsh: lentic water body, with a shallow layer of water accumulated on a muddy bottom; (2) pond: water body with constant change, fed by rivers and streams and dammed on a muddy/rocky bottom; (3) temporary pond: lentic water body, with water accumulated exclusively by rains; (4) river: lotic water body, wider than 1.5 meters; (5) stream: lotic water body, narrower than 1.5 meters; (6) headwa-ters: shallow water body with constant change of
water coming from headwaters; and (7) transect: transects in the interior of the forest delimited for the record of species which call and reproduce far from the water body, such as direct-development species and bromeliad-dwelling species (Haddad et al. 2008). The surrounding vegetation was also taken into account, being the habitat categorized as in open area, in the edge of the forest or in the interior of the forest.
rEsults
INVENTORY, SAMPLING EFFORT AND DISTRIBUTION
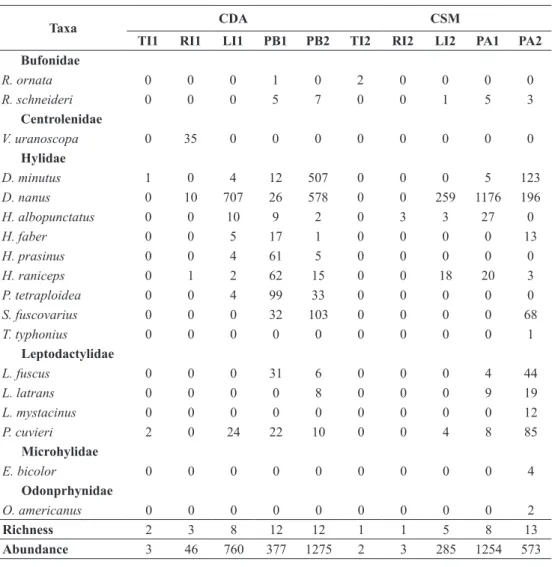
We registered 18 species of anurans (4578 indi-viduals), belonging to 11 genera and six families (Table III): Bufonidae (2 species); Centrolenidae (1 species); Hylidae (9 species); Leptodactylidae (4 species); Microhylidae (1 species); Odontophryni-dae (1 species). The richness in each of the 10 habi-tat ranged from one to 13 (Table IV). The highest richness was recorded at habitat PA4, where 72% of the species (N = 13) were found, followed by habitats PB1 and PB2, holding 66% of the spe-cies (N = 12) registered. At habitats TI2 and RI2, however, only one species was found (5% of the total). Considering both areas sampled, the higher richness was recorded at CSM, holding 15 species (83% of the total), whereas 14 species (77% of the total) were recorded at CDA.
Three species (16%) occurred exclusively within forested limits, two (11%) occurred exclusively in open area sites, and the rest of the species (N = 13; 72%) occurred in at least two or in all three categories of habitat.
DIVERSITY
There was no difference in alpha diversity between
the two sampled areas (Figure 2). However, CDA was considered to be more stable when compared
to CSM (Figure 3). The pattern of distribution of abundance was better adjusted to the model of Geometric Series for the area CDA (p = 9.9^-146) and the model of Logarhythmic Series for the area CSM (p = 2.02^-191) than the models of Broken Stick and Log-normal (p>0.05) (Figure 4).
Beta-diversity in the region sampled was con-sidered high, with a total dissimilarity of 85.5% between the areas. Eight species had bigger con-tribution to the variance of dissimilarity (Table V). taBlE III
list of species registered in the areas CDa and CsM, located in the mid northern region of the state of Paraná,
between September 2011 and March 2012; and total abundance of adult individuals by area and fragment. RBA = Reserve Barbacena, FSV = Fazenda Santa Vitória, VES = Vila Rica do Espírito Santo, FCA = Fazenda
Cagibi. T = total individuals by species and R = record method: A = adults; C = couples in amplexus; T = tadpoles/individuals in larval stage; I = imp/individuals in metamorphic transition; E = egg clutches.
Taxa CDa CsM t r
rBa FSV VES FCa
Bufonidae
Rhinella ornata (Spix 1824) 1 0 0 2 3 A/T
Rhinella schneideri (Werner 1894) 4 8 1 8 21 A/E
Centrolenidae
Vitreorana uranoscopa (Müller 1924) 35 0 0 0 35 A/E
Hylidae
Dendropsophus minutus (Peters 1872) 17 507 0 128 652 A/C
Dendropsophus nanus (Boulenger 1889) 743 578 259 1372 2952 A/C/I
Hypsiboas albopunctatus (Spix 1824) 19 2 6 27 54 A/C
Hypsiboas faber (Wied-Neuwied 1821) 22 1 0 13 36 A/E/I
Hypsiboas prasinus (Burmeister 1856) 65 5 0 0 70 A/C
Hypsiboas raniceps Cope 1862 65 15 18 23 121 A/C/I
Phyllomedusa tetraploidea Pombal & Haddad 1992 103 33 0 0 136 A/T
Scinax fuscovarius (A. Lutz 1925) 31 104 0 68 203 A/C/I
Trachycephalus typhonius (Linnaeus 1758) 0 0 0 1 1 A
leptodactylidae
Leptodactylus fuscus (Schneider 1799) 31 6 0 48 85 A
Leptodactylus latrans (Steffen 1815) 0 8 0 28 36 A/T
Leptodactylus mystacinus (Burmeister 1861) 0 0 0 12 12 A
Physalaemus cuvieri Fitzinger 1826 48 10 4 93 155 A
Microhylidae
Elachistocleis bicolor (Guérin-Méneville 1838) 0 0 0 4 4 A
odontophrynidae
Odontophrynus americanus Miranda-Ribeiro 1920 0 0 0 2 4 A
total richness 14 12 5 15 18
-total abundance by fragment 1184 1277 288 1829
4578
Figure 2 -Rarefaction curve of species of anurans recorded in the areas CDA and CSM, located in the mid northern region of the state of Paraná, between September 2011 and March 2012.
Intervals of 95% confidence are represented by dotted lines.
Figure 3 - Whittaker’s Graph based on decrescent values of the abundance logarhythm of anuran species recorded in fragments of the Mesophytic Semideciduous Forest, between September 2011 and March 2012.
taBlE IV
List and maximum abundance of anuran species recorded in all 10 water bodies sampled in
the areas CDa and CsM, located in the mid northern region of the state of Paraná, between september 2011 and March 2012. the description of the acronyms and the habitat are listed at
tables I and II.
Taxa CDa CsM
tI1 rI1 lI1 PB1 PB2 tI2 rI2 lI2 Pa1 Pa2 Bufonidae
R. ornata 0 0 0 1 0 2 0 0 0 0
R. schneideri 0 0 0 5 7 0 0 1 5 3
Centrolenidae
V. uranoscopa 0 35 0 0 0 0 0 0 0 0
Hylidae
D. minutus 1 0 4 12 507 0 0 0 5 123
D. nanus 0 10 707 26 578 0 0 259 1176 196
H. albopunctatus 0 0 10 9 2 0 3 3 27 0
H. faber 0 0 5 17 1 0 0 0 0 13
H. prasinus 0 0 4 61 5 0 0 0 0 0
H. raniceps 0 1 2 62 15 0 0 18 20 3
P. tetraploidea 0 0 4 99 33 0 0 0 0 0
S. fuscovarius 0 0 0 32 103 0 0 0 0 68
T. typhonius 0 0 0 0 0 0 0 0 0 1
leptodactylidae
L. fuscus 0 0 0 31 6 0 0 0 4 44
L. latrans 0 0 0 0 8 0 0 0 9 19
L. mystacinus 0 0 0 0 0 0 0 0 0 12
P. cuvieri 2 0 24 22 10 0 0 4 8 85
Microhylidae
E. bicolor 0 0 0 0 0 0 0 0 0 4
odonprhynidae
O. americanus 0 0 0 0 0 0 0 0 0 2
richness 2 3 8 12 12 1 1 5 8 13
COMPARISON TO OTHER ASSEMBLAGES
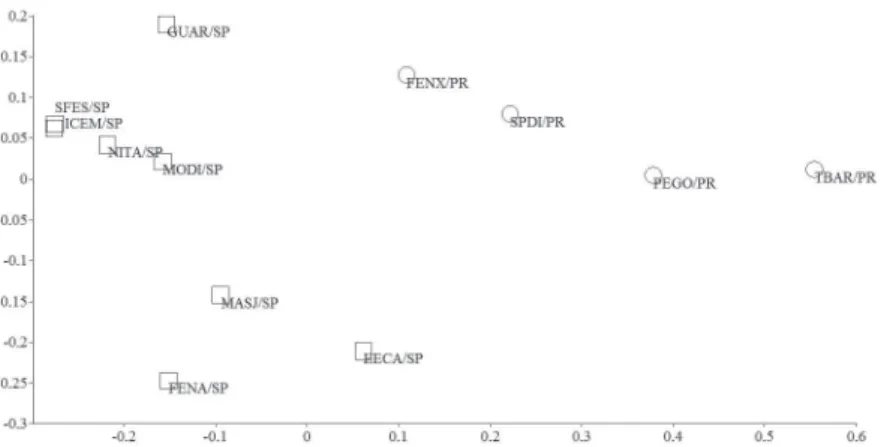
It was possible to visualize two main clusters, which coincide with the categories proposed for the localities: areas inserted above and below the Paraná River (Figure 5). The geographic distance between assemblages was the main factor regulating the variance in composition (r² = 0.59; p = 0.00).
Considering the dependence of richness on the variables analyzed, there was a higher record of species in areas where sampling was performed at a higher number of habitat (p = 0.00; r² = 0.74). That did not occur for total area size (p = 0.26; r² = 0.34) and for the number of types of habitat (p = 0.25; r² = 0.35) (Tables V and VI).
DIsCussIon
INVENTORY, SAMPLING EFFORT AND DISTRIBUTION
The record of 18 species in the studied area represents 18.9% of the anurofauna known for the MSF ecosystem (Garcia et al. 2007). All species registered in this study present wide geographical distribution (Frost 2015), occurring in two or more ecosystems. The family Hylidae represented 50% of all the registered species, which is a frequent pattern in studies carried out in the Neotropical region, since diversity in this family is very high and its species are distributed through a wide range of ecosystems (Frost 2015). Considering studies conducted in the MSF, the proportion of species of taBlE V
sIMPEr analysis for the species of anurans recorded in the areas CDa and CsM, located in the mid northern region of the state of Paraná, between september 2011 and March
2012, with values of average abundance, of total contribution to dissimilarity between areas and of accumulation of the contribution values.
species average abundance Contribution (%) Cumulative (%)
CDa CsM
Dendropsophus nanus 264.2 326.2 48.47 48.47
Dendropsophus minutus 104.8 25.6 12.25 60.73
Vitreorana uranoscopa 7 0 7.64 68.36
Physalaemus cuvieri 11.6 19.4 6.83 75.19
Phyllomedusa tetraploidea 27.2 0 4.49 79.68
Scinax fuscovarius 27 13.6 3.93 83.61
Hypsiboas albopunctatus 4.2 6.6 3.51 87.12
Hypsiboas raniceps 16 8.2 3.46 90.58
Figure 4 -Whittaker’s Graphs based on decrescent values of logarhythm of the abundance (dots) of anuran species recorded in the areas CDA (a) and CSM (b), located in the mid northern region of the state of Paraná, between September 2011 and March 2012,
plotted with their respective significant theoretical curves (bold lines). CDA: better adjusted to the Geometric Series model (p =
this family found was similar: 39% in Três Barras, state of Paraná, Brazil (Bernarde and Machado 2001/2000), 41% in Caetetus, state of São Paulo, Brazil (Brassaloti et al. 2010) and 42% in Londrina, state of Paraná, Brazil (Machado et al. 1999) and Guararapes, state of São Paulo, Brazil (Bernarde and Kokubum 1999).
In comparison to areas studied in the state of São Paulo; Santa Fé do Sul had lower richness (n = 20; Santos et al.2007), Rio Claro had equal richness (n = 21; Toledo and Haddad 2003) and Morro do Diabo (n = 28, Vasconcelos et al. 2009),
Guararapes (n = 26, Bernarde and Kokubum 1999) and Estação Ecológica de Caetetus (n = 34; Brassaloti et al. 2010) all had higher richness.
Variations in composition and occurrence of species are common, even for assemblages within the same region or ecosystem, once natural distribution, recruiting and dispersal rates may vary according to each species and to the influences which assemblages are subjected to (Ernst and Rödel 2008). In the case of MSF, the geographical distance between assemblages is the main factor determining the variance in the composition. Figure 5 - Non-metric multidimensional scaling (nMDS) analysis according
to Jaccard’s similarity matrix, considering the composition of anurans in areas inventoried within the MSF:SPDI – São Pedro do Ivaí (present study); FENX – Fênix (present study); TBAR – Três Barras do Paraná (Bernarde and Machado 2001/2000); PEGO – Parque Estadual Mata dos Godoy (Bernarde and Anjos 1999); GUAR – Guararapes (Bernarde and Kokubum, 1999); MODI – Morro do Diabo (Vasconcelos et al. 2009); ICEM – Icém (Silva and Rossa-Feres 2007); SFES – Santa Fé do Sul (Santos et al. 2007); NITA; Nova Itapirema (Vasconcelos and Rossa-Feres 2005); EECA – Estação Ecológica Caetetus (Brassaloti et al. 2010); MASJ – Mata São José (Zina et al. 2007) and FENA – Floresta Estadual ‘Edmundo Navarro de Andrade’ (Toledo and Haddad2003). Circles: localities inserted below the Paraná River. Squares: localities inserted above the Paraná River.
taBlE VI
Matrix of correlation between the analyzed variables for the areas inventoried in the MSF, with their respective values of ‘p’ and ‘r²’ (significant values are shown in bold).
Area (ha) Nº of habitats Richness Nº of categories
Area (ha) 0.026288 0.3329 0.004943
Nº of habitats 0.61176 0.007361 0.10787
Richness 0.29207 0.70294 0.056005
The structure and the distribution of species
of anurans in different ecosystems or habitat has
been explained by factors like the availability and partitioning of reproductive resources, the heterogeneity of habitat and microhabitat (Vasconcelos et al. 2009) and the reproductive modes and behavior of each species (Haddad and Prado 2005). A common pattern found in studies conducted in the Neotropical region is that higher richness rates are found in marshes and ponds, especially those of short hydroperiod. They hold generalist species, of simple reproductive modes. Slightly lower richness rates are found in transects, streams and other microhabitat that hold species with specialized habits and reproductive modes (Bernarde and Machado 2001/2000, Conte and Rossa-Feres 2006, 2007, Zina et al. 2007). The data recorded in the present study follow such pattern, since marshes and ponds were the environments with highest richness, where species considered to be generalists were registered (R. schneideri, D. nanus, D. minutus, L. fuscus and H. albopunctatus), and streams and transects were the environments with lowest richness, where species of both generalist habits (R. ornata and H. albopunctatus)
and of specific habits related to reproduction (V. uranoscopa) were registered (Bernarde and Anjos 1999, Haddad and Prado 2005, Frost 2015).
DIVERSITY
The richness, the abundance and the distribution
of anuran species in different habitat can be altered
by several factors, such as climate, heterogeneity, available resources and competition (Duellman and Trueb 1986, Wells 2007). As the areas sampled share a wide array of similar characteristics (phytophysiognomy, climate, relative size, matrix composed by crops) and are extremely close to each other, the similarity found in alpha-diversity between both areas was an expected result. Such similarity in composition and alpha-diversity in areas close to each other is demonstrated in more
physiognomies other than the MSF, like in the Ombrophilous Dense Forest (Juncá 2006) and in the Ombrophilous Mixed Forest (Conte and Rossa-Feres 2006).
The difference in distribution, however, is a reflex of the proportion of abundant and rare species
in each area (Magurran 2004). The adjustment of the curves to the Logarhythmic series and the Geometric series suggests that species spread in unsaturated habitat, occupying fractions of available niche. Such occupation occurs in random intervals of time in the case of Logarhythmic series (area CSM) and in regular intervals of time in the case
of Geometric series (area CDA). This difference in
the period of occupation might have its origin in the history and the pattern of anthropic use of the land in the area for agricultural production. Considering the area CDA, only sugar cane is grown in its matrix, with regular intervals and equal rotation
of harvests and fires throughout the years. Since fires represent a potential threat to populations of
amphibians, the occupation of the environments might happen accordingly to these events. That conclusion could also be applied for the area CSM, where sugar cane, soybeans and corn are grown,
with random intervals and fires, and harvests being
constantly altered.
Abundance curves are better adjusted to Logarhythmic and Geometric series when only one or few factors govern the ecology of a given assemblage (Magurran 2004). For anurans, such
affirmation might not be valid, once several factors
can regulate the dynamics of an assemblage (Duellman and Trueb 1986, Wells 2007). However, this might explain, or at least indicate, the assemblages inserted in less complex environments
or subject to the influence of fewer factors. That is
the biome Pampa (Santos et al. 2008), which is composed by meadows and is more homogeneous and simpler than the MSF (Garcia et al. 2007), the distribution of species was better adjusted to the models of Broken-Stick and Log-normal series, the inverse to that observed in the present study. This might be an example of how the landscape, the processes of soil usage, and the variation in
the predominance of different vegetation modify
and govern the distribution of anurans (Gray et al. 2004). When verifying this type of evaluation in other studies carried out in the MSF (Vasconcelos et al. 2009, Silva et al. 2011, 2012), it is reasonable to assume that, even in severely altered landscapes, a less intensive usage of the soil and a bigger complexity of vegetation favor an increase in diversity and stability of the anurofauna.
The high dissimilarity in composition and abundance between areas, as well as the conse-quent high beta-diversity, were not expected re-sults. Some studies demonstrate that the SIMPER
analysis can be a fine estimator of beta-diversity
(Magurran 2004, Roberts et al. 2006). They also consider that areas closer to each other or inserted in the same ecosystem and climatic conditions have the tendency of presenting lower beta-diversity based on the movement and substitution of species between environments. Since the MSF is a compar-atively more homogeneous ecosystem (Roderjan et al.2002), and the habitat evaluated in this study are not very distant from each other, beta-diversity was expected to be low.
In spite of showing similar alpha-diversity indexes, the areas sampled have populations with
different patterns of stability and of distribution of abundance. This was verified by registering and
analyzing data not usually taken into account, such as the variation in the type of agricultural matrix and the contribution of each species to beta-diversity, which demonstrates the importance of this kind of sampling. Dendropsophus nanus was considered the main responsible for that
result, since similarity indexes are sensitive to abundance (Magurran 2004), and the referred species was registered in extremely high densities in some environments while not being registered at all in others. That species has small size, limited movement and occupies preferably herbaceous and grassy vegetation in marshes for its reproduction (Bertoluci and Rodrigues 2002, Brassaloti et al. 2010). As the environments sampled vary in quantity and types of vegetation and some of them do not meet the requirements for D. nanus, large numbers of individuals were registered only in some habitats.
COMPARISON TO OTHER ASSEMBLAGES WITHIN THE MSF
Studies have demonstrated that patterns of distri-bution and similarity between assemblages might
be modified by factors such as phytophysiognomy, climate and inter/intraspecific competition
or-ganisms of limited dispersal (Duellman and Trueb 1986, Wells 2007). Thus, it is common for stud-ies to record similar compositions in assemblages within the same ecosystem (Conte and Rossa-Fe-res 2006, Zina et al. 2007). Still, the topographic peculiarities from each local and the presence of ecotones of vegetation favor the development of singular and rich assemblages due to the presence
of species typical of different landscapes or ecosys -tems (Conte and Rossa-Feres 2006), which makes the geographic distance between areas a determin-ing factor in the shapdetermin-ing of gradients and patterns of composition and similarity for species.
In a study conducted in one of the areas evaluated, Zina et al.(2007) verified the similarity
of areas inserted in different ecosystems, and found
a great grouping with high similarity between areas in the MSF and in the Cerrado, and another great grouping with areas in the ODF, results that match the characteristics of the vegetation. Considering areas sampled below the Paraná River, Conte and Rossa-Feres (2006) observed that the composition of assemblages in the OMF and the ODF are distinct
from the MSF. Taking the effects of fragmentation
and habitat split into account, the rates of diversity and dispersal are impacted greatly (Cushman 2006, Becker et al.2010), and after decades of anthropic activity, which resulted in a severe fragmentation of the MSF (Roderjan et al. 2002, Mikich and Oliveira 2003), the scenario observed today is of varied composition and rates of diversity within each fragment (Zina et al. 2007). However, there is still great similarity because of the geographic proximity, the original historical composition and the phytophysiognomy of each region (Garcia et al. 2007), just as observed in assemblages within the MSF.
The fact that the number of water bodies sampled in each area is determinant for higher
records of richness in the MSF is a reflex of the
way this ecosystem is structured and distributed. The characteristics of the landscape and/or
the ecosystem – including size, environmental heterogeneity, location and level of fragmentation - may have huge influence on the diversity of anuran amphibians (Parris 2004, Bell and Donnelly 2006, Keller et al. 2009). In the case of the MSF, the predominant vegetation is less diverse and heterogeneous if compared to the Ombrophilous or the Amazon forests (Roderjan et al. 2002). Therefore, the sampling of bigger quantities of habitat in each area is a factor of great importance, which results in more records
than sampling different types of habitat or larger
fragments. Some studies have demonstrated the connection between diversity of anurans of the MSF and environmental heterogeneity, especially in fragmented areas or areas inserted in agricultural matrices (Vasconcelos and Rossa-Feres 2005, 2008, Vasconcelos et al. 2009, Santos et al. 2012, Silva et al. 2012). However, results have been inconsistent and one of these studies (Vasconcelos
and Rossa-Feres 2005) did not find any connection
between richness and environmental heterogeneity in the area sampled. The total size of the fragment or locality where species occur is also an important factor to be taken into account, since reductions in the size theoretically tend to decrease local richness, abundance and increase the risk of
extinction (Connor and McCoy 1979, Shaffer 1981,
Bell and Donnelly 2006). This factor has been positively correlated to several taxa such as trees, beetles (Nilsson 1988), island birds (Hamilton
and Armstrong 1965) and lake fishes (Schlosser
1995). In spite of it, the correlation to total size
was not significant in the present study, probably
because anurans have peculiar characteristics such as limited capacity of locomotion and dispersal (Wells 2007), minimizing the influence of total fragment size around breeding and refuge sites where they are located. These observations could
be verified through the data obtained in the areas
(Brassaloti et al. 2010), where the highest richness was registered (N = 34 species) and the highest number of habitats was sampled (N = 15), but the total size of the area sampled (2178 ha) was similar to other localities, like in Três Barras (2200 ha) and in the reserve ‘Edmundo Navarro de Andrade’ (2222 ha), in which lower richness was registered (23 and 21 species, respectively). On the other hand, in Icém (Silva and Rossa-Feres 2007) only four habitats were sampled, and the lowest richness was registered (N = 12 species). Such results indicate that assemblages of anurans respond well to the quantity of environments important for their reproduction modes, and not only to other factors like total size and environmental heterogeneity (Zimmerman and Bierregaard 1986, Brasileiro CA., unpublished data, Haddad and Prado 2005). Furthermore, physiological and behavioral adaptations for reproduction in each species should also be considered, because they limit species’ dispersal according to their reproductive requirements and to the microhabitats and microclimates available in each area (Haddad and Prado 2005).
ConClusIons
The improvement of biological knowledge, the integral protection of habitats, the creation of management plans and the minimization of anthropic activities should be the main goals in order to preserve potentially threatened assemblages of anurans (Young et al. 2004, Silvano and Segalla 2005). Considering the studied region,
the composition of anurans is unique and modified
by the quantity of available habitats. Still, the population decline and even local extinction of species are a constant possibility, once fragments sampled and many environments of high richness and abundance are located in open areas or in the edge of the forests of a severely altered landscape. These habitats are subjected to the influence of anthropic activities, because the agricultural matrix
in which they are inserted is widely used and altered according to the crops or the season of the year. Moreover, not all fragments are legally protected nor have management plans aiming conservation (Mikich and Oliveira 2003). Thus, the studied region is recommended to be considered of high priority in conservation actions regarding anurans.
aCKnoWlEDGMEnts
We are grateful to Angelita Maques for her logistic support and provision of data. The managers of the studied areas, João, José, Márcio and Jairo, for authorizing this research. Zaqueu, Zé Augusto, Pedro Calixto, Darlene S. Gonçalves, Nathally Foerster, Igor Soares de Oliveira, Adriele C. K. de Oliveira, Fernanda A. Santos, Larissa Kienen, Bruna Imai, and all the colleagues who aided us in data
collection and accompanied us in field trips. Janael
Ricetti, for his collaboration during data analysis. Instituto Ambiental do Paraná (Authorization nº 301/11) and Instituto Chico Mendes (Authorization SISBIO nº 28999-1), for their authorizations of research and of specimen collection.
This work was supported by Renuka Vale do Ivaí Inc. and Coordenadoria de Aperfeiçoamento de Pessoal de Nível Superior (CAPES), under grants for a Master’s degree (Eduardo J. Santos - REUNI) and a Post-Doctorate degree (Carlos E. Conte - PRODOC number 18 - 32/2010).
rEsuMo
variou, mas a população de uma delas era mais estável, sugerindo melhor distribuição e equidade das espécies no habitat disponível. A diversidade-beta na região foi alta, um resultado atribuído à espécie Dendropsophus nanus. Comparando as áreas amostradas com outras na Floresta Semidecidual, a quantidade de sítios de reprodução amostrados foi a variável mais importante para maiores registros de riqueza. A distância geográfica foi um fator determinante para a distinção entre as localidades. Portanto, a conservação de fragmentos e os habitat associados a eles deve ser uma prioridade.
Palavras-chave: Floresta Atlântica, Floresta Estacio-nal Semidecidual, inventário, riqueza, abundância, comparação.
rEFErEnCEs
ALFORD RA AND RICHARDS SJ. 1999. Global amphibian declines: a problem in applied ecology. Ann Rev Ecol Syst 30: 133-165.
BECKER CG, FONSECA CR, HADDAD CFB AND PRADO PI. 2010. Habitat split as a cause of local population declines of amphibians with aquatic larvae. Cons Biol 24(1): 287-294.
BECKER CG, FONSECA CR, HADDAD CFB, BATISTA RF AND PRADO PI. 2007. Habitat split and the global decline of amphibians. Science 318: 1775-1777.
BELL KE AND DONNELLY MA. 2006. Influence of forest fragmentation on community structure of frogs and lizards in northeastern Costa Rica. Cons Biol 20(6): 1750-1760. BERNARDE PS AND ANJOS L. 1999. Distribuição espacial
e temporal da anurofauna do Parque Estadual Mata dos Godoy, Londrina, Paraná, Brasil (Amphibia: Anura). CMCT PUCRS 12: 127-140.
BERNARDE PS AND KOKUBUM MNC. 1999. Anurofauna do município de Guararapes, Estado de São Paulo, Brasil (Amphibia, Anura). Acta Biol Leopol 21: 89-97.
BERNARDE PS AND MACHADO RA. 2001/2000. Riqueza de espécies, ambientes de reprodução e temporada de vocalização da anurofauna em Três Barras do Paraná, Brasil (Amphibia: Anura). Cuad Herp 14(2): 93-104. BERTOLUCI J, BRASSALOTI RA, JÚNIOR JWR, VILEA
VMFN AND SAWAKUCHI HO. 2007. Species composition and similarities among anuran assemblages of forest sites in southeastern Brazil. Sci Agri 64(4): 364-374.
BERTOLUCI J AND RODRIGUES MT. 2002. Utilização de habitat reprodutivos e micro-habitat de vocalização em uma taxocenose de anuros (Amphibia) da Mata Atlântica do sudeste do Brasil. Pap Avul Zool 42(11): 287-297. BLAUSTEIN AR AND KIESECKER JM. 2002. Complexity in
conservation: lessons from the global decline of amphibian populations. Ecol Lett 5: 597-608.
BRASSALOTI RA, ROSSA-FERES DC AND BERTOLUCI J. 2010. Anurofauna da Floresta Estacional Semidecidual da Estação Ecológica dos Caetetus, Sudeste do Brasil. Bio Neot 10(1): 275-292.
CLARKE KR. 1993. Non-parametric multivariate analysis of changes in community structure. Aust J Ecol 18: 117-143. CLARKE KR AND WARWICK RM. 1994. Changes in
marine communities: an approach to statistical analysis and interpretation. Bournemouth. Plymouth Marine Laboratory, 144 p.
CODDINGTON JA, YOUNG LH AND COYLE FA. 1996. Estimating spider species richness in a southern appalachian cove hardwood forest. J Arach 24(2): 111-128. COLWELL RK. 2013. EstimateS: Statistical estimation of
species richness and shared species from samples. Version 9. User’s Guide and application published at: http://purl. oclc.org/estimates.
CONNOR EF AND MCCOY ED. 1979. The statistics and biology of the species-area relationship. Am Nat 113: 791-833.
CONTE CE AND MACHADO RA. 2005. Riqueza de espécies e distribuição espacial e temporal em comunidade de anuros (Amphibia, Anura) em uma localidade de Tijucas do Sul, Paraná, Brasil. Rev Br Zool 22 (4): 940-948.
CONTE CE AND ROSSA-FERES DC. 2006. Diversidade e ocorrência temporal da anurofauna (Amphibia, Anura) em São José dos Pinhais, Paraná, Brasil. Rev Br Zool 23(1): 162-175.
CO N T E CE A N D RO S S A-FE R E S DC. 2007. Riqueza e distribuição espaço-temporal de anuros em um remanescente de Floresta de Araucária no sudeste do Paraná. Rev Br Zool 24(4): 1025-1037.
CUSHMAN SA. 2006. Effects of habitat loss and fragmentation on amphibians: a review and prospectus. Biol Cons 128: 231-240.
DIDHAM RK. 2010. Ecological consequences of habitat fragmentation. In: ENCYCLOPEDIA OF LIFE SCIENCES (ELS). J Wiley & Sons, Ltd: Chichester. Online posting. Available at: http://www.els.net/WileyCDA/
DUARTE H, TEJEDO M, KATZENBERGER M, MARANGONI F, BALDO D, BELTRÁN JF, MARTÍ DA, RICHTER-BOIX A AND GONZALEZ-VOYER A. 2012. Can amphibians take the heat? Vulnerability to climate warming in subtropical and temperate larval amphibian communities. Glob Chang Biol 18: 412-421.
DUELLMAN WE AND TRUEB L. 1986. Biology of amphibians. Baltimore and London: McGraw-Hill Publications Corporation, 670 p.
Amphibian declines in Brazil: an Overview. Biotropica 37(2): 166-179.
FAHRIG L. 2003. Effects of habitat fragmentation on biodiversity. Ann Rev Ecol Sys 34: 487-515.
FROST DR. 2015. Amphibian Species of the World: an Online Reference. Version 6.0 (2015). Available at: http://research.amnh.org/vz/herpetology/amphibia/ American Museum of Natural History, New York, USA. Access in June 2015.
GAGNÉ SA AND FAHRIG L. 2007. Effect of landscape context on anuran communities in breeding ponds in the National Capital Region, Canada. Landsc Ecol 22: 205-215. GARCIA PCA, LAVILLA E, LANGONE JA AND SEGALLA
MV. 2007. Anfíbios da região Subtropical da América do Sul: padrões de distribuição. Cienc Amb 35: 65-100. GOTELLI ET AL. 2009. Patterns and causes of species richness:
a general simulation model for macroecology. Ecol Lett 12: 873-886.
GRAY MJ, SMITH LM AND LEYVA RI. 2004. Influence of agricultural landscape structure on a Southern High Plains, USA, amphibian assemblage. Landsc Ecol 19: 719-729. HADDAD CFB AND PRADO CPA. 2005. Reproductive modes
in frogs and their unexpected diversity in the Atlantic Forest of Brazil. BioSci 55(3): 207-217.
HADDAD CFB, TOLEDO LF AND PRADO CPA. 2008. Anfíbios da Mata Atlântica: guia dos anfíbios anuros da Mata Atlântica. São Paulo. Editora Neotropica. 244 p. HAMILTON TH AND ARMSTRONG NE. 1965. Environmental
determination of insular variation in birds species abundance in the Gulf of Guinea. Nature 207: 148-151. HAMMER Ø, HARPER DAT AND RYAN PD. 2001. PAST:
Paleontological Statistics software package for education and data analysis. Palaeont Elect 4(1): 9.
HOULAHAN JE, FINDLAY CS, SCHMIDT BR, MEYER AH AND KUZMIN SL. 2000. Quantitative evidence for global amphibian population declines. Nature 404: 752-755. INGER RF AND VORIS HK. 1993. A comparison of amphibian
communities through time and from place to place in Bornean Forests. J Trop Ecol 9(4): 409-433.
IUCN - INTERNATIONAL UNION FOR THE CONSERVATION OF NATURE. 2015. The IUCN Red List of Threatened Species. Version 2015-3. Available at: http://www. iucnredlist.org. Access in June 2015.
JOHN-ALDER HB, MORIN PJ AND LAWLER S. 1988. Thermal physiology, phenology, and distribution of tree frogs. Am Nat 132(4): 506-520
JUNCÁ FA. 2006. Diversidade e uso de hábitat por anfíbios anuros em duas localidades de Mata Atlântica, no norte do estado da Bahia. Bio Neot 6(2): 1-17.
KELLER A, RÖDEL M, LINSENMAIR KE AND GRAFE TU. 2009. The importance of environmental heterogeneity for species diversity and assemblage structure in Bornean stream frogs. J Anim Ecol 78: 305-314.
KNISPEL SR AND BARROS FB. 2009. Anfíbios anuros da região urbana de Altamira (Amazônia Oriental), Pará, Brasil. Biotemas 22(2): 191-194.
KREBS CJ. 1999. Ecological methodology.2nd
ed., New York (NY): Harper & Row, 620 p.
LAWTON JH AND MAY RH. 1995. Extinction rates. Oxford (United Kingdom): Oxford University Press. 1st
ed. 248p. MACHADO RA AND BERNARDE PS. 2003. Anurofauna da
bacia do Rio Tibagi. In: Medri ME, Biachini E, Shibatta OA and Pimenta JA (Eds), A Bacia do rio Tibagi. Londrina: MC-Gráfica, p. 297-306.
MACHADO RA, BERNARDE PS, MORATO SAB, ANJOS L. 1999. Análise comparada da riqueza de anuros entre duas áreas com diferentes estados de conservação no município de Londrina, Paraná, Brasil (Amphibia: Anura). Rev Bras Zool 19: 997-1004.
MAGURRAN AE. 2004. Measuring biological diversity. Blackwell Science Ltd, 256 p.
MANLY BJF. 2008. Métodos estatísticos multivariados. 3ª edição. Porto Alegre: Bookman, 230 p.
MEIRA-NETO JAA, SOUZA AL, SILVA AF AND PAULA A. 1997. Estrutura de uma Floresta Estacional Semidecidual Submontana em área diretamente afetada pela Usina Hidrelétrica de Pilar, Ponte Nova, Zona da Mata de Minas Gerais. Rev Arv 21(3): 337-344.
MIKICH SB AND OLIVEIRA KL. 2003. Revisão do plano de manejo do Parque Estadual Vila Rica do Espírito Santo, Fênix - PR. Curitiba: Mater Natura - Instituto de Estudos Ambientais; [Brasília, DF]: Ministério do Meio Ambiente, Fundo Nacional do Meio Ambiente. 452 p.
MY E R S N, MI T T E R M E I E R RA, MI T T E R M E I E R CG, FONSECA GAB AND KENT J. 2000. Biodiversity hotspots for conservation priorities. Nature 403: 853-858.
NILSSON LA. 1988. The evolution of flowers with deep corolla tubes. Nature 334: 147-149.
PARRIS KM. 2004. Environmental and spatial variables influence the composition of frog assemblages in sub-tropical eastern Australia. Ecography 27: 392-400. R CORE TEAM. 2012. R: A language and environment for
statistical computing. R Foundation for Statistical Computing, Vienna, Austria. URL http://www.R-project. org/.
RICHTER-BOIX A, LLORENTE GA AND MONTONI A. 2004. Responses to competition effects of two anuran tadpoles according to life-history traits. Oikos 106: 39-50.
ROBERTS JL, BROWN JL, SCHULTE R, ARIZABAL W AND SUMMERS K. 2006. Rapid diversification of colouration among opulations of a poison frog isolated on sky peninsulas in the central cordilleras of Peru. J Biog 34: 417-426.
ROSSA-FERES DC, SAWAYA RJ, FAIVOVICH J, GIOVANELLI JGR, BRASILEIRO CA, SCHIESARI L, ALEXANDRINO J AND HADDAD CFB. 2011. Anfíbios do Estado de São Paulo, Brasil: conhecimento atual e perspectivas. Biot Neot 11(1): 1-19.
SANTOS TG, KOPP K, SPIES MR, TREVISAN R AND CECHIN SZ. 2008. Distribuição temporal e especial de anuros em area de Pampa, Santa Maria, RS. Iheringia 98(2): 244-253. SANTOS TG, ROSSA-FERES DC AND CASATTI L. 2007.
Diversidade e distribuição espaço-temporal de anuros em região com pronunciada estação seca no sudeste do Brasil. Iheringia 97(1): 37-49.
SANTOS TG, VASCONCELOS TS AND HADDAD CFB. 2012. The role of environmental heterogeneity in maintenance of anuran amphibian diversity of the Brazilian Mesophytic Semideciduous Forest. In: TROPICAL FORESTS. Dr. Padmini Sudarshana, ISBN: 978-953-51-0255- 7, InTech, 388 p.
SCHLOSSER IJ. 1995. Critical landscape attributes that influence fish population dynamics in headwater streams. Hydrobiologia 303(1-3): 71-81.
SCOTT N AND WOODWARD BD. 1994. Surveys at breeding sites, p.118-125. In: Heyer WR, Donnelly MA, McDiarmid RW, Hayek LC And Foster MS (Eds), Measuring and Monitoring Biological Diversity - Standard Methods for Amphibians. Washington, Smithsonian Institution Press, 364 p.
SGRILLO R. 2012. GE-Path: Google Earth Path v. 1.4.6. Available from: http://www.sgrillo.net [Access in October 2012].
SHAFFER ML. 1981. Minimum population sizes for species conservation. Bioscience 31: 131-134.
SILVA RA, MARTINS IA AND ROSSA-FERES DC. 2011. Environmental heterogeneity: Anuran diversity in homogeneous environments. Zoologia28(5): 610-618. SILVA FR, CANDEIRA CP AND ROSSA-FERES DC. 2012.
Dependence of anuran diversity on environmental descriptors in farmland ponds. Bio Cons 21: 1411-1424. SILVA FR AND ROSSA-FERES DC. 2007. Uso de fragmentos
florestais por anuros (Amphibia) de área aberta na região noroeste do Estado de São Paulo. Bio Neot 7(2): 1-7. SI LVA MO, MA C H A D O RA A N D G R A F V. 2006. O
conhecimento de Amphibia do Estado do Paraná. In: MONTEIRO-FILHO ELA and ARANHA JMR (Org), Revisões em Zoologia I: Volume Comemorativo dos 30 Anos do Curso de Pós-Graduação em Zoologia da Universidade Federal do Paraná. 1ª ed. Curitiba: M5 Gráfica e Editora, p. 305-314.
SILVANO DL AND SEGALLA MV. 2005. Conservação de anfíbios no Brasil. Megadiversidade 1(1): 79-86.
THOMAS CD ET AL. 2004a. Extinction risk from climate change. Nature 427: 145-148.
THOMAS JA, TELFER MG, ROY DB, PRESTON CD, GREENWOOD JJD, ASHER J, FOX R, CLARKE RT AND
LAWTON JH. 2004b. Comparative losses of British butterflies, birds, and plants and the global extinction crisis. Science 303(5665): 1879-1881.
TOLEDO LF AND HADDAD CFB. 2003. Distribuição espacial e temporal de uma comunidade de anfíbios anuros do município de Rio Claro, São Paulo, Brasil. Hol Env 3(2): 136-149.
VAN BOCXLAER I, LOADER SP, ROELANTS K, BIJU SD, MENEGON M AND BOSSUYT F. 2010. Gradual adaptation toward a range-expansion phenotype initiated the global radiation of toads. Science 327: 679-682
VASCONCELOS TS AND ROSSA-FERES DC. 2008. Habitat heterogeneity and use of physical and acoustic space in anuran communities in Southeastern Brazil. Phyllomedusa 7(2): 127-142.
VA S C O N C E L O S TS A N D RO S S A -FE R E S DC. 2005. Diversidade, distribuição espacial e temporal de anfíbios anuros (Amphibia, Anura) na região noroeste do estado de São Paulo, Brasil. Biot Neot 5(2): 1-14.
VASCONCELOS TS, SANTOS TG, ROSSA-FERES DC AND HADDAD CFB. 2009. Influence of the environmental heterogeneity of breeding ponds on anuran assemblages from southeastern Brazil. Can J Zool 87: 699-707. VELOSO HP, RANGEL-FILHO ALR AND LIMA JCA. 1991.
Classificação da vegetação brasileira, adaptada à um sistema universal. Rio de Janeiro, IBGE, 124 p.
WELLS KD. 2007. The ecology and behavior of amphibians. Chicago University Press, 1148 p.
WHITTAKER RH. 1965. Dominance and diversity in land plant communities. Science 147: 250-260.
YOUNG BE, STUART SN, CHANSON JS, COX NA AND BOUCHER TM. 2004. Disappearing jewels: The status of New World Amphibians. NatureServe, Arlington, USA, 60 p.
ZAR JH. 1999. Bioestatistical analysis. New Jersey, Prentice Hall, 663 p.
ZIMMERMAN BL AND BIERREGAARD RO. 1986. Relevance of the equilibrium theory of island biogeography and species-area relations to conservation with a case from Amazonia. J Biog 13: 133-143.
ZINA J, ENNSER J, PINHEIRO SCP, HADDAD CFB AND TOLEDO LF. 2007. Taxocenose de anuros de uma mata semidecídua do interior do Estado de São Paulo e comparações com outras taxocenoses do Estado, sudeste do Brasil. Biot Neot 7(2): 1-9.
aPPEnDIx I
LIST OF VARIABLES CONSIDERED AND ANALYZED FOR THE LOCALITIES INVENTORIED IN THE MSF.
sugar-cane, soybean and corn matrix (present study); TBAR – Três Barras do Paraná (Bernarde and Machado 2001/2000); PEGO – Parque Estadual Mata dos Godoy (Bernarde and Anjos 1999); GUAR – Guararapes (Bernarde and Kokubum 1999); MODI – Morro do Diabo (Vasconcelos et al. 2009); ICEM – Icém (Silva and Rossa-Feres 2007); SFES – Santa Fé do Sul (Santos et al. 2007); NITA; Nova Itapirema (Vasconcelos and Rossa-Feres 2005); EECA – Estação Ecológica Caetetus (Brassaloti et al. 2010); MASJ – Mata São José (Zina et al. 2007); FENA – Floresta