Increased metabolisable energy from glycerine or soybean oil in
broilers
1Energia metabolizável incrementada com glicerina ou óleo de soja para frangos
Ramon Rêgo Merval2*, Leilane Rocha Barros Dourado3, Flávio Ferreira Silva4, Edna Teles dos Santos4 and João Batista Lopes5
ABSTRACT - The effect of increased levels of metabolisable energy with glycerine or soybean oil was evaluated in the
performance of broilers at four growth stages (1 to 7, 8 to 21, 22 to 33 and 34 to 42 days), in addition to the carcass and cut yield. A total of 2,400 birds were used in a completely randomised design in a 2 x 4 factorial scheme (two sources x four energy levels), with five replications. The treatments were determined by including glycerine or soybean oil at intervals of 75 kcal/kg of metabolisable energy in the diet: the first level with 75 kcal less than the requirement, the second corresponding to the requirement for each stage (2925, 2980, 3050 and 3100 Kcal), and the third and fourth levels with 75 kcal and 150 kcal more than the required value for the stage under evaluation. The metabolisable energy requirement for broilers, irrespective of the energy source (glycerine or soybean oil), was estimated at 3,075, 3.130, 3,200 and 3,250 kcal ME/kg feed, for stages 1 to 7, 8 to 21, 22 to 33 and 34 to 42 days respectively. However, the use of glycerine as a source of increased energy promoted better performance efficiency during the first two stages (1 to 7 and 8 to 21 days of age).
Key words: Poultry farming. Fat. Energy sources. Performance.
RESUMO - Avaliou-se o efeito dosníveis de energia metabolizável incrementados com glicerina ou óleo de soja sobre o
desempenho de frangos de corte em quatro fases (1 a 7; 8 a 21; 22 a 33 e 34 a 42 dias), e o rendimento de carcaça e cortes. Foram utilizadas 2400 aves com delineamento inteiramente casualizado, em esquema fatorial (duas fontes x quatro níveis de energia), com cinco repetições. Os tratamentos foram estabelecidos por meio da inclusão da glicerina ou do óleo de soja, em intervalos de 75 kcal/kg de energia metabolizável da dieta, o primeiro nível com 75 kcal abaixo da exigência, o segundo corresponde à exigência de cada fase (2925, 2980, 3050 e 3100 Kcal) o terceiro e o quarto nível com 75 kcal e 150 kcal, acima do valor da exigência para a fase avaliada. A exigência de energia metabolizável para frangos de corte, independente da fonte de incremento energético (glicerina ou óleo de soja), foi estimada em 3.075; 3.130; 3.200 e 3.250 kcal de EM/kg de ração, para as fases de 1 a 7; 8 a 21; 22 a 33; 34 a 42 dias, respectivamente. Entretanto, a utilização de glicerina como fonte de incremento energético, promoveu melhor eficiência no desempenho nas duas primeiras fases (1 a 7 e 8 a 21 dias de idades).
Palavras-chave: Avicultura. Gordura. Fontes de energia. Desempenho.
DOI: 10.5935/1806-6690.20190054 *Author for correspondence
Received for publication in 19/01/2016; approved in 27/07/2018
1Parte da Dissertação de Mestrado do primeiro autor apresentada no Programa de Pós Graduação em Ciência Animal/UFPI
2Departamento de Zootecnia, Centro de Ciências Agrárias, Campus Ministro Petrônio Portella, Universidade Federal do Piauí, Bom Jesus-PI, Brasil,
[email protected] (ORCID 0000-0002-4392-2588)
3Departamento de Zootecnia, Campus Professora Cinobelina Elvas, Universidade Federal do Piauí, Bom Jesus-PI, Brasil, [email protected]
(ORCID 0000-0001-7141-6677)
4Departamento de Zootecnia, Campus Professora Cinobelina Elvas, Universidade Federal do Piauí, Bom Jesus-PI, Brasil, flavioferreira_26@hotmail.
com (ORCID 0000-0002-9622-2358), [email protected] (ORCID 0000-0002-7101-8238)
5Departamento de Zootecnia, Centro de Ciências Agrárias, Campus Ministro Petrônio Portella, Universidade Federal do Piauí, Teresina-PI, Brasil,
INTRODUCTION
The chemical process of converting vegetable oils into biodiesel involves methyl or ethyl transesterification reactions of triacylglycerides, which generate methyl or ethyl esters as products, and glycerol as residue (QUINTELLA et al., 2009). Considering that the glycerine purification process is quite expensive, and that any surplus from biodiesel production is not fully utilised, animal production would appear to be a promising field for the use of glycerine as an energy source in diets (SUCHÝ
et al., 2011). Crude glycerine from the biodiesel process
includes glycerol in its composition, a molecule with well-established glycogenic properties (MIN et al., 2010).
Food intake increases metabolism, raising the amount of body heat, since digestion and nutrient absorption generate energy, which is released in the form of heat. In addition, broilers submitted to temperatures above the thermoneutral zone lower their capacity for dissipating heat, and use such strategies as reducing their feed intake to reduce internal heat production caused by the ingestion of energy present in the feed (COSTA et al., 2012). Authors such as Silva et al. (2015) found that broilers subjected to thermal discomfort (38-40 °C) reduced their feed intake, weight gain and feed conversion by on average 11.3, 4.6 and 1.4% respectively.
A practical solution for meeting the energy needs of animals, and for minimising the production of heat generated by food intake, is related to the inclusion of ingredients in the diet that result in a low caloric increase (energy spent on digestion and metabolic processes). From this perspective, the use of oils and fats with a caloric increase coefficient of 0.16%, less than carbohydrates and proteins, is important (BERTECHINI, 2012). The low molecular weight of glycerol allows it to be absorbed more easily by diffusion in the enterocytes, where it is oxidised for energy production via glycolysis and the Krebs cycle (BERNARDINO et al., 2013). Although no studies have been found on the actual caloric increase from glycerol, it is believed that glycerol can be included in diets as an ingredient for this purpose, since besides being easily absorbed, it presents a high coefficient of metabolisable energy, as found by Rostagno et al. (2017).
As such, the aim of this study was to evaluate the effect of two different sources of energy (glycerine and soybean oil), different levels of ME in the diet, and their interactions (source x energy level of the diet) on performance, and carcass and main cut yield in broilers.
MATERIAL AND METHODS
The experiment was conducted in the poultry sector of the Bom Jesus Agricultural College (CABJ),
on the Professor Cinobelina Elvas Campus (CPCE) of the Federal University of Piauí (UFPI), in Bom Jesus in the State of Piauí (PI), with the approval of the Ethics Committee for Animal Experimentation of UFPI, under protocol no. 22/2009-CEEA/UFPI. A total of 600 male Cobb broilers were used for each stage of the evaluation (1 to 7, 8 to 21, 22 to 33 and 34 to 42 days of age), giving a total of 2,400 birds. At the beginning of each stage the birds were weighed and divided into experimental units; animals that were not being used were kept in a separate shed, where they were raised and fed following the recommendations of the breed handbook.
The design was completely randomised in a 2 x 4 factorial scheme (two sources x four energy levels), with five replications of 15 birds per experimental unit (coop). The birds were housed in coops of 2 m2, containing tubular
feeders and hanging drinkers. The four energy levels of each stage were determined by the addition of glycerine or soybean oil at intervals of 75 kcal/kg of metabolisable energy in the diet: the first level being 75 kcal below the requirement recommended by Rostagno et al. (2011), the second corresponding to the requirement for each stage (2,925, 2,980, 3,050 and 3,100 kcal/kg feed for stages 1 to 7, 8 to 21, 22 to 33 and 34 to 42 days respectively), and the third and fourth levels with 75 kcal and 150 kcal respectively more than the value required by the birds for the stage under evaluation.
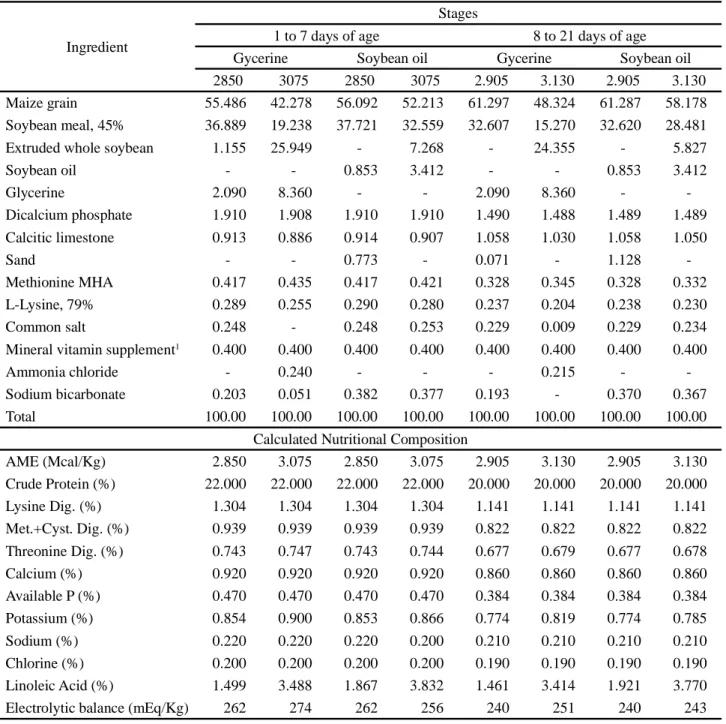
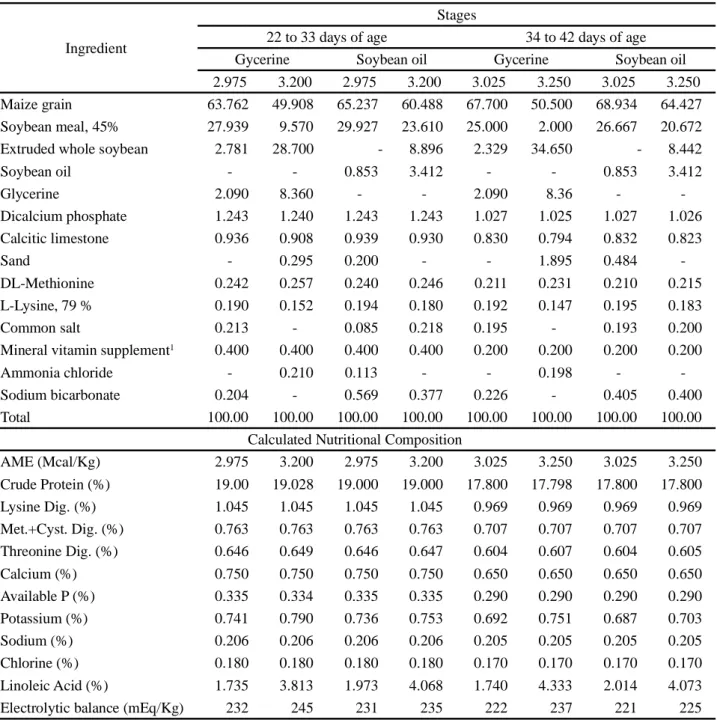
The experimental diets were formulated to meet the nutritional requirements of the chickens at each stage of the study, as per the recommendation of Rostagno et al. (2011) (Tables 1 and 2), except for the metabolisable energy, that varied according to the treatments being evaluated, and for the level of sodium, that was 2.91% and 4.87% higher than required during the 3rd and 4th stage respectively; as the higher levels of glycerine increased the sodium content of the feed, the same value was maintained for each of the other diets.
The glycerine used was supplied by ADM, and comprised 80.95% glycerol, 30 ppm methanol, 2.29% sodium, 10.65% moisture and 3,585 kcal ME/kg feed. The composition of the ingredients used in the formulations were as presented by Rostagno et al. (2011), with the Na and GE content of the glycerol being analysed. The ME value of the glycerine was obtained based on the metabolisable energy coefficient of the gross energy recommended by Rostagno et al. (2011), multiplied by the value for gross energy analysed in the animal nutrition laboratory of CCA-UFPI.
The temperature and relative humidity of the sheds were monitored by means of a maximum and minimum thermometer kept in the centre of the shed, where the thermometer was read twice a day (08:00 and 16:00).
Table 1 - Percentage and calculated composition of the experimental diets used in stages 1 to 7 and 8 to 21 days of age
Ingredient
Stages
1 to 7 days of age 8 to 21 days of age
Gycerine Soybean oil Gycerine Soybean oil
2850 3075 2850 3075 2.905 3.130 2.905 3.130
Maize grain 55.486 42.278 56.092 52.213 61.297 48.324 61.287 58.178
Soybean meal, 45% 36.889 19.238 37.721 32.559 32.607 15.270 32.620 28.481
Extruded whole soybean 1.155 25.949 - 7.268 - 24.355 - 5.827
Soybean oil - - 0.853 3.412 - - 0.853 3.412 Glycerine 2.090 8.360 - - 2.090 8.360 - -Dicalcium phosphate 1.910 1.908 1.910 1.910 1.490 1.488 1.489 1.489 Calcitic limestone 0.913 0.886 0.914 0.907 1.058 1.030 1.058 1.050 Sand - - 0.773 - 0.071 - 1.128 -Methionine MHA 0.417 0.435 0.417 0.421 0.328 0.345 0.328 0.332 L-Lysine, 79% 0.289 0.255 0.290 0.280 0.237 0.204 0.238 0.230 Common salt 0.248 - 0.248 0.253 0.229 0.009 0.229 0.234
Mineral vitamin supplement1 0.400 0.400 0.400 0.400 0.400 0.400 0.400 0.400
Ammonia chloride - 0.240 - - - 0.215 -
-Sodium bicarbonate 0.203 0.051 0.382 0.377 0.193 - 0.370 0.367
Total 100.00 100.00 100.00 100.00 100.00 100.00 100.00 100.00
Calculated Nutritional Composition
AME (Mcal/Kg) 2.850 3.075 2.850 3.075 2.905 3.130 2.905 3.130 Crude Protein (%) 22.000 22.000 22.000 22.000 20.000 20.000 20.000 20.000 Lysine Dig. (%) 1.304 1.304 1.304 1.304 1.141 1.141 1.141 1.141 Met.+Cyst. Dig. (%) 0.939 0.939 0.939 0.939 0.822 0.822 0.822 0.822 Threonine Dig. (%) 0.743 0.747 0.743 0.744 0.677 0.679 0.677 0.678 Calcium (%) 0.920 0.920 0.920 0.920 0.860 0.860 0.860 0.860 Available P (%) 0.470 0.470 0.470 0.470 0.384 0.384 0.384 0.384 Potassium (%) 0.854 0.900 0.853 0.866 0.774 0.819 0.774 0.785 Sodium (%) 0.220 0.220 0.220 0.200 0.210 0.210 0.210 0.210 Chlorine (%) 0.200 0.200 0.200 0.200 0.190 0.190 0.190 0.190 Linoleic Acid (%) 1.499 3.488 1.867 3.832 1.461 3.414 1.921 3.770
Electrolytic balance (mEq/Kg) 262 274 262 256 240 251 240 243
Pre-initial stage:1Guarantee levels per kg of product: folic acid 200 (mg); pantothenic acid 3,120 (mg); antioxidant additive 25,000 (mg); biotin 10,000
(mg); copper 2,000 (mg); choline 78,102.01 (mg); iron 11,250 (mg); halquinol 7,500 (mg); iodine 187.50 (mg); manganese 18,738.60 (mg); monensin 25,000 (mg); niacin 8,400 (mg); selenium 75 (mg); vitamin A 1,680,000 (IU); vitamin B1 436.50 (mg); vitamin B2 1,200 (mg); vitamin B6 624 (mg); vitamin B12 2,400 (mg); vitamin D3 400,000 (IU); vitamin E 3,500 (mg); vitamin K3 360 (mg); zinc 17,500 (mg); Initial stage:1Guarantee levels per
kg of product: folic acid 162.50 (mg); pantothenic acid2,600 (mg); antioxidant additive 25,000 (mg); copper 2,000 (mg); choline 71,593.49 (mg); iron 11.250 (mg); halquinol 7,500 (mg); iodine 187.50 (mg); manganese 18,750 (mg); niacin 7000 (mg); selenium 75 (mg); vitamin A 1,400,000 (IU); vitamin B1 388 (mg); vitamin B2 1,000 (mg); vitamin B6 520 (mg); vitamin B12 2,000 (mg); vitamin D3 300,000 (IU); vitamin E 2,500 (mg); vitamin K3 300 (mg); zinc 17,500 (mg)
Feed intake (FI) was evaluated for each stage, calculated from the difference between the amount of feed supplied and the leftovers of the experimental diets. Weight gain (WG) was determined from the difference in
the weight of the birds at the start and at end of each growth stage. From the data for feed intake and weight gain, the feed conversion was calculated. At the end of the third and fourth stages (at 33 and 44 days of age), two birds from
Growth Stage: 1Guarantee levels per kg of product: folic acid 162.50 (mg); pantothenic acid 2,600 (mg); antioxidant additive 25,000 (mg); copper 2,000
(mg); choline 71,593.49 (mg); iron 11,250 (mg); halquinol 7,500 (mg); iodine 187.50 (mg); manganese 18,750 (mg); niacine 7,000 (mg); selenium 75 (mg); vitamin A 1,400,000 (UI); vitamin B1 388 (mg); vitamin B2 1,000 (mg); vitamin B6 520 (mg); vitamin B12 2,000 (mg); vitamin D3 300,000 (UI); vitamin E 2,500 (mg); vitamin K3 300 (mg); zinc 17,500 (mg); Slaughter:1 Guarantee levels per kg of product: pantothenic acid 3,536.00 (mg);
copper 3,250.00 (mg); choline 117,15 (mg); iron 20.00 (g); iodine 400 (mg); manganese 30.00 (g); niacine 10.21 (g); selenium 100.00 (mg); vitamin A 982,500.00 (UI); vitamin B12 2,357.00 (mg); vitamin B2 1,212.00 (mg); vitamin D3 25,000.00 (UI); vitamin E 2,750.00 (UI); vitamin K3 275.00 (mg); zinc 25.00 g
Ingredient
Stages
22 to 33 days of age 34 to 42 days of age
Gycerine Soybean oil Gycerine Soybean oil
2.975 3.200 2.975 3.200 3.025 3.250 3.025 3.250
Maize grain 63.762 49.908 65.237 60.488 67.700 50.500 68.934 64.427
Soybean meal, 45% 27.939 9.570 29.927 23.610 25.000 2.000 26.667 20.672
Extruded whole soybean 2.781 28.700 - 8.896 2.329 34.650 - 8.442
Soybean oil - - 0.853 3.412 - - 0.853 3.412 Glycerine 2.090 8.360 - - 2.090 8.36 - -Dicalcium phosphate 1.243 1.240 1.243 1.243 1.027 1.025 1.027 1.026 Calcitic limestone 0.936 0.908 0.939 0.930 0.830 0.794 0.832 0.823 Sand - 0.295 0.200 - - 1.895 0.484 -DL-Methionine 0.242 0.257 0.240 0.246 0.211 0.231 0.210 0.215 L-Lysine, 79 % 0.190 0.152 0.194 0.180 0.192 0.147 0.195 0.183 Common salt 0.213 - 0.085 0.218 0.195 - 0.193 0.200
Mineral vitamin supplement1 0.400 0.400 0.400 0.400 0.200 0.200 0.200 0.200
Ammonia chloride - 0.210 0.113 - - 0.198 -
-Sodium bicarbonate 0.204 - 0.569 0.377 0.226 - 0.405 0.400
Total 100.00 100.00 100.00 100.00 100.00 100.00 100.00 100.00
Calculated Nutritional Composition
AME (Mcal/Kg) 2.975 3.200 2.975 3.200 3.025 3.250 3.025 3.250 Crude Protein (%) 19.00 19.028 19.000 19.000 17.800 17.798 17.800 17.800 Lysine Dig. (%) 1.045 1.045 1.045 1.045 0.969 0.969 0.969 0.969 Met.+Cyst. Dig. (%) 0.763 0.763 0.763 0.763 0.707 0.707 0.707 0.707 Threonine Dig. (%) 0.646 0.649 0.646 0.647 0.604 0.607 0.604 0.605 Calcium (%) 0.750 0.750 0.750 0.750 0.650 0.650 0.650 0.650 Available P (%) 0.335 0.334 0.335 0.335 0.290 0.290 0.290 0.290 Potassium (%) 0.741 0.790 0.736 0.753 0.692 0.751 0.687 0.703 Sodium (%) 0.206 0.206 0.206 0.206 0.205 0.205 0.205 0.205 Chlorine (%) 0.180 0.180 0.180 0.180 0.170 0.170 0.170 0.170 Linoleic Acid (%) 1.735 3.813 1.973 4.068 1.740 4.333 2.014 4.073
Electrolytic balance (mEq/Kg) 232 245 231 235 222 237 221 225
Table 2 - Percentage and calculated composition of the experimental diets used in stages 22 to 33 and 34 to 42 days of age
each coop (mean weight ± 10%) were slaughtered after a 12-hour fast to evaluate the carcass and cut yields.
The data were evaluated for homoscedasticity and normality, and identified outliers were removed. The data
were then submitted to analysis of variance by the GLM procedure of the SAS (Statistical Analysis System, 9.2) software (SAS INSTITUTE, 2002). The mean values were compared by the SNK test at 5% significance, and polynomial regression models were used to explore the
effects of the increasing levels of AME from the feed, considering a significance level of 5%.
RESULTS AND DISCUSSION
According to Abreu and Abreu (2011), the mean values for temperature and relative humidity (Table 3) indicate that the birds underwent thermal discomfort during the growth stages. Under such conditions, the physiological effort of the animals to maintain their body temperature within the thermoneutral zone is greater, altering their behaviour, and causing metabolic changes and changes to the heat-dissipation mechanism (SHINI et al., 2008), resulting in energy usage being directed away from productive development to maintaining temperature.
For the variable of weight gain (WG) during the 1 to 7-day stage, there was an interaction (P<0.05) between the source of increased energy and the levels of metabolisable energy (ME). WG in the birds consuming diets with added glycerine at 2,850 kcal ME/kg feed was lower than the WG provided by the diet with added soybean oil at the same energy level, the opposite occurring at the level of 3,075 kcal ME/kg feed (Table 4). Xavier et al. (2008), working with increasing levels of ME during the 1 to 7-day stage, did not observe any significant effects from the pre-initial feed on WG. The differences seen between sources may be related to metabolism of the glycerine and oil. Dozier et al. (2008) stated that young birds metabolise the energy from glycerol better than do older birds. However, in the bird organism, the oil may display the extra-caloric effect that reflects the supply and utilisation of fatty acids for non-energy functions, with an improvement in the absorption of some fat-soluble vitamins; this does not happen with glycerine, which consists mainly of glycerol.
Feed conversion (FC) during the 1 to 7-day stage showed a linear effect (Y = 1.86 - 0.0003ME, r2 = 0.55).
For each unit of ME added to the feed a potential reduction of 0.0003 g feed/g weight gain was found for FC. The best feed conversion can be attributed to an increase in caloric density, the extra caloric and metabolic effect of fat, which results in an improvement in energy efficiency
by increasing the net energy of the feed (SAKOMURA
et al., 2004).
In relation to the effect of the sources of increased metabolisable energy in the diet, a difference (P<0.05) was seen for FC only (Table 4), where the birds that received diets with added glycerine had a 3.5% better FC than those fed on soybean oil.
During the pre-initial stage of the broiler, feed intake is low compared with the other stages, accounting for 3.5% of the total (DALLMANN et al., 2010). The low intake justifies the use of ingredients of high digestibility in formulating diets to favour the use of nutrients, because at this stage of life, the birds are not fully adapted to ingesting carbohydrates or lipids (OLIVEIRA et al., 2009).
A quadratic effect was seen for FI on the levels of metabolisable energy during the 8 to 21-day stage (P<0.05) (FI = 16051 - 9.8058 ME + 0.0016 ME2, r2 = 0.98), with the
lowest intake achieved using feed containing 3.064 kcal ME/kg (Table 5). These results are similar to those found by Alvarenga et al. (2011), who found a reduction in the intake (P<0.05) of birds from 8 to 21 days with increases in the energy level of the diet, whereas Bernardino et al. (2014) found no interaction between the levels and sources of glycerine for feed intake.
An interaction (P<0.05) was seen between the sources of increased energy and the levels of metabolisable energy (ME) for the variables WG and FC during the evaluation stage (8 to 21 days). WG in the birds fed diets with added glycerine was better than in the diets with soybean oil at a level of 3.130 kcal ME/kg feed.
When evaluating the increase in metabolisable energy of the diets separately (by source), a linear increase was found for WG according to the equations for glycerine (WGg = -285.53 + 0.2816 ME, r2 = 0.91) and soybean oil
(WGo = 224.95 + 0.1079 ME, r2 = 0.62), where for each
additional unit of ME in the feed an increase of 0.2816 g in weight gain/bird was seen for glycerine and 0.1079 g in weight gain/bird for soybean oil.
The rise in the levels of ME in the diets for both sources of increased energy (glycerine x soybean oil) resulted in a linear decrease in FC according to the equations for
Stage Max. Temp. (ºC) Min. Temp. (ºC) Relative Humidity (%)
1-7 days 35.43 23.39 65.18
8-21 days 33.40 23.62 70.54
22-33 days 34.80 22.86 69.42
34-42 days 35.04 22.64 69.11
Variable Source ME Level (kcal/kg) Mean CV (%) P>F 2905 2980 3055 3130 Source ME SxME FI (g) Glycerine 906.00 872.69 847.92 841.38 867.00 a 2.47 0.031 <0.0001 0.707 Soy Oil 888.96 858.10 821.40 837.83 853.16 b Mean1 897.48 865.40 836.14 837.61 WG (g) Glycerine2 524.80 a 564.40 a 576.40 a 591.20 a 564.20 3.22 0.025 <0.0001 0.014 Soy Oil3 546.00 a 537.80 a 549.75 a 569.00 a 550.68 Mean 535.40 551.10 564.55 580.10 FC (g) Glycerine4 1.72 a 1.54 a 1.47 a 1.42 a 1.54 3.69 0.758 <0.0001 0.021 Soy Oil5 1.63 a 1.59 a 1.49 a 1.47 a 1.55 Mean 1.67 1.57 1.48 1.44
glycerine (FCg = 5.44 - 0.0013 ME, r² = 0.91) and soybean oil (FCo = 3.87 - 0.0008 ME, r² = 0.93) (Table 5), where each additional unit of ME in the feed corresponded to a reduction of 0.0013 g of feed/g of weight gain for glycerine and 0.0008 g feed/g weight gain for the soybean oil.
Nascimento et al. (2004) evaluated different energy levels (2,850, 3,000 and 3,150 kcal AME/kg feed) and ME to CP ratios (125, 136.9 and 151.5 kcal/% CP) during the initial stage of broilers, and found that a level of 3,150 kcal ME/kg feed gave the best results for feed conversion, similar to the values found in this study. The gradual increase in net energy of the feed due to the reduction in caloric increase explains the results for feed conversion (OLIVEIRA et al., 2000).
An interaction (P<0.05) between the sources of increased energy and the levels of metabolisable energy (ME) was seen for the 22 to 33-day stage for feed intake (FI) (Table 6). The birds that ingested the diet with glycerine showed a higher FI than those on the diet with soybean oil at levels of 3,050 and 3,125 kcal ME/kg feed.
When considering energy levels, a quadratic effect was seen for the sources of increase of the metabolisable energy in the diet, as per the equations for glycerine (CRg = -42006 + 28.673 ME - 0.0047 ME2, r2 = 0.91), with
the maximum value for intake occurring at the level of 3,050 kcal ME/kg feed; this value was close to the lowest evaluated energy level for the stage. There was also a
Variable Source ME Level (kcal/kg) Mean CV (%) P>F
2850 2925 3000 3075 Source ME SxME FI (g) Glycerine 146.16 142.15 141.49 136.90 141.67 4.51 0.231 0.057 0.982 Soy Oil 148.10 143.74 144.33 140.66 144.20 Mean 147.13 142.94 142.75 138.78 WG (g) Glycerine 123.9 b 130.2 a 131.8 a 128.9 a 128.75 3.68 0.073 0.048 0.033 Soy Oil 128.2 a 124.5 a 130.2 a 120.8 b 125.73 Mean 126.11 127.41 131.10 124.89 FC (g) Glycerine 1.17 1.09 1.07 1.06 1.10 a 4.60 0.012 0.024 0.063 Soy Oil 1.15 1.15 1.10 1.16 1.14 b Mean1 1.16 1.12 1.08 1.11
Mean values with the same lowercase letter in a column do not differ statistically by the SNK test (P<0.05).1Linear effect (FC = 1.86 – 0.0003ME, r2 = 0.55)
Table 4 - Effect of energy levels with added glycerine or soybean oil (Soy Oil) on feed intake (FI), weight gain (WG) and feed
conversion (FC) during the 1 to 7-day stage
Table 5 - Effect of energy levels with added glycerine or soybean oil on feed intake (FI), weight gain (WG) and feed conversion (FC)
during the 8 to 21-day stage
Mean values with the same lowercase letter in a column do not differ statistically by the SNK test (P<0.05).1Quadratic effect (FI = 16051 - 9.8058ME
+ 0.0016 ME2, r2 = 0.98);2Linear effect (WG
g = -285.53 + 0.2816ME, r
2 = 0.91);3Linear effect (WG
o = 224.95 + 0.1079ME, r
2 = 0.62);4Linear effect
(FCg = 5.44 - 0.0013ME, r2 = 0.91);5Linear effect (FC
quadratic effect for the soybean oil, as per the equation (FIo = 39111 - 24,058 ME + 0.0039 ME2, r2 = 0.99),
with the lowest value seen at 3,084 kcal ME/kg feed (Table 6). These results characterise a reduction in feed intake for increasing levels of ME in the diets with added glycerine, which may be related to the energy theory of feed intake (GONZALES, 2008); this states that under suitable conditions, birds tend to regulate their feed intake according to the energy level of the diet as a function of their daily energy needs. However, in the present work the birds were under cyclic thermal stress (Table 3) and theoretically would not be able to properly adjust their intake as a function of the energy level. In this case, according to the ionostatic theory proposed by Felix et al. (2014), they might be adjusting their intake as a function of the electrolyte content, since the electrolytic balance of the diet with 3050 kca/kg was higher (245 mEq/kg) than in the other diets, which could favour the best acid base balance for the body to improve heat dissipation. Thus, among the several existing theories, the organism may present different responses for feed intake as a function of physiological, environmental and genetic factors; however, most of the responses are regulated by the hypothalamus, which has the role of mediating stimuli that are directly connected to the behaviour of an individual in the presence of food (ABDELQADER; AL-FALAFTAH, 2014).
A decreasing linear effect was seen for FC (FC = 3.43 - 0.0006ME, r2 = 0.84), where for each additional unit
of ME in the feed there was a reduction of 0.0006g feed/g weight gain. Barbosa et al. (2008) found no significant effect for the variables WG and FC in broiler chickens fed with increasing levels of metabolisable energy at the 22 to 35-day stage.
During the 34 to 42-day stage, no interaction (P>0.05) was seen between the sources of increased energy and the levels of metabolisable energy (ME) for the variables FI, WG or FC (Table 7), demonstrating that the response to ME levels does not depend on the source at this stage. However, according to the equations for FI (FI = 2718 - 0.351 ME, r2 = 0.92) and FC (FC = 5.25 - 0.001
ME, r2 = 0.96), a decreasing linear effect was seen on the
variables FI and FC for the levels of metabolisable energy, where for each additional unit of ME in the feed there was a reduction of 0.0351 g/bird for feed intake and 0.001 g feed/g weight gain for feed conversion.
This research confirms the findings of Guerra et al. (2011), who observed a decreasing linear effect (P<0.05) on feed intake in broilers from 21 to 42 days of age as the levels of glycerine in the diet were increased. This differed from authors such as Barbosa et al. (2008), who found no significant effect on the variables WG and FC in broiler chickens fed with increasing levels of metabolisable energy during the 36 to 42-day stage.
There was an increasing linear effect (WG = 25.13 ± 0.251 ME, r2 = 0.77) on weight gain (WG) during the 34
to 42-day stage (Table 7), where an increase of 0.251 g in weight gain/bird was seen for each additional unit of ME in the feed.
The diets with added glycerine resulted in greater feed intake than those with soybean oil, which may be related to the metabolisable coefficient of the diets with glycerine, since Dozier et al. (2008) found lower values for metabolisable energy from the glycerine at more-advanced ages, whereas in this study, the value for metabolisable energy from the glycerine used was the
Table 6 - Effect of energy levels with added glycerine or soybean oil on feed intake (FI), weight gain (WG) and feed conversion
(FC) during the 22 to 33-day stage
Mean values with the same lowercase letter in a column do not differ statistically by the SNK test (P<0.05).1Quadratic effect (FI
g = - 42006 + 28.673
ME – 0.0047 ME2, r2 = 0.91);2Quadratic effect (FI
o = 39111 – 24.058 ME + 0.0039 ME
2, r2 = 0.99);3Linear effect (FC = 3.43 – 0.0006 ME, r2 = 0.84)
Variable Source ME Level (kcal/kg) Mean CV (%) P>F
2975 3050 3125 3200 Source ME SxME FI (g) Glycer.1 1673.50 a 1720.60 a 1661.20 a 1602.50 a 1667.39 2.23 0.023 0.002 0.002 Soy Oil2 1683.80 a 1623.60 b 1604.60 b 1631.20 a 1635.80 Mean 1679.22 1672.10 1632.90 1618.44 WG (g) Glycerine. 919.25 998.00 990.80 993.25 977.44 3.91 0.133 0.059 0.168 Soy Oil 950.80 963.60 955.20 955.60 956.30 Mean 936.78 980.80 973.00 972.33 FC (g) Glycerine 1.82 1.72 1.67 1.61 1.70 3.94 0.970 0.001 0.118 Soy Oil 1.77 1.68 1.67 1.71 1.71 Mean3 1.79 1.70 1.67 1.66
Variable Source ME Level (kcal/kg) Mean CV (%) P>F 3025 3100 3175 3250 Source ME SxME FI (g) Glycer. 1664.28 1642.41 1646.22 1597.42 1637.59 3.03 0.015 0.0051 0.264 Soy oil 1667.48 1593.16 1562.00 1567.99 1597.66 Mean1 1665.89 1617.79 1604.11 1582.71 WG (g) Glycer. 786.00 794.20 859.00 857.20 824.10 5.59 0.220 0.0226 0.347 Soy oil 807.20 779.80 805.80 831.40 806.05 Mean2 796.60 787.00 832.40 844.30 FC (g) Glycer. 2.13 2.06 1.91 1.87 1.99 5.51 0.732 0.0002 0.783 Soy oil 2.06 2.04 1.94 1.88 1.98 Mean3 2.10 2.05 1.93 1.88
Variable Source ME Level (kcal/kg) Mean CV (%) P>F
3025 3100 3175 3250 Source ME SxME CY (%) Glycerine 69.64 68.89 68.78 69.23 69.13 1.28 0.116 0.662 0.276 Soy oil 69.18 69.34 69.86 70.00 69.59 Mean 69.41 69.12 69.26 69.61 BY (%) Glycerine 34.71 34.46 35.18 35.18 34.87 2.70 0.319 0.396 0.784 Soy oil 34.93 34.10 34.68 34.60 34.58 Mean 34.82 34.28 34.93 34.86 TY (%) Glycerine 15.26 15.19 14.98 15.23 15.17 3.21 0.711 0.927 0.809 Soy oil 15.19 15.11 15.29 15.31 15.22 Mean 15.22 15.15 15.15 15.27 UTY (%) Glycerine 16.64 16.96 16.67 16.66 16.73 3.30 0.096 0.617 0.910 Soy oil 16.31 16.55 16.59 16.31 16.44 Mean 16.47 16.76 16.63 16.48
same at all stages. There was no significant difference for WG or FC, (P>0.05).
No significant interaction (P>0.05) was seen between the sources of increased energy and the levels of metabolisable energy (ME) for any of the carcass or cut yield variables (Table 8). However, a linear decrease (P<0.05) in liver yield (RF) was seen for the levels of metabolisable energy from the feed as per the equation (LY = 6.77 - 0.00013ME, r2 = 0.72), with a further decrease of
0.00013g in liver weight/bird for each additional unit of ME in the feed.
Table 7 - Effect of energy levels with added glycerine or soybean oil on feed intake (FI), weight gain (WG) and feed conversion
(FC) during the 34 to 42-day stage
Mean values with the same lowercase letter in a column do not differ statistically by the SNK test (P<0.05).1Linear effect (FI = 2718 – 0.351 ME, r2 = 0.92); 2Linear effect (WG = 26.51 + 0.251 ME, r2 = 0.77);3Linear effect (FC = 5.25 – 0.001 ME, r2 = 0.96)
Moreira et al. (2001) state that in general, yield can be affected by the energy level. Research carried out with the addition of increasing levels of glycerine in the feed of broilers found no changes in liver yield (TOPAL, 2013). This effect may be related to the reduction in FI and increase in WG at this stage (Table 7), since a reduction in feed intake may reduce the heat produced by the animal (which represents the ingested metabolisable energy subtracted from the retained energy) and promote a lower metabolic load for the liver, with a consequent reduction in its relative weight.
Table 8 - Effect of energy levels with added glycerine or soybean oil on yield for carcass (CY), breast (BY), thigh (TY), upper-thigh
CONCLUSION
The metabolisable energy requirement of broilers, regardless of the source of increased energy (glycerine or soybean oil), was estimated at 3,075; 3.130; 3,200 and 3,250 kcal ME/kg feed for stages 1 to 7, 8 to 21, 22 to 33 and 34 to 42 days respectively. However, the use of glycerine as a source of increased energy resulted in better efficiency during the first two stages (1 to 7 and 8 to 21 days of age).
REFERENCES
ABDELQADER, A.; AL-FATAFTAH, A. R. Thermal acclimation of broiler birds by intermittent heat exposure. Journal of
Thermal Biology, v. 39, p. 1-5, 2014.
ABREU, V. M. N.; ABREU, P. G. Os desafios da ambiência sobre os sistemas de aves no Brasil. Revista Brasileira de Zootecnia, v. 40, p. 1-14, 2011. Suplemento especial.
ALVARENGA, R. R. et al. Use of glycerin in poultry diets.
World Poultry Science Journal, v. 68, n. 4, 2012.
BARBOSA, F. J. V. et al. Níveis de energia metabolizável em rações para frangos de corte mantidos em ambiente de alta temperatura. Revista Brasileira de Zootecnia, v. 37, n. 5, p. 849-855, 2008.
BERNARDINO, V. M. P. et. al. Metabolismo do glicerol em aves. Revista Eletrônica Nutritime, v. 10, n. 5, p. 2752–2780, set./out., 2013.
BERNARDINO, V. M. P. Fontes e níveis de glicerina para frangos de corte no período de 8 a 21 dias de idade. Revista
Brasileira de Saúde e Produção Animal, v. 15, n. 3, p.
649-658, jul./set., 2014.
Mean values with the same lowercase letter in a column do not differ statistically by the SNK test (P<0.05).1Linear effect (LY = 6.77 – 0.00013ME, r2
= 0.72)
BERTECHINI, A. A. Nutrição de monogástrico. 2. ed. Lavras: Editora UFLA, 2012. 373 p.
COSTA, J. H. S.; SARAIVA, E. P. ; SANTOS, L. F. D. Efeito do ambiente sobre indicadores fisiológicos na produção de frangos de corte. Revista Verde de Agroecologia e Desenvolvimento
Sustentável, v. 7, n. 5, p. 54-58, 2012.
DALLMANN, H. M. et al. Desempenho de frangos de corte alimentados com ingrediente de alta digestibilidade nas fases de criação pré-inicial e inicial. Pesquisa Agropecuária Brasileira, v. 45, n. 9, p. 944-951, 2010.
DOZIER, W. A.; KERR, B. J.; CORZO, A. Apparent metabolizable energy of glycerin for broiler chickens. Poultry
Science, v. 87, p. 317-322, 2008.
FELIX, A. P.; DOMINGUES, L. P.; MAIORKA, A. Manejo do arraçoamento e a regulação do consumo. In: SIMPÓSIO BRASIL SUL DE AVICULTURA, 15., 2014, Chapecó. Anais... Chapecó: Embrapa Suínos e Aves, 2014. 162 p.
GONZALES, E. Ingestão de alimentos: mecanismos regulatórios In: MACARI, M; FURLAN, L. R.; GONZALES, E. (Ed.) Fisiologia aviária aplicada a frangos de corte. 2. ed. Jaboticabal: FUNEP: UNESP, p. 187-199, 2008.
GUERRA, R. L. H. Glicerina bruta mista na alimentação de frangos de corte (1 a 42 dias). Revista Brasileira de Saúde e
Produção Animal, v. 12, n. 4, p. 1038-1050, out./dez. 2011.
MIN, Y. N. et al. Glycerin: a new energy source for poultry.
International Journal of Poultry Science, v. 9, n. 1, p. 1-4,
2010.
MOREIRA, J. et al. Efeito da densidade de criação e do nível de energia da dieta sobre o desempenho e rendimento de carcaça em frangos de corte. Revista Brasileira de Ciência Avícola, v. 3, p. 39, 2001.
NASCIMENTO, A. H. et al. Metabolizable energy and energy: protein ratio for male broiler chicks to pre-starter and starter
WY (%) Glycerine 11.67 11.75 11.59 11.51 11.63 3.48 0.619 0.716 0.964 Soy oil 11.80 11.71 11.63 11.62 11.69 Mean 11.73 11.73 11.61 11.56 AFY (%) Glycerine 2.38 3.15 3.05 2.66 2.81 16.64 0.146 0.389 0.082 Soy oil 2.67 2.42 2.65 2.64 2.60 Mean 2.52 2.79 2.85 2.65 LY (%) Glycerine 2.74 2.95 2.77 2.48 2.72 8.42 0.210 0.017 0.403 Soy oil 2.80 2.63 2.68 2.42 2.65 Mean1 2.77 2.77 2.72 2.46 HY (%) Glycerine 0.63 0.68 0.69 0.63 0.66 8.32 0.597 0.312 0.210 Soy oil 0.67 0.66 0.63 0.63 0.65 Mean 0.65 0.67 0.66 0.63 Continuation Table 8
phases. Revista Brasileira de Zootecnia, v. 33, n. 4, p. 911-918, 2004.
OLIVEIRA, M. C. et al. Mananoligossacarídeos e complexo enzimático em dietas para frangos de corte. Revista Brasileira
de Zootecnia, v. 38, n. 5, p. 879-886, 2009.
QUINTELLA, C. M. et al. Cadeia do biodiesel da bancada à indústria: uma visão geral com prospecção de tarefas e oportunidades para P&D&I. Química Nova, v. 32, n. 3, p. 793-808, 2009.
ROSTAGNO, H. S. et al. Tabelas brasileiras para aves e
suínos: composição de alimentos e exigências nutricionais. 3.
ed. Viçosa, MG: Universidade Federal de Viçosa, 2011. 252 p. ROSTAGNO, H. S. et al. Tabelas brasileiras para aves e
suínos: composição de alimentos e exigências nutricionais. 4.
ed. Viçosa, MG: Universidade Federal de Viçosa, 2017. 488 p. SAKOMURA, N. K. et al. Efeito do nível de energia metabolizável da dieta no desempenho e metabolismo energético de frangos de corte. Revista Brasileira de Zootecnia, v. 33, n. 6, p. 1758-1767, 2004. Suplemento 1.
SAS INSTITUTE. Statistical analysis system: user guide: Stat. V. 9.2. Cary, N.C., 2002.
SHINI, S. et al. Differential alterations in ultrastructural morphology of chicken heterophils and lymphocytes induced by corticosterone and lipopolysaccharide. Veterinary Immunology
and Immunopathology, v. 122, n. 1/2, p. 83-93, 2008.
SILVA, G. C. et al. Suplementação com zinco e selênio em frangos de corte submetidos a estresse cíclico de calor. Revista
Ceres, v. 62, n. 4, p. 372-378, 2015.
SUCHÝ, P. et al. Pure and raw glycerol in the diet of broiler chickens, its effect on the production parameters and slaughter value. Archiv Tierzucht, v. 54, p. 308-318, 2011.
TOPAL, E.; OZDOGAN, M. Effects of glycerol on growth performance, weight of internal organs and muscles overcook on broiler chickens. The Journal Applied Poultry Research, v. 22, n. 1, p. 146-151, 2013.
XAVIER, S. A. G. et al. Níveis de energia metabolizável em rações pré-iniciais para frangos de corte. Revista Brasileira de
Zootecnia, v. 37, n. 1, p. 109-115, 2008.