http://dx.doi.org/10.1590/1806-9061-2015-0029
Author(s)
Vasconcelos LGI
Mello HHCI
Stringhini JHI
Andrade MAI
Cysneiros CSSII
Arnhold EI
Mascarenhas AGI
Resende MQI
Xavier HPFI
I Escola de Veterinária e Zootecnia,
Universi-dade Federal de Goiás, Goiânia, Brasil
II Laboratório de Enzimologia e de Fisologia
da Digestão - Instituto de Ciências Biológi-cas - Universidade Federal de Goiás, Goiâ-nia, Brasil
Mail Address
Corresponding author e-mail address Luciana Guimarães Vasconcelos Escola de Veterinária e Zootecnia,
Universidade Federal de Goiás, Avenida Esperança, s/n, Campus Universitário, Goiânia, GO, Brasil
74690900
Phone: (62) 35211591 ramal 32 Email: [email protected]
Keywords
Alternative Feed, Immune Response, Metabolizability, Performance, Poultry.
Submitted: January/2016 Approved: October/2016
ABSTRACT
Two experiments were carried out to evaluate the effect of using soy protein concentrate (SPC) in pre-starter and starter diets for broilers. In the first experiment, 600 male Cobb broilers, between one and 40 days of age, were distributed in a completely randomized design, with four treatments and six replications of 25 birds each. Treatments were ofered to broilers in the pre-starter and starter diets and consisted of inclusion of soy protein concentrate (0,3,6 and 9%) in diets. The parameters evaluated were: body weight gain, feed conversion ratio, consumption of ration, enzyme production in the pancreas, villus: crypt ratio, leukocyte count and immunoglobulin A (IgA) dosage. Aimed to determine the coefficient of nutrient metabolization of feeds, 144 male Cobb chicks were distributed, between 14 and 21 days of age, with four treatments and six replications of six birds per experimental unit. Treatments were the same as in the first experiment. The use of 3 and 9% of SPC did not affect weight gain, feed intake, feed conversion or viability of the poultry. The use of 6% of SPC provided an increase in trypsin activity, villi length and crypt depth; the coefficient of dry matter metabolization increased linearly; but no differences were observed in performance or immunological parameters.
INTRODUCTION
Some of the most relevant anti-nutritional factors (ANF) present in soybean meal that affects the development and performance of monogastrics include α-galactosides – raffinose, stachyose and verbascose – and antigenic factors – glycinin and β-conglycinin (Nunes
et al., 2001; Jankowski et al., 2009). The presence of non-digestible glycoside substrate in the intestinal lumen involves changes in chyme viscosity, compromising the integrity of gut mucus and increasing the passage rate, reducing the efficiency of nutrient absorption (Góes & Ribeiro, 2002; Batal & Parsons, 2003). Enzymatic production and morphological structure of the digestive system of poultry, change significantly with age and frequency of feed intake (Souza et al., 2005). Allergic factors cause hypersensitivity reactions, promoting a shortening of the intestinal villus and decreasing the ratio between the villi length and crypt depth (Thomaz et al., 2011). The presence of ANF in the diets of broilers from one to 21 days of age implies a reduction in feed intake, impaired digestion and utilization of nutrients (Feng et al.,
2007; Kim et al., 2010).
verified that the average true amino acids digestibility coefficient, of essential and non essential SPC for broilers, were respectively 95,21% e and 94,22% for the soy protein concentrate. Bansemer et al. (2015) verifyed that inclusion of SPC in fish diets, decreased globet cell numbers. This suggests SPC having an effect on reducing mucus production in the intestine.
This study was carried out to evaluate the effect of soy protein concentrate inclusion in pre-starter and starter diets of broilers on: performance, enzyme production in the pancreas, gut integrity, nutrient metabolization and immunological parameters.
MATERIALS AND METHODS
Animals and housing
The experimental protocol was submitted to the Ethics Committee for Use of Animals in Research (CEUA – Universidade Federal de Goiás) and approved under number 066/12.
Seven hundred forty-four (744) one-day-old male Cobb broilers were used in the two experiments.
For experiment 1, six hundred (600) one-day-old male Cobb broilers were distributed in a completely
randomized design with four treatments (0, 3, 6 and 9% of soy protein concentrate – Table 1 e and 2), and six replications of 25 birds/experimental unit. At 22 days old, the broilers received the same diet, without soy protein concentrate (Table 3).
The birds were housed in a shed with 2.45 m headroom, inside 2.02 x 1.36 x 0.73 m boxes, provided with bed of rice husks (5 cm), tubular feeder and pendulum drinker. Environmental control consisted of heating hoods, negative ventilation system, nebulizer, side curtains, two thermometers, a moisture sealer and 23 hours of light/day. The temperature was recorded in the morning (8 a.m.) and mortality 2x/day (8 a.m. and 4 p.m.). In experiment 1 the variables studied were: body weight gain, feed intake, feed conversion ratio and viability, leukocyte count and immunoglobulin A (IgA) dosage, pancreas weight, amylase and trypsin activity, villi length and crypt depth of small intestine.
One hundred forty-four (144) male Cobb broilers, 14 to 21 days of age, were distributed in a completely randomized design with four treatments, six replications of six birds/experimental unit. Treatments consisted of four levels of inclusion of soy protein concentrate (0, 3, 6 and 9%) in the diet. This group of 144 broilers
Table 1 – Composition of experimental diets of pre-starter phase (1-7 days old)
Ingredients Soy protein concentrate (%)
0 3 6 9
Corn 55.192 57.235 59.279 61.322
Soybean meal 45% 38.215 33.690 29.164 24.639
Soy protein concentrat 0.000 3.000 6.000 9.000
Soybean oil 2.148 1.634 1.119 0.605
Dicalcium phosphate 1.907 1.920 1.933 1.947
Limestone 0.822 0.879 0.875 0.871
Salt 0.495 0.492 0.489 0.486
DL-methionine 99% 0.359 0.354 0.348 0.343
L-lysine HCl 78% 0.288 0.287 0.286 0.286
L-threonine 98% 0.114 0.110 0.107 0.103
Vitamin mineral premix 0.400 0.400 0.400 0.400
Total 100 100 100 100
Nutrient Composition
Metabolizable energy (Mcal/Kg) 2,950 2,950 2,950 2,950
Crude Protein (%) 22.20 22.20 22.20 22.20
Phosphorus avaiable (%) 0.470 0.470 0.470 0.470
Calcium (%) 0.920 0.920 0.920 0.920
Sodium (%) 0.220 0.220 0.220 0.220
Glycine + Serine digestible (%) 1.8483 1.8465 1.8447 1.8429
Isoleucine digestible (%) 0.8772 0.8782 0.8791 0.8800
Lysine digestible (%) 1.3100 1.3100 1.3100 1.3100
Methionine + cystine digestible (%) 0.9440 0.9440 0.9440 0.9440
Threonine digestible (%) 0.8520 0.8520 0.8520 0.8520
Thriptophan digestible (%) 0.2471 0.2470 0.2469 0.2468
was housed and managed under the same condition of experiment 1 and received a basal diet until 14 days of age, without soy protein concentrate, according to recommendations of Rostagno et al. (2011). At 14 days of age, the birds were housed in metabolic cages and the experimental diets were administered (Table 2). In experiment 2 the coefficients of metabolizable dry matter, crude protein, ether extract and ash were calculated. The birds were housed in metabolic cages of 0.77 x 0.74 x 0.23 m in size, fitted with trays for excreta collection, food and water trough type; in a shed 2.00 m in height, provided with heating hoods, side curtains, two thermometers and 23 hours of light/day.
The average temperatures (minimum and maximum) recorded during the experimental period were 23 and 31°C in Experiment 1; 24 and 28°C in Experiment 2, respectively.
Diets and feeding
Treatments consisted of four inclusion levels of soy protein concentrate (0, 3, 6 and 9%) in pre-starter and starter diets.
The experimental diets were nutrient and iso-energetic and were formulated according to Rostagno
et al. (2011) recommendations, and followed a feeding program divided into pre-starter phase (1-7 days of age) and starter phase (8- 21 days of age) (Tables 1 and 2). The birds received the same diet from 22 to 40 days of age (Table 3). Feed and water were provided
ad libitum.
Performance analysis
Body weight gain, feed intake, feed conversion ratio and viability of birds were calculated according to Sakomura & Rostagno (2007). Weights were taken on the 1st , 7th, 21st and 40th days of the experiment.
Data collection
For leukocyte count and immunoglobulin A (IgA) dosage, samples were obtained from two birds per replication at 21 days of age. Blood samples were collected in a tube with heparin or without anticoagulante (respectively for WBC and IgA), from the femoral vein; for serum, the samples were centrifuged at 5000 rpm for three minutes and frozen at -20° C. The total leukocyte count followed the protocol set by Natt & Herrick (1952); the specific leukocyte count was obtained as per Garcia-Navarro (2005). The serum IgA Table 2 – Composition of experimental diets of starter phase (8-21 days old)
Ingredients Soy protein concentrate (%)
0 3 6 9
Corn 59.321 61.365 63.408 65.451
Soybean meal 45% 34.722 30.197 25.671 21.146
Soy protein concentrat 0.000 3.000 6.000 9.000
Soybean oil 2.116 1.601 1.087 0.572
Dicalcium phosphate 1.508 1.521 1.535 1.548
Limestone 0.895 0.892 0.888 0.884
Salt 0.468 0.465 0.462 0.459
DL-methionine 99% 0.287 0.282 0.276 0.271
L-lysine HCl 78% 0.218 0.217 0.217 0.216
L-threonine 98% 0.064 0.060 0.057 0.053
Vitamin mineral premix 0.400 0.400 0.400 0.400
Total 100 100 100 100
Nutrient Composition
Metabolizable energy (Mcal/Kg) 3,0000 3,0000 3,0000 3,0000
Crude Protein (%) 20.8000 20.8000 20.8000 20.8000
Phosphorus avaiable (%) 0.3910 0.3910 0.3910 0.3910
Calcium (%) 0.8190 0.8190 0.8190 0.8190
Sodium (%) 0.2100 0.2100 0.2100 0.2100
Glycine + Serine digestible (%) 1.7344 1.7326 1.7308 1.7290
Isoleucine digestible (%) 0.8209 0.8218 0.8227 0.8237
Lysine digestible (%) 1.1740 1.1740 1.1740 1.1740
Methionine + cystine digestible (%) 0.8460 0.8460 0.8460 0.8460
Threonine digestible (%) 0.7630 0.7630 0.7630 0.7630
Thriptophan digestible (%) 0.2300 0.2299 0.2298 0.2297
levels were determined by immune turbidimetry (Cobas Mira Plus; Roche Diagnostic Systems, Mannheim, Germany) and using a commercial IgA kit (Turbiquest plus, Labtest®) under an absorbance wave length of
340nm.
These birds were euthanized by cervical dislocation for collection of the pancreas and small intestine.
After weighing, the pancreas was frozen in liquid nitrogen, homogenized on ice and the supernatant was extracted to measure total protein (Bradford, 1976), trypsin (Kunitz, 1947) and amylase content (CNPG amylase kit, Labtest®).
The pancreas and intestines were collected and weighing in analytical balance with three decimal places of accuracy. The pancreas was frozen in liquid nitrogen and homogenized on ice; the supernatant was extracted to measure total protein (Bradford, 1976), trypsin (Kunitz,1947) and amylase content (CNPG amylase kit, Labtest.). Enzyme assays were performed in the enzymology laboratory and Physiology of Digestion, the Institute of Biological Sciences (ICB II), Federal University of Goias.
The small intestine was cut between the proventriculus and the cecum-colic junction, and representative sample from its different anatomical
regions was collected (duodenum – bounded by the contour of the pancreas, jejunum – near the Meckel diverticulum and ileum – near the cecum-colic junction). Tissue samples were fixed in 10% neutral buffered formalin for histological processing (Macari et al., 2002), for 24 hours and then processed for paraffin embedding according to the routine protocols; 5 micron section were then stained with Harris haematoxylin and eosin, the slides mounted in Entellan. Microphotographs were collected using a magnification of 50x in a Leica DM2500 optic microscope, and retrospectively analyzed in order to obtain data corresponding to 30 readings of villus and crypts per intestinal segment.
Excreta collection
The birds were acquired from the same batch of experiment 1. By 14 days of age were managed according to the breed manual, and at 14 days of age were allocated in metabolic cages for experimental period. Both experiments occur simultaneously.
The experimental period was eight days – four days for adaptation to the cages and experimental diets, and four days to excreta collection.
The bromatological analysis of rations and excreta followed was proposed by Silva & Queiroz (2009). The coefficients of metabolizable dry matter, crude protein, ether extract and ash were calculated (Sakomura & Rostagno, 2007). Temperature was recorded in the morning (8 a.m.) and mortality 2x/day (8 a.m. and 4 p.m.).
Excreta were homogenized and a sample of 500g each replication collected and identified. Samples were pre-dried in a forced ventilation oven at 65°C for 72 hours. The air dried percentage of excreta was determined as a relation of the weight after and before drying. After this step, the samples were ground in a Wiley mill, and stored in labeled plastic bags. Analyzes of dry matter were held, nitrogen, lipids and ashes according to the methodology described in Silva & Queiroz (2009). In order to calculate the metabolizable coefficients of dry matter, crude protein, ether extract and ashes, the following equations were used:
CMDM= Dry matter intake (g) – Dry matter excreted (g)/ Dry matter intake (g) x 100
CMCP = Nitrogen intake (g) - Nitrogen excreted (g) / Nitrogen intake (g) x 100
CMEE = Ether extract intake (g) - Ether extract excreted (g) / Ether extract intake (g) x100
CM Ash% = ash intake (g) - ash excreted (g) / ash intake (g) x 100
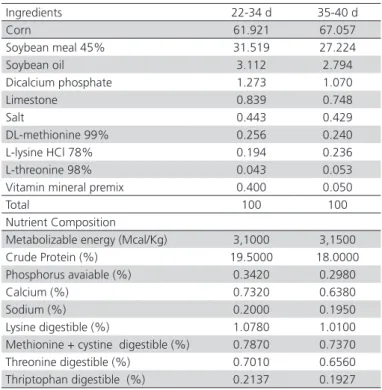
Table 3 – Composition of experimental diets of growing (22-34 days old) and finishing phase (35-40 days old)
Ingredients 22-34 d 35-40 d
Corn 61.921 67.057
Soybean meal 45% 31.519 27.224
Soybean oil 3.112 2.794
Dicalcium phosphate 1.273 1.070
Limestone 0.839 0.748
Salt 0.443 0.429
DL-methionine 99% 0.256 0.240
L-lysine HCl 78% 0.194 0.236
L-threonine 98% 0.043 0.053
Vitamin mineral premix 0.400 0.050
Total 100 100
Nutrient Composition
Metabolizable energy (Mcal/Kg) 3,1000 3,1500
Crude Protein (%) 19.5000 18.0000
Phosphorus avaiable (%) 0.3420 0.2980
Calcium (%) 0.7320 0.6380
Sodium (%) 0.2000 0.1950
Lysine digestible (%) 1.0780 1.0100
Methionine + cystine digestible (%) 0.7870 0.7370
Threonine digestible (%) 0.7010 0.6560
Thriptophan digestible (%) 0.2137 0.1927
Statistical analysis
The results were analyzed by ANOVA. Variables related to performance, gut integrity and enzymology had their means compared by the Scott-Knott test. The coefficients of metabolizability underwent polynomial regression. Hematological parameters were subjected to the Kruskal-Wallis test, with the difference between treatments assessed by Bonferroni test. We used R software (R Development Core Team, 2011). We adopted α = 0.05.
RESULTS AND DISCUSSION
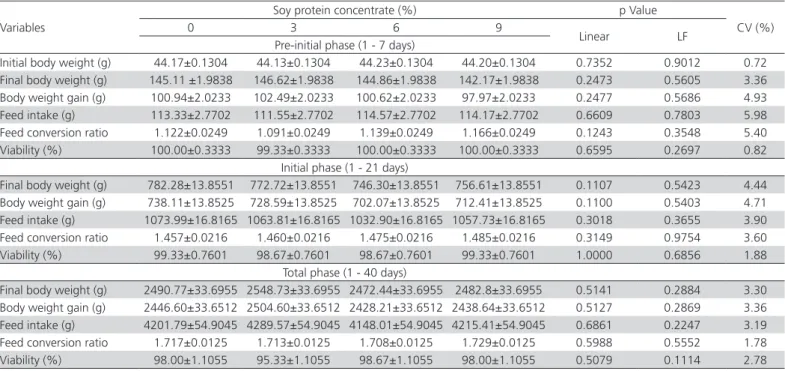
Inclusion of increased levels of SPC in pre-starter and starter diets did not affect the final body weight, body weight gain, feed intake, feed conversion ratio and viability of broilers (Table 4), suggesting that it did not influence broilers performance in any of the rearing periods surveyed (1 to 7, 1 to 21 and 1 to 40 days of age).
No effect of SPC inclusion on broiler performance in any period studied (1 to 7, 1 to 21 and 1 to 40 days of age) was observed. Reduction in anti-nutritional factors does not appear to be the determining factor for improved performance. The results disagreed with Trindade Neto et al. (2007), who reported low feed intake associated with the presence of trypsin inhibitors, and with Thomas et al. (2011) who associated
reduced growth with digestive disorders resulting from transient hypersensitivity reaction caused by glycinin and β-conglycinin allergenic proteins.
Siugzdaite et al. (2008) found significant improvements in the performance of piglets with 10% inclusion of SPC in the weaning diet; Lenehan et al.
(2007), with 14-21% inclusion of SPC; Bertol et al.
(2001) with 50% replacement of soybean meal by SPC in the nursery phase of pigs diet. These reports suggest that levels of inclusion of SPC proposed in the present study may not have been sufficient to demonstrate improvements in performance.
The inclusion of 3 to 9 % of SPC in the pre-starter and starter diets showed no decrease in pancreatic weight (Table 5), although higher activities of trypsin and amylase were recorded with the use of 3, 6 and 9% of SPC, respectively.
Li et al. (1991a and 1991b) hypothesized that the reduction in anti-nutritional factors, provided by the use of SPC, deletes their antigenic power, minimizing the transient hypersensitivity and improving growth. These reports, combined with the results obtained herein, corroborate the theory that the levels proposed in the study were not sufficient to demonstrate improvements in performance.
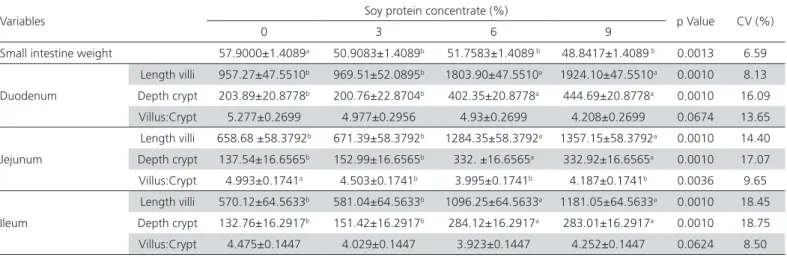
Diets without SPC resulted in increased small intestine weight and higher villus, crypt ratio in the jejunum (Table 6). The treatments with 6 and 9%
Table 4 – Performance of broilers from one to 40 days, fed increasing levels of SPC in the pre-starter and starter diets (Mean ±SEM)*
Variables
Soy protein concentrate (%) p Value
CV (%)
0 3 6 9
Linear LF
Pre-initial phase (1 - 7 days)
Initial body weight (g) 44.17±0.1304 44.13±0.1304 44.23±0.1304 44.20±0.1304 0.7352 0.9012 0.72
Final body weight (g) 145.11 ±1.9838 146.62±1.9838 144.86±1.9838 142.17±1.9838 0.2473 0.5605 3.36
Body weight gain (g) 100.94±2.0233 102.49±2.0233 100.62±2.0233 97.97±2.0233 0.2477 0.5686 4.93
Feed intake (g) 113.33±2.7702 111.55±2.7702 114.57±2.7702 114.17±2.7702 0.6609 0.7803 5.98
Feed conversion ratio 1.122±0.0249 1.091±0.0249 1.139±0.0249 1.166±0.0249 0.1243 0.3548 5.40
Viability (%) 100.00±0.3333 99.33±0.3333 100.00±0.3333 100.00±0.3333 0.6595 0.2697 0.82
Initial phase (1 - 21 days)
Final body weight (g) 782.28±13.8551 772.72±13.8551 746.30±13.8551 756.61±13.8551 0.1107 0.5423 4.44
Body weight gain (g) 738.11±13.8525 728.59±13.8525 702.07±13.8525 712.41±13.8525 0.1100 0.5403 4.71
Feed intake (g) 1073.99±16.8165 1063.81±16.8165 1032.90±16.8165 1057.73±16.8165 0.3018 0.3655 3.90
Feed conversion ratio 1.457±0.0216 1.460±0.0216 1.475±0.0216 1.485±0.0216 0.3149 0.9754 3.60
Viability (%) 99.33±0.7601 98.67±0.7601 98.67±0.7601 99.33±0.7601 1.0000 0.6856 1.88
Total phase (1 - 40 days)
Final body weight (g) 2490.77±33.6955 2548.73±33.6955 2472.44±33.6955 2482.8±33.6955 0.5141 0.2884 3.30
Body weight gain (g) 2446.60±33.6512 2504.60±33.6512 2428.21±33.6512 2438.64±33.6512 0.5127 0.2869 3.36
Feed intake (g) 4201.79±54.9045 4289.57±54.9045 4148.01±54.9045 4215.41±54.9045 0.6861 0.2247 3.19
Feed conversion ratio 1.717±0.0125 1.713±0.0125 1.708±0.0125 1.729±0.0125 0.5988 0.5552 1.78
Viability (%) 98.00±1.1055 95.33±1.1055 98.67±1.1055 98.00±1.1055 0.5079 0.1114 2.78
inclusion of SPC provided greater villi length and crypt depth in the duodenum, jejunum and ileum, indicating greater absorption area which resulted in better utilization of nutrients in the diets.
There are very few reports on the effects of glycinin and β-conglycinin on the mucous secretion and moisture in the excreta of birds, which does not make it possible to discard them as predisposing factors to inflammatory reactions observed in broilers between seven and ten days of age (Ortiz, 2009).
Cortés (2012) tested the effect of a mono competent protease on anti-nutritional factors of soybean, and a reduction in the presence of these factors was proven. A linear relationship was observed for villi length and a cubic relationship to crypt depth, with increased surface area for absorption and villus: crypt ratio at 14 days of age. This author drew attention to the fact that the reduction of the stimulus on the pancreatic secretion and increasing the absorptive surface of the intestine brought about a shift in nutrient utilization
for performance and carcass yield with lower levels of fat.
The use of 3 to 9% SPC did not affect leukocyte count and the dosage of immunoglobulin A in blood (Table 7). Based on these results, it can be inferred that the reduction of allergenic dietary factors was not enough, which explains the lack of difference in performance and in pancreatic weight, despite increased CMDM.
In Brazil there is paucity of data on reference levels for hematological and biochemical values in broiler chickens, showing the importance of studies that include such evaluations in several experimental situations (Minafra, 2010). Furthermore, the method commonly used, immune histochemistry, enables the determination of dimeric IgA and observation of leukocytes in slide, contributing to greater accuracy in the discussion about the relevance of antigenic factors in catabolic processes associated with the immune response.
Table 5 – Weight and enzymology of the pancreas of broilers at 21 days of age, fed increasing levels of soy protein concentrate in the pre-starter and starter diets (Mean ±SEM)
Variables Soy protein concentrate (%) p Value CV (%)
0 3 6 9
Weight of pancreas (g) 2.467±0.1249 2.358±0.1249 2.433±0.1249 2.567±0.1249 0.7006 12.46
Total protein (mg/mL) 2830.08±381.978 4049.37±381.978 3908.64±381.978 3630.86±381.978 0.1413 25.96
Trypsin activity (UT/g)* 5.74 ±0.4705b 8.27±0.4705a 8.32±0.4705a 6.31±0.4705b 0.0011 16.09
Amylase activity (mg/mL)* 6110.68 ±1304.987b 8457.77±1304.987b 4405.95±1304.98b 13489.61±1304.987a 0.0061 39.39
*Different letters in the line indicate differences between treatments by the Scott-Knott test. UT = trypsin units; CV = coefficient of variation.
*mean of 6 replicates, with 2 broilers/replicate. SEM = standard error of mean
Table 6 – Weight and intestinal histomorphometry of broilers from 21 days of age, fed increasing levels of soy protein concentrate in the pre-starter and starter diets (Mean ±SEM)
Variables Soy protein concentrate (%) p Value CV (%)
0 3 6 9
Small intestine weight 57.9000±1.4089a 50.9083±1.4089b 51.7583±1.4089 b 48.8417±1.4089 b 0.0013 6.59
Duodenum
Length villi 957.27±47.5510b 969.51±52.0895b 1803.90±47.5510a 1924.10±47.5510a 0.0010 8.13
Depth crypt 203.89±20.8778b 200.76±22.8704b 402.35±20.8778a 444.69±20.8778a 0.0010 16.09
Villus:Crypt 5.277±0.2699 4.977±0.2956 4.93±0.2699 4.208±0.2699 0.0674 13.65
Jejunum
Length villi 658.68 ±58.3792b 671.39±58.3792b 1284.35±58.3792a 1357.15±58.3792a 0.0010 14.40
Depth crypt 137.54±16.6565b 152.99±16.6565b 332. ±16.6565a 332.92±16.6565a 0.0010 17.07
Villus:Crypt 4.993±0.1741a 4.503±0.1741b 3.995±0.1741b 4.187±0.1741b 0.0036 9.65
Ileum
Length villi 570.12±64.5633b 581.04±64.5633b 1096.25±64.5633a 1181.05±64.5633a 0.0010 18.45
Depth crypt 132.76±16.2917b 151.42±16.2917b 284.12±16.2917a 283.01±16.2917a 0.0010 18.75
Villus:Crypt 4.475±0.1447 4.029±0.1447 3.923±0.1447 4.252±0.1447 0.0624 8.50
*Different letters in the line indicate differences between treatments. CV = coefficient of variation.
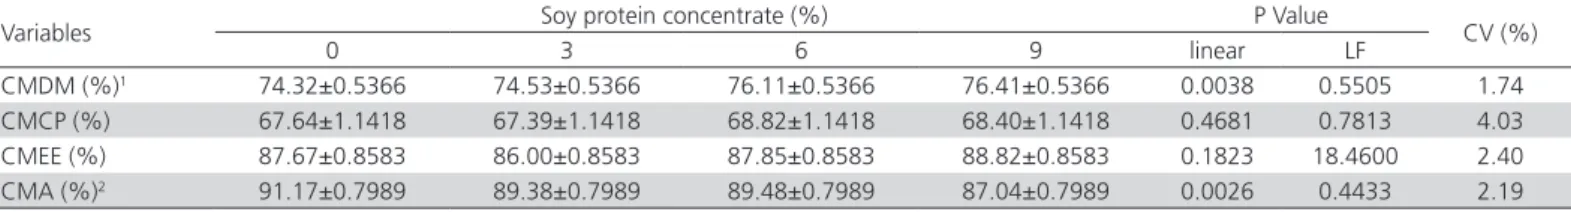
In the present study the coefficient of metabolization of dry matter increased linearly and the coefficient of metabolization of ash decreased linearly according to higher SPC inclusion in diets (Table 8). According to Batal & Parsons (2003), the increase in the use of nutrients in SPC is due to the removal of soluble non-starch oligosaccharides.
Soluble non-starch oligosaccharides negatively in-terfere with the absorption of minerals (Arruda, 2003). Although SPC has a higher concentration of minerals due to processing (Miranda, 2012), the metabolization of nutrients decrease in the content of α-galactosides, the excretion of minerals (Fischer et al., 2002) causing CMA increase - contradicting the results.
The coefficients of metabolization of crude protein and ether extract were not affected by using SPC. Pinheiro et al. (2008), comparing the metabolization of different soybean subproducts also found no significant differences for the CMCP and CMEE diets low in fiber. Methods that allow the exclusion of nitrogen from uric acid in the calculation of the CMCP and to enable inclusion of the percentage of complex lost minerals with organic matter in the calculation of CMA, contribute to a greater accuracy in the analysis of results.
In conclusion, the inclusion of 6% of soy protein concentrate increased trypsin activity, the villi length and crypt depth in the small intestine, suggesting an improvement in the process of digestion and nutrient absorption, yet insufficient to show an increase in performance parameters. Similar to what occurs with other species (pigs, cattle and fish), studies using SPC for broilers from one to 21 days of age should be encouraged. The use of soy protein concentrate does not affect broiler performance and can be used in pre-starter and pre-starter diets until 9%.
ACKNOWLEDGEMENTS
The authors thanks to the Coordination for the Improvement of Higher Education Personnel (CAPES) for the grant; company São Salvador Alimentos S/A for donating the post-hatching broilers and Selecta for donating de soy protein concentrate.
REFERENCES
Arruda AMV, Pereira ES, Mizubuti IY, Silva LDF. Importância da fibra na nutrição de coelhos. Semina 2003;24:181-190.
Bansemer, MS, Forder REA, Howarth GS, Suitor, GM, Bowyer, J, Stone DAJ. The effect of dietary sobean meal and soy protein concentrate
Table 7 – Leukocyte count (total and specific) and dosage of immunoglobulin A in broilers at 21 days of age, fed increasing levels of Soy protein concentrate in the pre-starter and starter diets (Mean ±SEM)
Variables Soy protein concentrate (%) p Value CV (%)
0 3 6 9
Total leukocyte 9891.67±665.9135 (9725.00)
8510.00±729.4716 (8950.00)
8441.67±665.9135 (8962.50)
8962.50±665.9135
(8625.00) 0.6949 18.18
Eosinophils 0.92±0.3241
(0.50)
0.30±0.3551 (0.33)
0.4±0.32412 (0.25)
0.39±0.3241
(0.17) 0.8553 154.31
Lymphocytes 52.37±6.8496
(57.33)
47.03±7.5034 (45.25)
47.67±6.8496 (55.25)
43.50±6.8496
(45.00) 0.5929 35.37
IgA dosage 20.49±2.547
(20.52)
16.39±2.547 (16.68)
14.70±2.547 (14.02)
13.24±2.547
(13.80) 0.3865 38.49
*Values in parentheses represent the median CV = coefficient of variation.
SEM = standard error of mean
Table 8 – Coefficients of metabolization of dry matter, crude protein, ether extract and ash of the experimental diets (Mean ±SEM)
Variables Soy protein concentrate (%) P Value CV (%)
0 3 6 9 linear LF
CMDM (%)1 74.32±0.5366 74.53±0.5366 76.11±0.5366 76.41±0.5366 0.0038 0.5505 1.74
CMCP (%) 67.64±1.1418 67.39±1.1418 68.82±1.1418 68.40±1.1418 0.4681 0.7813 4.03
CMEE (%) 87.67±0.8583 86.00±0.8583 87.85±0.8583 88.82±0.8583 0.1823 18.4600 2.40
CMA (%)2 91.17±0.7989 89.38±0.7989 89.48±0.7989 87.04±0.7989 0.0026 0.4433 2.19
1y = 74.1640 + 0.0262x (R2 = 0.89); 2y = 91.1139 – 0.0409x (R2 = 0.86).
LF = lack of fit; CV = coefficient of variation, CMDM = Coefficients of metabolization of dry matter, CMCP = Coefficients of metabolization of crude protein, CMEE = Coefficients of metabolization ether extract, CMA= Coefficients of metabolization of ash.
on the intestinal mucus layer and development of subacute enteritis in Yellowtail Kingfish (Seriola lalandi) at suboptimal water temperature. Aquaculture Nutrition 2015;21:300-310.
Batal AB, Parsons CM. Utilization of different soy products as affected by age in chicks. Poultry Science 2003;82:454–462.
Bertol TM, Mores N, Ludke JV, Franke RM. Proteínas da soja processadas de diferentes modos em dietas para desmame de leitões. Revista Brasileira de Zootecnia 2001;30:150-157.
Bradford MM. A rapid and sensitive method for the quantitation of microgram quantities of protein utilizing the principle of protein-dye binding. Analytical Biochemistry 1976;7:248-254.
Cortés MEM. Efeitos de uma protease monocompetente em dietas de frangos de corte com níveis crescentes de inibidores de tripsina [tese]. Porto Alegre (RS): Universidade Federal do Rio Grande do Sul; 2012.
Feng J, Liu X, Xu ZR, Lu YP, Liu YY. Effect of fermented soybean meal on intestinal morphology and digestive enzyme activities in weaned piglets. Digestive Diseases and Sciences 2007;52:1845-1850.
Fischer G, Maier JC, Rutz F., Bermudez VL. Desempenho de frangos de corte alimentados com dietas a base de milho e farelo de soja, com ou sem adição de enzimas. Revista Brasileira de Zootecnia 2002;31:402-410.
Garcia-Navarro CEK. Leucócitos. In: Garcia-Navarro CEK. Manual de hematologia veterinária. São Paulo: Livraria Varela; 2005. p.55-78.
Jankowski J, Juskiewicz J, Gulewicz K, Lecewicz A, Slominski BA, Zdunczyk Z.. The effect of diets containing soybean meal, soybean protein concentrate, and soybean protein isolate of different oligosaccharide content on growth performance and gut function of young turkeys. Poultry Science 2009;88:2132-2140.
Kim SW, Van Heugten E, Ji F, Lee CH, Mateo RD. Fermented soybean meal as a vegetable protein source of nursery pigs. I. Effects on growth performance of nursery pigs. Journal of Animal Science 2010;88:214-224.
Kunitz, M. Crystalline soybean trypsin inhibitor. I General properties. The Journal of General Physiology 1947;30:291-310.
Lenehan NA, Derouchey JM, Goodband RD, Tokach MD, Dritz SS, Nelssen JL, et al. Evaluation of soy protein concentrates in nursery pig diets. Journal of Animal Science 2007;85:3013-3021.
Li DF, Nelssen JL, Reddy PG, Blecha F, Klemm RD, Giesting DW, et al. Measuring suitability of soy bean products for early-weaned pigs with immunological criteria. Journal of Animal Science 1991a;69:3299-3307.
Li DF, Nelssen JL, Reddy PG. Interrelationship between hypersensitivity to soybean proteins and growth performance in early-weaned pig. Journal of Animal Science 1991b;69:4062-4069.
Luna GL. Processing of tissue: dehydrating, clearing, impregnating and embedding. In: Luna GL. Manual of histologic staining methods of the armed forces institute of pathology. New York: Mcgraw-Hill; 1968. p.12-16.
Minafra CS, Marques SFF, Stringhini JH, Ulhoa CJ, Resende CSM, Santos JS, et al. Perfil bioquímico do soro de frangos de corte alimentados com dieta suplementada com alfa-amilase de cryptococcus flavus e aspergillus niger. Revista Brasileira de Zootecnia 2010;39:2691-2696
Miranda LC. Obtenção e caracterização de hidrolizados enzimáticos de proteínas do farelo de soja [tese]. São Carlos (SP): Universidade Federal de São Carlos; 2012.
Nat MP, Herrick CA. A new blood diluent for counting the erythrocytes and leukocytes of the chicken. Poultry Science 1952;31:735-738.
Nunes RV, Buteri CB, Nunes CGV, Albino LFT, Rostagno HS. Fatores antinutricionais dos ingredientes destinados à alimentação animal. Anais do Simpósio Sobre Ingredientes na Alimentação Animal; 2001; Campinas, São Paulo. Brasil: Colégio Brasileiro de Nutrição Animal; 2001. p.235-272.
Ortiz A. Implicaciones de la utilización de altos niveles de soja em avicultura. Anais do 46º Symposium Científico de Avicultura; 2009 Sept 30 - Oct 2; Zaragoza. Espanha: World Poultry Science Association; 2009. p.81-94.
Pinheiro CC, Rego JCC, Ramos TA, Silva BKR, Warpechowski MP. Digestibilidade dos nutrientes e desempenho de frangos de corte consumindo dietas formuladas com diferentes níveis de fibra e suplementadas com enzimas exógenas. Ciência Animal Brasileira 2008;9:984-996.
R Development Core Team. R: a language and environment for statistical computing. Vienna: R Foundation for Statistical Computing; 2001. Available from: http://www.R-project.org/.
Rostagno HS, Albino LFT, Donzele JL, Gomes PC, Oliveira RFM, Lopes DC, et al. Tabelas brasileiras para aves e suínos – Composição de alimentos e exigências nutricionais. Viçosa: Editora UVF; 2011. p.252.
Sakomura NK, Rostagno HS. Métodos de pesquisa em nutrição de monogástricos. Jaboticabal: Funep; 2007. 283p.
Scottá BA, Albino LF, Rostagno HS , Gomide APC, Campos PF, Vieira RA, et al. Coeficiente de digestibilidade e conteúdo de aminoácidos digestíveis em alimentos proteicos para frangos de corte. Revista Brasileira de Agropecuária Sustentável 2013;3:151-157.
Silva JD, Queiroz AC. Análise de alimentos - métodos químicos e biológicos. Viçosa: Editora UFV; 2009. p.235.
Siugzdaite J, Jeresiunas A, Stankevicius R, Kulpys J. Efficiency of soy protein concentrate in diets of weaned piglets. Czech Journal Animal Science 2008;53:9-16.
Souza AVC, Rostagno HS, Dionizio MA. Fundamentos técnicos para utilização de dietas pré-iniciais para frangos de corte. Anais do 1º Fórum Internacional de Avicultura; 2005;Foz do Iguaçu; Paraná. Brasil. Campinas: Editora Animal World; 2005. p.207-228.
Thomaz MC, Silveira AC, Kronka RN, Nakaghi LSO, Budiño FEL. Fontes proteicas e idades de abate sobre a estrutura e ultraestrutura do intestino delgado de leitões desmamados. Brazilian Journal of Veterinary Research and Animal Science 2011;48:408-418.
Trindade Neto MA, Berto DA, Miguel WC, Soto WC. Manejo alimentício de lechones desmamados em idade antecipada. Archivos Latinoamericano Production Animal 2007;15:158-170.