ISSN 0102-261X www.scielo.br/rbg
CHARACTERIZATION OF MEDIUM-SCALE TRAVELING IONOSPHERIC DISTURBANCES
IN THE BRAZILIAN LOW LATITUDE SECTOR – STATISTICAL ANALYSIS
OF ALL-SKY IMAGES OF OI 630 NM AIRGLOW EMISSION
Danielle Cristina de Morais Amorim, Alexandre Alvares Pimenta and Aline Amorim de Almeida
Recebido em 15 marc¸o, 2011 / Aceito em 22 marc¸o, 2012 Received on March 15, 2011 / Accepted on March 22, 2012
ABSTRACT.In order to characterize the phenomenon known as Medium-Scale Traveling Ionospheric Disturbances (MSTIDs), we present in this paper the results obtained from the statistical analysis of 10.5 years all-sky images of OI 630 nm airglow emission over the Brazilian low latitude sector. The images, which were obtained by an all-sky imager installed at Cachoeira Paulista (22.7◦S, 45◦W), show dark band structures propagating from southeast to northwest with velocities of 50-200 m/s.
Our results show the greatest occurrence of MSTIDs during solar minimum and a minor occurrence rate during descending and ascending solar activity periods. During solar maximum activity we have not detected MSTIDs signatures on all-sky images. In relation to seasonality, the greatest frequency of occurrence is during local winter. All detected events have occurred during geomagnetically quiet conditions (Kp<3). Possible mechanisms of generation of this phenomenon are discussed.
Keywords: MSTIDs, airglow, Perkins instability.
RESUMO.Com o intuito de caracterizar o fenˆomeno conhecido como Dist´urbios Ionosf´ericos Propagantes de M´edia Escala (MSTIDs), apresentamos, neste artigo, os resultados obtidos a partir da an´alise estat´ıstica de um conjunto de 10,5 anos de imagensall-skyda linha de emiss˜ao OI 630 nm sobre o setor brasileiro de baixas latitudes. O referido fenˆomeno se manifesta atrav´es de bandas escuras que atravessam o campo de vis˜ao do imageadorall-sky, instalado em Cachoeira Paulista (22,7◦S,
45◦O), propagando-se de sudeste para noroeste em velocidades de aproximadamente 50-200 m/s. Nossos resultados mostram maior frequˆencia de ocorrˆencia durante
o per´ıodo de m´ınima atividade solar, seguido por per´ıodos de atividade solar descendente e ascendente. N˜ao detectamos nenhum evento de MSTID durante o per´ıodo de m´axima atividade solar. Quanto `a sazonalidade, a maior frequˆencia de ocorrˆencia se concentra nos meses de inverno. Uma caracter´ıstica comum a todos os eventos observados ´e a ocorrˆencia em noites geomagneticamente calmas (Kp<3). Poss´ıveis mecanismos de gerac¸˜ao desse fenˆomeno s˜ao discutidos.
Palavras-chave: MSTIDs, luminescˆencia atmosf´erica, instabilidade Perkins.
Instituto Nacional de Pesquisas Espaciais (INPE), Av. dos Astronautas, 1758, Jd. da Granja, 12227-010 S˜ao Jos´e dos Campos, SP, Brazil. Phone: +55(12) 3208-6958; Fax: +55(12) 3208-6990 – E-mails: danielle@laser.inpe.br, pimenta@laser.inpe.br, aline.a.almeida@hotmail.com
INTRODUCTION
Since the 1950s, traveling disturbances in the ionospheric plasma have been observed. They are called Traveling Ionospheric Disturbances (TIDs). Based on the works of Hines (1960) and Hooke (1968), it was postulated that gravity waves traveling in the neutral atmosphere caused the TIDs.
Hunsucker (1982) classifies the TIDs into Large-Scale Trav-eling Ionospheric Disturbances (LSTIDs) and Medium-Scale Traveling Ionospheric Disturbances (MSTIDs). LSTIDs show periods from 30 minutes to 3 hours and they have a 1000 km or higher wavelength. The horizontal velocities vary from 400 to 1000 m/s. Their possible source mechanisms are magnetic storms at the polar regions and the propagation direction is from the poles towards the equator. MSTIDs show estimated periods from 15 minutes to nearly 1 hour and the wavelength has many hundreds of kilometers. With horizontal velocities between 100 and 250 m/s, they are possibly generated by the propagation of gravity waves. When gravity waves reach the lower ionosphere they produce oscillations due to the collision between neutral and ionized particles.
TIDs can be observed through data obtained with different instruments: scatter radars (Kelley & Fukao, 1991; Kelley et al., 2000), digital ionosondes (Abdu et al., 1982; Bowman, 1990, 1992; Klausner et al., 2009; de Abreu et al., 2010), optical im-agers (Mendillo et al., 1997; Garcia et al., 2000; Candido, 2008; Pimenta et al., 2008a,b). Measurements of optical imaging of OI 630 nm airglow emission have been recently used to observe MSTIDs at medium and low latitudes (Mendillo et al., 1997; Gar-cia et al., 2000; Shiokawa et al., 2003; Martinis et al., 2006, 2010; Candido, 2008; Pimenta et al., 2008a,b; Amorim, 2010; Amorim et al., 2011; Candido et al., 2011). The OI 630 nm airglow emis-sion has a layer on the base of the ionospheric F layer (∼220-300 km) and this allows measuring the phenomena caused by ionospheric plasma irregularities in this region.
In the Brazilian low latitude sector, MSTIDs are seen on all-sky images of OI 630 nm airglow emission as low intensity air-glow band structures that propagate from southeast to northwest, passing through the field of view of the imager, with velocities between 50 and 200 m/s (Pimenta et al., 2008a, b; Amorim, 2010). Statistical studies about the occurrence of MSTIDs show an inverse dependence with the solar cycle and the greatest occur-rence happens during solar minimum activity periods. In relation to seasonality, the greatest occurrence has been detected during summer solstice for the northern hemisphere and during win-ter solstice for the southern hemisphere. In the Japanese sec-tor, Shiokawa et al. (2003) carried out a statistical analysis of the occurrence of MSTIDs at two stations, Rikubetsu (43.5◦N,
34.8◦MLAT) and Shigaraki (34.9◦N, 25.4◦MLAT), from October
1998 to September 2000. The results show a greater occurrence of MSTIDs during solstice periods, with a peak in the summer solstice. At Arecibo, Garcia et al. (2000) presented a statisti-cal analysis related to the period from January 1997 to March 1998, which shows a greater occurrence during local winter. Mar-tinis et al. (2010) present a study about Arecibo region too, based on a 942 night analysis carried out from 2002 to 2007. The re-sults show a semiannual pattern with occurrence peaks of MSTIDs on both solstices. Pimenta et al. (2008b) presented a statisti-cal study of 5 year data about the occurrence of MSTIDs in the Brazilian low latitude sector. The results show a greater occur-rence during minimum solar activity, with no occuroccur-rence during maximum solar activity. Candido (2008), based on an analysis of 28 events occurred during 7 years, also observed in Cachoeira Paulista an inverse dependence with the solar cycle of the oc-currence of MSTIDs and a seasonal behavior, with a peak during local winter.
In this work, we present the results obtained from an extensive study based on an all-sky image analysis. The images have been taken during 10.5 years and they cover all phases of the solar cy-cle. This large set of data allowed the investigation of the behavior of MSTIDs in relation to the solar cycle and seasonality.
METHODOLOGY
Two all-sky imagers produced all-sky images we used in this work. They operated during different periods and they were in-stalled at Cachoeira Paulista (22.7◦S, 45◦W). The imager is an
instrument designed to measure airglow emissions in different spectral ranges through optical interference filters. The instrument detects intensity variations of the airglow layers and records them in images. These images can be used to observe the atmosphere behavior at different altitudes and to follow the occurrence and development of eventual ionospheric phenomena. In our study, we used the OI 630 nm emission. The altitude of the emission layer is approximately 220-300 km.
The OI 630 nm emission is generated by the dissociative recombination of the O+
2 molecular ion. This generation
mech-anism occurs in two steps. The first step (O++ O2→ O+ 2 +O)
is the ionization process of the molecular oxygen (O2) through a charge exchange reaction. The second step (O+
2 + e → O +
O∗(1D)) is the dissociative recombination of the O+
2 ion, which
results in an excited state oxygen atom (1D). When it sponta-neously jumps down to the ground state (3P), the amount in
excess of energy is converted to radiation with a 630 nm wavelength.
The used images refer to the following periods: from Jan-uary to December 1990 (maximum solar activity, F10.7 cm average solar flux >180.10−22 Wm−2Hz−1), from May 1995
to July 1996 (minimum solar activity, F10.7 cm average solar flux <70.10−22 Wm−2Hz−1), from January 1997 to
Decem-ber 2000 (ascending solar activity, F10.7 cm average solar flux between 70.10−22 Wm−2Hz−1 and 170.10−22 Wm−2Hz−1),
from July 2004 to December 2007 (descending solar activity, F10.7 cm average solar flux between 90.10−22Wm−2Hz−1and
160.10−22 Wm−2Hz−1) and from January to December 2008,
F10.7 cm average solar flux <70.10−22Wm−2Hz−1). Our total
observation period results in 4576 hours and among them 503 show the occurrence of MSTIDs.
For the period between 1990 and 2000, the used images were obtained by an imager with a conventional camera. It operated at Cachoeira Paulista between 1987 and 2000. This equipment uses a 10 cm diameter interference filter with a bandwidth
of 1.35 nm and records intensified monochromatic images on 35 mm films. The image capture is carried out with time interval of 20 minutes and 40 seconds for exposure time. For the period between 2004 and 2008, we used digital images obtained using an all-sky imager with a CCD camera, which provides a better resolution. Further details about the instruments can be found in Garcia et al. (1997) and Pimenta et al. (2004, 2008a).
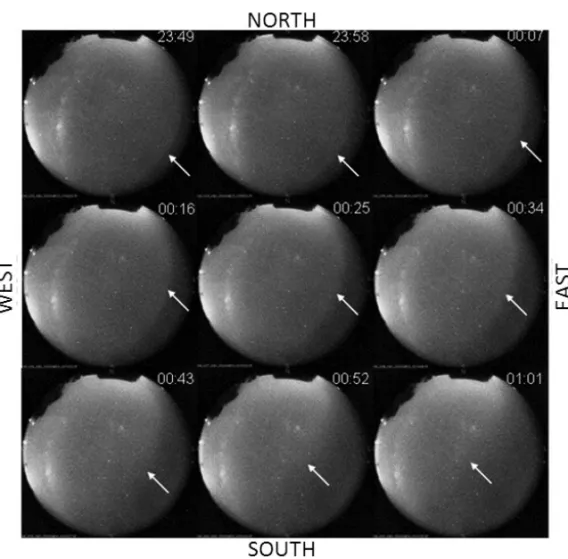
Figure 1 shows an all-sky image sequence of the OI 630 nm emission obtained during the night of August 23-24, 2006, be-tween 23:49 LT and 01:01 LT (Local Time), in geomagnetically quiet conditions (Kp<3). From the second image, it is possible to see a dark band structure that crosses the field of view of the imager northwestward, passing over the zenith around 01:00 LT.
To get information about the phase velocity and the azimuth angle of the observed structures, the images need to have a lin-earization process, which is performed through a routine using the IDL (Interactive Data Language) application. The linearization
Figure 1 – All-sky images of the OI 630 nm airglow emission obtained on August 23-24, 2006, showing MSTIDs
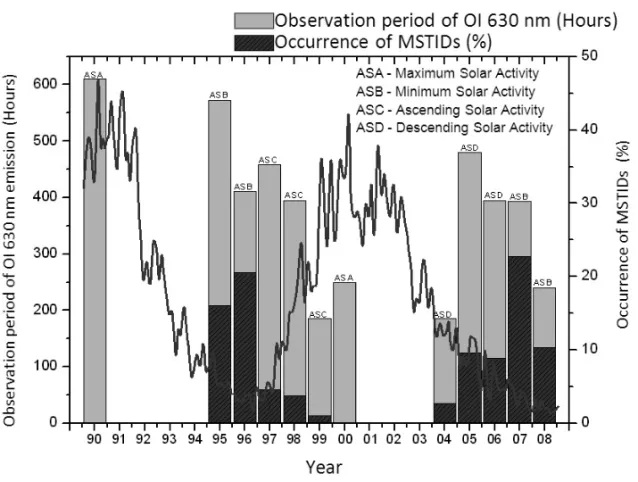
Figure 2 – Occurrence rate of MSTIDs depending on the solar cycle.
process is important to remove compression and image curvature effects, due to the all-sky lens. For details about the linearization process, see Garcia et al. (1997) and Pimenta et al. (2008a). RESULTS
Figure 2 shows a chart illustrating the frequency of occurrence of MSTIDs through all phases of the solar cycle. This chart was created considering the counting of the occurrence hours of the phenomenon during the observed nights throughout the years. The frequency of occurrence is displayed in percentage in rela-tion to the amount of hours observed during the corresponding year. The blue curve refers to the number of sunspots over the years and it was added to the chart to illustrate the solar cycle phases corresponding to the observed periods. It is clear that the frequency of occurrence of MSTIDs is anti-correlated with the solar activity, that is, the maximum occurrence is during minimum solar activity, followed by the descending and ascending solar activity periods. No MSTID events were recorded in all-sky im-ages during maximum solar activity period.
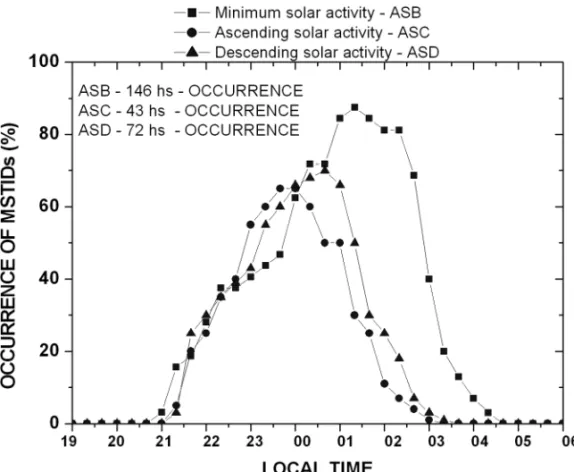
Figure 3 illustrates the nighttime variation of the occurrence of MSTIDs, which also varies with the solar activity. The chart shows the percentage of dark bands that passed over the zenith of Cachoeira Paulista for each time in relation to the solar cy-cle. The interval for the phenomenon occurrence takes place
tween 21:00 LT and 05:00 LT, during solar minimum and, be-tween 21:00 LT and 03:00 LT, during the ascending and descend-ing phases of the solar cycle. Durdescend-ing solar minimum, the max-imum occurrence takes place around 01:00 LT–02:00 LT. In the descending solar activity period, the maximum occurrence takes place around 00:30 LT, while in the ascending solar activity pe-riod, the maximum occurrence takes place between 23:00 LT and 00:00 LT. Taking this information into account, we can conclude that the lifetime of MSTIDs is higher during solar minimum.
Figure 4 illustrates the monthly variation of the occurrence of MSTIDs. The greatest occurrence happens between April and August. During the solar minimum and ascending solar activity periods, there is a small monthly variation between September and March, but this does not happen for the descending solar activity period. The maximum occurrence, in all phases of the solar cycle, concentrates in the months close to June solstice.
DISCUSSION
The analysis of the all-sky images shows a higher occurrence of MSTIDs during minimum solar activity, a lower percentage dur-ing ascenddur-ing and descenddur-ing phases and no occurrence durdur-ing solar maximum. There is an explanation for the inverse depen-dence with the solar cycle based on the Perkins instability theory (Perkins, 1973).
Figure 3 – Nighttime occurrence rate of dark bands, as a function of local time and solar cycle.
Perkins (1973) created a model to explain the plasma in-stability at mid-latitudes. According to Perkins’ model, there is no gravity effect on the nighttime ionosphere at mid-latitudes, in the northern hemisphere, due to an eastward component of the electric field or a southward component of the neutral wind. If an effect occurs, then a disturbance will arise. This disturbance can diminish or develop with a linear growth rate, which inversely depends on the frequency of the collision between neutral ions and particles. The growth rate of the Perkins instability is higher at high altitudes and during minimum solar activity (for reference see Fig. 2 of Kelley & Fukao, 1991).
When the Perkins’ theory is compared to experimental data, it presents two discrepancies. The first is related to the growth rate, which provides very low values in comparison with the large observed structures. Thus, it is considered that the instability is generated by an initial perturbation. The second discrepancy is related to the propagation direction of the bands of low density. The observations show structures propagating southwestward in the northern hemisphere and northwestward in the southern hemisphere, whereas Perkins’ calculations indicate propagation northeastward in the northern hemisphere and southeastward in the southern hemisphere. To solve this discrepancy, Kelley & Makela (2001) propose a polarization of the structures in the di-rection parallel to its longitudinal axis. The electric field, resulting from a low Pedersen conductivity region, causes the southwest-ward (northwest) observed motion. Besides the pointed out dis-crepancies, Perkins’ model is still the most accepted one, since it correctly foresees the structure inclination (∼20◦) in relation to
the magnetic meridian.
In respect of seasonality, we observed a peak of occurrence during winter. As all cases of the observed MSTIDs occurred during geomagnetically quiet periods, it is possible that gravity waves from lower and middle atmosphere act as a “trigger” in the generation of the Perkins instability. Another possible expla-nation is based on the electric field mapping between conjugate hemispheres. Observations carried out over geomagnetic conju-gate points (Otsuka et al., 2004) showed mirrored structures at both hemispheres, suggesting the important role the polarization of electric field plays in the generation of MSTIDs.
CONCLUSIONS
In this study with all-sky images, we used a large data set that covers all phases of the solar cycle. Based on our observations in relation to the propagation direction and its inclination with the magnetic meridian, around 20◦westward, we believe these
dark bands were generated at mid-latitudes in the southern hemi-sphere, by the process of Perkins instability.
The main characteristics of the MSTIDs observed with the Cachoeira Paulista imager can be summarized:
1) Its preferential alignment from southeast to northwest and its northwestward propagation direction, in an altitude range between 220-300 km.
2) The greatest occurrence rate happens during minimum solar activity, while during solar maximum no MSTID optical signature was detected.
3) The seasonal variation indicates higher occurrence of MSTIDs during the local winter months.
4) All cases were observed during geomagnetically quiet nights, suggesting a coupling with the lower atmosphere.
ACKNOWLEDGEMENTS
The authors are grateful to Dr. Yogeshwar Sahai, Dr. Michael Mendillo and to the Laborat´orio de Luminescˆencia Atmosf´erica – LUME research line for providing the data obtained by the all-sky imager at Cachoeira Paulista. The authors are also grate-ful to Conselho Nacional de Desenvolvimento Cient´ıfico e Tec-nol´ogico – CNPq, process 471908/2009-6, and to Fundac¸˜ao de Amparo `a Pesquisa do Estado de S˜ao Paulo – FAPESP, process 2008/50553-8.
REFERENCES
ABDU MA, BATISTA IS, KANTOR IJ & SOBRAL JHA. 1982. Gravity wave induced ionization layers in the nightF -region over Cachoeira Paulista (22◦S, 45◦W). J. Atmos. Sol. Terr. Phys., 44(9): 759–767.
AMORIM DCM. 2010. Caracterizac¸˜ao de dist´urbios ionosf´ericos propa-gantes na regi˜ao de baixas latitudes, no setor brasileiro, associado `a ins-tabilidade de plasma Perkins gerada em m´edias latitudes. (INPE 16667 – TDI/1620). Master dissertation on Spatial Geophysics, INPE, S˜ao Jos´e dos Campos. 132 pp.
AMORIM DCM, PIMENTA AA, BITTENCOURT JA & FAGUNDES PR. 2011. Long-term study of medium-scale traveling ionospheric disturbances using OI 630 nm all-sky imaging and ionosonde over Brazilian low latitudes. J. Geophys. Res., 116: A06312, doi: 10.1029/2010JA016090.
BOWMAN GG. 1990. A review of some recent work on mid-latitude spread-F occurrence as detected by ionosondes. Journal of Geomag-netism and Geoelectricity, 42: 109–138.
BOWMAN GG. 1992. Upper atmosphere neutral-particle density varia-tions compared with spread-F occurrence rates at locavaria-tions around the world. Annales Geophysicae, 10: 676–682.
CANDIDO CMN. 2008. Estudos de irregularidades do plasma ionosf´erico equatorial e de baixas latitudes observadas no setor brasileiro. (INPE 15246 – TDI/1333). Doctorate thesis on Spatial Geophysics, INPE, S˜ao Jos´e dos Campos. 286 pp.
CANDIDO CMN, BATISTA IS, BECKER-GUEDES F, ABDU MA, SOBRAL JHA & TAKAHASHI H. 2011. Spread F occurrence over a southern anomaly crest location in Brazil during June solstice of solar minimum activity. J. Geophys. Res., 116: A06316, doi: 10.1029/2010JA016374. DE ABREU AJ, FAGUNDES PR, SAHAI Y, JESUS R, BITTENCOURT JA, BRUNINI C, GENDE M, PILLAT VG, LIMA WLC, ABALDE JR & PIMENTA AA. 2010. Hemispheric asymmetries in the ionospheric response ob-served in the American sector during an intense geomagnetic storm. J. Geophys. Res., 115: A12312, doi: 10.1029/2010JA015661.
GARCIA FJ, TAYLOR MJ & KELLEY MC. 1997. Two-dimensional spectral analysis of mesospheric airglow image data. Appl. Opt., 36(8): 7374– 7385.
GARCIA FJ, KELLEY MC, MAKELA JJ & HUANG C-S. 2000. Airglow observations of mesoscale low-velocity traveling ionospheric distur-bances at midilatitudes. J. Geophys. Res., 105(A8): 18,407–18,415. HINES CO. 1960. Internal atmospheric gravity waves at ionospheric heights. Can. J. Phys., 38(11): 1441–1481.
HOOKE WH. 1968. Ionospheric Irregularities produced by internal atmo-spheric gravity waves. J. Atmos. Sol. Terr. Phys., 30(5): 795–823. HUNSUCKER RD. 1982. Atmospheric gravity waves generated in the high-latitude ionosphere – a review. Rev. Geophys., 20(A2): 293–315. KELLEY MC & FUKAO S. 1991. Turbulent upwelling of the mid-latitude ionosphere, 2. Theoretical Framework. J. Geophys. Res., 96(A3): 3747– 3753.
KELLEY MC & MAKELA JJ. 2001. Resolution of the discrepancy between experiment and theory of midlatitudeF -region structures. Geophys. Res. Lett., 28(13): 2589–2592.
KELLEY MC, MAKELA JJ & SAITO A. 2000. On the electrical structure of airglow depletion/height layer bands over Arecibo. Geophys. Res. Lett., 27(18): 2837–2840.
KLAUSNER V, FAGUNDES PR, SAHAI Y, WRASSE CM, PILLAT VG & BECKER-GUEDES F. 2009. Observations of GW/TID oscillations in the F 2 layer at low latitude during high and low solar activity, geomag-netic quiet and disturbed periods. J. Geophys. Res., 114: A02313, doi: 10.1029/2008JA013448.
MARTINIS C, BAUMGARDNER J, SMITH SM, COLERICO M & MENDILLO M. 2006. Imaging science at El Leoncito, Argentina. Ann. Geophys., 24: 1375–1385.
MARTINIS C, BAUMGARDNER J, WROTEN J & MENDILLO M. 2010. Seasonal dependence of MSTIDs obtained from 630.0 nm airglow imaging at Arecibo. Geophys. Res. Lett., 37: L11103.
MENDILLO M, BAUMGARDNER J, NOTTINGHAM D, AARONS J, REINISH B, SCALI J & KELLEY M. 1997. Investigations of thermo-spheric-ionospheric dynamics with 6300-˚A images from the Arecibo observatory. J. Geophys. Res., 102(A4): 7331–7343.
OTSUKA Y, SHIOKAWA K, OGAWA T & WILKINSON P. 2004. Geo-magnetic conjugate observations of medium-scale traveling ionospheric disturbances at midlatitude using all-sky airglow imagers. Geophys. Res. Lett., 31: L15803.
PERKINS FW. 1973. SpreadF and ionospheric currents. J. Geophys. Res., 78(1): 218–226.
PIMENTA AA, SAHAI Y, BITTENCOURT JA, ABDU MA, TAKAHASHI H & TAYLOR MJ. 2004. Plasma blobs observed by ground-based optical and radio techniques in the Brazilian tropical sector. Geophys. Res. Lett., 31: L12810, doi: 10.1029/2004GL020233.
PIMENTA AA, KELLEY MC, SAHAI Y, BITTENCOURT JA & FAGUNDES PR. 2008a. Thermospheric dark band structures observed in all-sky OI 630 nm emission images over the Brazilian low-latitude sector. J. Geo-phys. Res., 113: A01307.
PIMENTA AA, AMORIM DCM & CANDIDO CMN. 2008b. Thermospheric dark band structures at low latitudes in the Southern Hemisphere under different solar activity conditions: A study using OI 630 nm emission all-sky images. Geophys. Res. Lett., 35: L16103.
SHIOKAWA K, IHARA C, OTSUKA Y & OGAWA T. 2003. Statistical study of nighttime medium-scale traveling ionospheric disturbances using midlatitude airglow images. J. Geophys. Res., 108: 1052.
NOTES ABOUT THE AUTHORS
Danielle Cristina de Morais Amorim. Licentiate degree in Physics from ETEP (2007); Master degree in Spatial Geophysics from the Instituto Nacional de
Pesqui-sas Espaciais – INPE (2010). Presently is a Doctorate Student in Spatial Geophysics at INPE. Research area: the study of the ionosphere dynamics using optical and radio instruments.
Alexandre Alvares Pimenta. Licentiate and Bachelor’s degrees in Physics from Universidade de Guarulhos (1993); Master degree in Physics from
Universi-dade Estadual Paulista J´ulio de Mesquita Filho – Unesp (1996); and Doctorate degree in Spatial Geophysics from Instituto Nacional de Pesquisas Espaciais – INPE (2002). Presently is an Aeronomy Researcher at INPE, working in the following fields: coupling between neutral and ionized atmosphere, wave structure in the upper atmosphere, plasma irregularities in the ionosphere. Professor at the post-graduate program in Spatial Geophysics at INPE.
Aline Amorim de Almeida. Graduated in Aeronautical and Space Engineering, Universidade do Vale do Para´ıba, UNIVAP, Brazil. Worked as a scholarship student at
Instituto Nacional de Pesquisas Espaciais – INPE. Experience area: Spatial Geophysics. Research area: study of dynamics of traveling ionospheric disturbances in the Brazilian low latitude sector using all-sky images of OI 630 nm airglow emission.