WATER STORAGE VARIABILITY IN A VINEYARD SOIL IN THE
SOUTHERN HIGHLANDS OF SANTA CATARINA STATE
(1)Rodrigo Vieira Luciano(2), Jackson Adriano Albuquerque(3), Álvaro Luiz Mafra(3), André
da Costa(4) & Josué Grah(5)
SUMMARY
In the subtropical regions of southern Brazil, rainfall distribution is uneven, which results in temporal variability of soil water storage. For grapes, water is generally available in excess and water deficiency occurs only occasionally. Furthermore, on the Southern Plateau of Santa Catarina, there are differences in soil properties, which results in high spatial variability. These two factors affect the composition of wine grapes. Spatio-temporal analyses are therefore useful in the selection of cultural practices as well as of adequate soils for vineyards. In this way, well-suited areas can produce grapes with a more appropriate composition for the production of quality wines. The aim of this study was to evaluate the spatio-temporal variability of water storage in a Cambisol during the growth cycle of a Cabernet Sauvignon vineyard and its relation to selected soil properties. The experimental area consisted of a commercial 8-year-old vineyard in São Joaquim, Santa Catarina, Brazil. A sampling grid with five rows and seven points per row, spaced 12 m apart, was outlined on an area of 3,456 m². Soil samples were collected with an auger at these points, 0.30 m away from the grapevines, in the 0.00-0.30 m layer, to determine gravimetric soil moisture. Measurements were taken once a week from December 2008 to April 2009, and every two weeks from December 2009 to March 2010. In December 2008, undisturbed soil samples were collected to determine bulk density, macro- and microporosity, and disturbed samples were used to quantify particle size distribution and organic carbon content. Results were subjected to descriptive analysis and semivariogram analysis, calculating the mean relative difference and the Pearson correlation. The average water storage in a Cambisol under grapevine on ridges had variable spatial dependence, i.e., the lower the average water storage, the higher the range of spatial dependence. Water storage had a stable spatial pattern during the trial period, indicating that
(1) Part of the Doctoral Thesis of the first author. Received for publication on March 28, 2012 and approved on October 25, 2013. (2) Post-doctoral candidate in Soil Conservation at the Centro de Ciências Agroveterinárias - Universidade do Estado de Santa
Catarina - CAV/UDESC. Av. Luís de Camões, 2090. CEP 88520-000 Lages (SC), Brazil. E-mail: agro.luciano@gmail.com (3) Professor of the Soil Department, UDESC. CNPq researcher. E-mail: albuquerque@pq.cnpq.br, a2alm@cav.udesc.br (4) Post-doctoral candidate in Soil Physics at the Universidade Federal de Santa Maria - UFSM. Av. Roraima, 1000, Bairro Camobi.
the points with lower water storage or points with higher water storage during a certain period maintain these conditions throughout the experimental period. The relative difference is a simple method to identify positions that represent the average soil water storage more adequately at any time for a given area.
Index terms: Cambisol, Vitis vinifera L., geostatistics, spatial variability, temporal variability.
RESUMO: VARIABILIDADE DO ARMAZENAMENTO DE ÁGUA DE UM SOLO
CULTIVADO COM VINHEDO NO PLANALTO SUL DE SANTA CATARINA
Em regiões de clima subtropical do sul do Brasil, a distribuição das precipitações pluviais é heterogênea, o que conduz a variabilidade temporal do armazenamento de água no solo. Geralmente ocorre excesso hídrico para a videira e, eventualmente, deficiência hídrica. Além disso, na região do Planalto Sul de Santa Catarina existem diferenças nos atributos dos solos, o que conduz a elevada variabilidade espacial. Esses dois fatores influenciam a composição das uvas viníferas. Assim, a análise da variabilidade espaço-temporal auxilia na escolha das práticas culturais, bem como dos solos que são aptos para a videira. Com isso, as áreas aptas podem produzir uva com composição mais adequada para a produção de vinhos de qualidade. Objetivaram-se avaliar a variabilidade espaço-temporal do armazenamento de água em um Cambissolo Húmico alumínico típico, no ciclo reprodutivo da uva Cabernet Sauvignon e relacionar o armazenamento de água com os atributos do solo. A área experimental foi locada num vinhedo comercial com oito anos de idade implantado em São Joaquim, SC. Foi demarcado um grid composto por cinco linhas e sete pontos por linha, espaçados por 12 m, em uma área de 3.456 m². Em cada ponto, distante 0,30 m da videira, foram coletadas amostras com um trado na camada de 0,00-0,30 m para determinar a umidade gravimétrica do solo. As medições foram realizadas semanalmente de dezembro de 2008 a abril de 2009 e quinzenalmente, de dezembro de 2009 a março de 2010. Em dezembro de 2008, foram coletadas amostras com estrutura preservada para determinar a densidade do solo, macro e microporosidade, e amostras com estrutura alterada para quantificar a granulometria e o teor de carbono orgânico do solo. Os resultados foram submetidos à análise estatística descritiva, análise de semivariogramas, diferença relativa média e correlação de Pearson. O armazenamento médio de água no Cambissolo Húmico cultivado com videira em camalhões teve dependência espacial variável, ou seja, quanto menor o armazenamento médio, maior foi o alcance da dependência espacial. A análise temporal indicou que os pontos com maior armazenamento em uma época tiveram menor armazenamento em outra, ocorrendo o mesmo para pontos com maior armazenamento. A diferença relativa é um método simples para identificar, no campo, posições que representam mais adequadamente o armazenamento médio de água no solo em qualquer tempo para determinada área.
Termos de indexação: Cambissolo Húmico, Vitis vinifera L., geoestatística, variabilidade
espacial, variabilidade temporal.
INTRODUCTION
Analyzing water storage in soils of the Southern Plateau of Santa Catarina during the growth and reproduction cycle of grapevine is useful to select management practices that contribute to higher yields and/or to improve the composition of wine grapes. The variability of soil water availability is a complex study object because storage varies spatially, horizontally and at different depths, mainly due to variations in soil particle size, organic matter content and soil structure, which determine the distribution of pore size, drainage and water retention (Libardi et al., 1986). In addition, the soil management (Vieira et al., 2010), slope and position in the landscape (Rawls &
Pachepsky, 2002) affect the spatial variability of soil moisture.
Geostatistics allow a description of the spatial variability of any variable based on modeling of spatial dependency (Matheron, 1971; Vieira, 2000; Soares, 2006), as well as an evaluation of the duration of the spatial patterns of soil water storage (Kachanoski & De Jong, 1988). Vieira et al. (2010) studied spatial and temporal variability of moisture in two systems of land use: maize-alfalfa rotation, and bush growth with predominance of pine. They observed that spatial dependence increased during the soil drying cycle.
nitrogen fixation, with consequences for crop yield (Reichardt et al., 1984). For grapevine, lower soil water storage is associated with better physiological maturation (greater soluble solids content) and phenological maturation (greater tannin content) of grapes, which are ideal characteristics for high-quality wines in the Southern Plateau region of Santa Catarina (Borghezan et al., 2011; Luciano, 2012).
Aside from the spatial there is temporal variability of water storage and availability in the soil, as a result of irregular rainfall distribution, associated with variations related to water retention and soil drainage. In a study to represent soil moisture, with a view to reducing the number of field samplings required, Vachaud et al. (1985) proposed the concept of temporal stability. This concept may be defined as the association, consistent over time, between the spatial location and the values of descriptive statistical parameters. The concept is realistic for soil moisture insofar as the probability is high that when moisture is higher at a point at one time this will be repeated at other times (Melo Filho & Libardi, 2005).
The verification of temporal stability of soil water storage may generate clearer and more precise scientific information, which may be used with greater reliability, in response to growing questions about sampling with regard to hydraulic conductivity, which has a direct effect on water flows in the soil to the plants (Melo Filho & Libardi, 2005).
When analyzing the temporal stability of moisture in an Acrisol in Piracicaba, São Paulo, Gonçalves et al. (1999) observed that some locations store more and others less water over time. In a single citrus orchard grown in a Ferralsol in Piracicaba, São Paulo, Rocha et al. (2005) and Moreti et al. (2007) identified storage locations with a moisture level that would allow estimation of the overall average of water storage in the area in different periods. These conclusions have practical consequences because these locations were the most representative for monitoring average soil water storage, corroborating the concept of Vachaud et al. (1985). However, Vieira et al. (2010) observed the influence of the plant cover and the type of soil management system in the wetting and drying cycles of the soil over time in an Umbrisol (IUSS Working Group WRB, 2006), which shows that spatial distribution of soil moisture is not always stable over time.
The spatial-temporal variability of soil water storage was also investigated elsewhere, as by Ávila et al. (2011), Gao & Shao (2012) and Salvador et al. (2012).
On the Southern Plateau of Santa Catarina, there is generally an excess of rainfall in relation to other fine-wine producing regions, such as the Campanha region of Rio Grande do Sul. Soil water storage depends on properties such as soil particle size and organic carbon content. Soil moisture is a property that noticeably modifies yield and the composition of grapes
for winemaking. Therefore, the choice of the area for establishing vineyards in this region must take into account the soil properties that minimize water storage. Thus, to understand water dynamics in the soil and adequately manage highland soils under vineyards, it is necessary to evaluate the spatial-temporal variability of soil water storage and its relation to organic carbon content and soil particle size distribution.
The aim of this study was to evaluate the spatial and temporal variability of water storage in a Cambisol in the reproductive cycle of Cabernet Sauvignon grape, and relate water storage to soil properties.
MATERIAL AND METHODS
The experiment was set up in a vineyard with the Cabernet Sauvignon cultivar planted in 2003, in the municipality of São Joaquim, on the Southern Plateau of Santa Catarina (28o 15’ 32" S and 49o 57’ 35" W, mean altitude 1,260 m asl), in the growing seasons 2008/2009 and 2009/2010. The regional climate is Cfb, according to the Köppen classification (Peel et al., 2007), i.e., temperate, constantly wet, with no dry season and a cool summer (mean temperature of the hottest month < 22.0 oC). Total annual rainfall ranges from 1,360 to 1,600 mm, with least rainfall in April and most in September. Annual total of rainy days is around 135 and normal relative air humidity ranges from 80 to 83 % (Benez et al., 2002). The soil was classified as a Cambisol by the IUSS Working Group WRB (2006), and as Cambissolo Húmico alumínico típico by Embrapa (2006), in a silty loam textural class (Luciano, 2012).
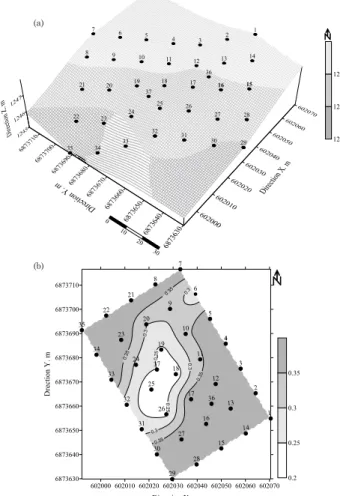
Ridges were formed during establishment of the vineyard, by moving soil from between the rows and depositing it in the plant rows. Seedlings were planted at a spacing of 1.2 m between plants and 3.0 m between rows, in north-south direction under shade net to avoid hail damage. For experimental analysis, a grid was outlined consisting of five plant rows at a spacing of 12 m between rows, with seven points per row, also spaced 12 m apart, resulting in a 48 × 72 m rectangle (3,456 m²), plus two points in the center of the area for the calculations of semivariance at spacings of less than 10 m, for a total of 37 points (Figure 1a). The effective soil depth at each grid point was greater than 0.4 m, measured with a digital penetrometer (Falker, with a 30o conical tip), with the exception of points 18, 25, 26 and 37 where the depth is less than 0.30 m due to contact with rock (Figure 1b).
To evaluate spatial and temporal variation of soil water storage, gravimetric soil moisture (Gm) was determined according to the method described by Embrapa (1997), in triplicate. Samples were collected in the 0.00-0.30 m layer, within a radius of 0.3 m from each grid point, to obtain a sample composed of 100 to 150 g of soil. A screw auger (length 1.15 m, diameter 0.02 m) was used. The data represent the soil in the center of grapevine plant rows, a place where there is no machine traffic, only traffic of people in grapevine treatments (defoliation and thinning) and at grape harvest.
During the growth and reproductive period (flowering to maturity) of grapevine, 17 weekly collections were made, from December 2008 (Julian day 346) to April 2009 (Julian day 105) in the 2008/ 2009 growing season, and six collections every two weeks, from December 2009 (Julian day 343) to March 2010 (Julian day 76) in the 2009/2010 growing season. In December 2008, in the center of the ridge, at a distance of 0.5 m from the grapevine, trenches of
0.2 × 0.3 m were dug for collection of undisturbed soil samples in the 0.00-0.30 m layer in duplicate with metallic rings (volume 50 cm3) to determine bulk
density (Bd) by the method of soil sample rings and of field capacity (FC) at a tension of 10 kPa in a sand column, according to the principles described by Embrapa (1997). Undisturbed samples were collected for determination of moisture at the permanent wilting point, particle size distribution (Gee & Bauder, 1986) and total organic matter content of the soil (Tedesco et al., 1985). The permanent wilting point was determined by the dew-point technique with a device called WP4 (PMP-WP4) at a tension of 1,500 kPa, according to the procedure described by Klein et al. (2006).
From the Gm and the Bd, volumetric moisture (θ) was calculated for each point of the grid (Embrapa, 1997), and water storage expressed in water depth, assuming that the Bd remained constant in the experimental area over time since there was no machinery traffic and use of implements, nor treading of animals on the ridges. Mean storage was calculated (17 determinations for 2008/2009 and six for 2009/ 2010) for each grid point in the 2008/2009 and in the 2009/2010 growing seasons.
Water storage in the profile (AL in mm, in the layer
from 0 to z mm) was calculated according to the procedure described by Reichardt (1985):
(1) where AL was obtained by multiplying the mean volumetric moisture in the interval 0-L ( ) by the thickness of the layer evaluated (L = 300 mm).
0 10 20 30 40 50 60 70 80
Accumulated rainfall ( Dec.- April) = 512 mm
0 10 20 30 40 50 60 70 80
Accumulated rainfall ( Dec.- April) = 1.229 mm
dec jan feb mar apr may
Daily pluvial precipitation, mm
Growing season 2008/2009
Growing season 2009/2010
Flowering Berry maturation Harvest
Figure 2. Daily pluvial precipitation at Epagri Experimental Station, 2.8 km away from the experimental area, in the growing season 2008/ 2009 and 2009/2010 (Epagri-Ciram, 2011). 1 2 3 4 5 6 7 8 9
10 11 12 13 14
15 16 17 18 19 20 21
22 23 24
25 26 27 28 29 30 31 32 33 34 35 36 37 0 10 20 30 1245 1246 1247
602000 602010 602020 602030 602040 602050 602060 602070
Direction X. m
6873630 6873640 6873650 6873660 6873670 6873680 6873690 6873700 6873710 D re ct io n Y . m 1 2 3 4 5 6 7 8 9 10 11 12 13 14 15 16 17 18 19 20 21 22 23 24 25 26 27 28 29 30 31 32 33 34 35 36 37 0.2 0.25 0.3 0.35 (a) (b)
The data were analyzed by descriptive statistics, geostatistics, Pearson’s correlation and evaluation of the temporal stability of soil water storage. In descriptive statistics, the mean, median, minimum and maximum, standard deviation and the coefficients of variation, asymmetry and kurtosis were calculated. The hypothesis of data normality was tested by the Kolmogorov-Smirnov test, using software Assistat 7.6 Beta (Silva & Azevedo, 2012). Spatial variability was analyzed by semivariograms, as described by Guimarães (2004):
(2)
where γ*(h) is the estimate of the experimental semivariance obtained by the sampled values [Z(xi), Z(xi+h)]2; h is the distance between sampling points;
and N(h) is the total number of pairs of possible points within the sampling area with the distance h.
The semivariograms were fit to mathematical models to obtain: nugget effect (C0); sill (C0+C1);
and range (a). The quality of fit of the models to the semivariograms was evaluated by the weighted least square method [greatest coefficient of determination (R²) and least sum of squared residuals (SSR)], using software GS+ 5.0 (Robertson, 1998). The model that represented the fit of the semivariograms was then chosen by cross validation (jackknifing), as described by Vieira (2000). A perfect fit would have a R² = 1, and the line of best fit would coincide with the perfect model, i.e., the linear coefficient would be zero and the angular coefficient 1. In the validation, each point contained within the spatial domain is individually removed, with its value being estimated as if it did not exist. In this way, a graph of estimated values versus observed values can be constructed for all the points (Salvador et al., 2012). Therefore, this validation tests the reliability of the semivariograms and, according to Vieira et al. (1983), ensures that the maps prepared by kriging have equal validity.
The data of soil water storage were interpolated by kriging to estimate storage at unmeasured locations and to generate spatial distribution maps using software SURFER 7.0 (Golden Software, 1999).
From the fitting of the models of the semivariograms, the relation between the nugget effect (C0) and the sill (C) was calculated, called degree of dependence (DD) and expressed in percentage, which is used to classify the spatial dependence as strong (DD 25 %), moderate (25 < DD < 75 %), and weak (DD 75 %) (Cambardella et al., 1994). In addition, in the study of temporal stability of soil water storage, the mean relative difference (RD) and its respective standard deviations were calculated according to Vachaud et al. (1985). Thus, with the volumetric moisture (θ) calculated for each point and time, the mean relative differences were calculated by:
(3)
in which RD is the relative difference between individual determination for a location and time and its mean estimate (%); θij is the moisture (cm3 cm-3)
at location i at time j; is the mean moisture (cm3 cm-3) for all positions at time j. The respective
standard deviations of soil moisture related to the spatial variations were calculated in order to indicate the degree of reliability of the measure. After calculating the relative differences and their standard deviations, the results were ordered from the least to the greatest and plotted on a graph, by which the locations were identified that systematically overestimate (RD > 0) or underestimate (RD < 0) mean soil moisture, regardless of the time of observation. The location chosen for future sample collection, for reliable and representative values, would have RD equal to or very near zero, or associated with the least standard deviation (Vachaud et al., 1985; Gonçalves et al., 1999). This supposition must be evaluated in periods of high and also low soil moisture, according to Lemon (1956), evaporation is controlled by environmental conditions and hydraulic properties of the soil, and is divided into three stages. The first stage is rapid water loss, controlled by environmental conditions. In the second, evaporation is controlled by capillary flow and vapor transfer. In the third stage, moisture loss is extremely slow, governed by adsorptive forces at the soil interface.
RESULTS AND DISCUSSION
Descriptive statistics
The measurements of central tendency (mean and median) of soil water storage were similar for most of the sampling points in relation to time, indicating symmetric distribution. Minimum storage ranged from 25 mm at point 18 up to 142 mm at point 34; while the maximum ranged from 117 mm at point 25 up to 224 mm at point 34 (Table 1). This amplitude in minimum and maximum storage indicates that the soil at each point has differentiated properties, especially those related to water retention. Asymmetry for all grid points was in the range of -2 to +2, which indicates normal distribution (Moreti et al., 2007). The kurtosis coefficients were negative at 26 points, which were nearly one unit distant from zero, which allowed classification of this distribution as platykurtic, and 11 were classified as leptokurtic. The coefficients of variation (CV) for the two years of collection remained in the range between 10 and 39 %. They were higher when the soil was drier and lower when it was moister, confirming the study of Vieira et al. (2010).
growing season (p=0.13 < pcritical 0.14; n=37), in the
2009/2010 growing season (p=0.08< pcritical 0.14; n=37)
and the maximum value (p=0.07< pcritical 0.14; n=37) had normal distribution; nevertheless, the minimum value (p=0.15> pcritical 0.14; n=37) had distribution
other than normal, which need to be transformed to achieve normality. Nevertheless, Isaaks & Srivastava (1989) reported that the occurrence (or not) of what is called the proportional effect, in which the mean value and the variability of the data are constant in the area under study, is more important than data normality.
Geostatistical analyses
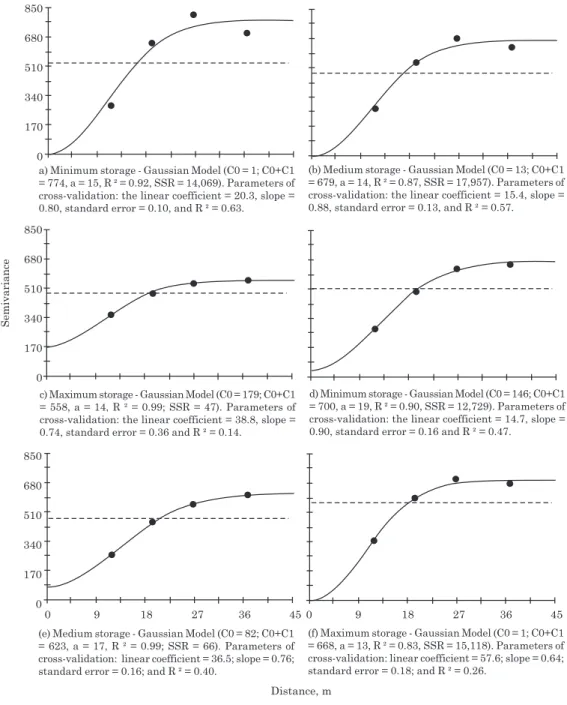
Analysis of spatial dependency for mean, minimum and maximum water storage in space in the 2008/ 2009 and 2009/2010 growing seasons revealed a spatial dependence structure for most of the observations (Figure 3). Gonçalves et al. (1999) and Salvador et al. (2012) also found a spatial dependence structure for soil water storage. The semivariograms for soil water storage were fit to the Gaussian model. Moreti et al. (2007) observed a better adjustment by
Point Mean Median Minimum Maximum SD(1) CV(2) Asym.(3) Kurt.(4)
%
1 117 113 101 142 13 11 0.73 -0.42
2 121 121 94 148 13 11 -0.15 -0.21
3 156 164 102 181 20 13 -1.33 1.64
4 161 170 96 192 26 16 -0.95 0.09
5 163 165 108 209 29 18 -0.31 -0.98
6 116 119 45 162 33 29 -0.38 -0.74
7 140 141 80 183 31 22 -0.28 -0.83
8 149 155 92 186 30 20 -0.56 -0.69
9 139 145 75 193 40 28 -0.28 -1.22
10 143 145 96 170 20 14 -0.64 -0.04
11 151 153 97 202 31 21 -0.06 -0.83
12 136 136 104 170 17 13 -0.04 -0.64
13 140 144 89 168 19 14 -0.88 0.85
14 128 127 102 152 13 10 0.14 -0.45
15 126 126 100 156 17 13 0.10 -0.93
16 138 144 96 162 18 13 -1.09 0.45
17 119 120 87 151 16 13 -0.23 -0.48
18 89 94 25 134 33 38 -0.44 -0.95
19 104 109 66 136 21 20 -0.32 -1.11
20 148 154 112 169 17 12 -1.09 0.14
21 144 149 90 174 22 15 -0.86 0.32
22 130 129 95 162 19 15 -0.33 -0.57
23 149 150 100 175 22 15 -0.64 -0.38
24 122 128 81 145 18 15 -0.85 -0.24
25 87 90 27 117 25 29 -0.76 -0.10
26 111 115 74 134 19 17 -0.47 -1.03
27 160 165 114 197 24 15 -0.21 -0.90
28 147 148 116 183 20 13 0.07 -0.83
29 119 118 79 146 16 14 -0.53 0.42
30 148 154 110 199 22 15 0.06 0.07
31 122 125 87 156 21 17 -0.28 -1.02
32 111 113 43 152 25 23 -0.79 0.91
33 146 154 103 176 20 14 -0.82 -0.08
34 188 199 142 224 24 13 -0.59 -0.50
35 141 144 101 215 24 17 0.88 2.91
36 136 134 95 179 19 14 0.08 0.50
37 101 109 27 156 40 39 -0.52 -0.80
Table 1. Descriptive statistics of water storage (mm) in the 0.00-0.30 m layer of a Cambisol at each collection point for the sampling period (2008/2009 to 2009/2010); n=37 sampling points
the exponential model when fitting semivariograms to mean water storage over three years in a Ferralsol under citrus. Vieira et al. (2010) evaluated moisture in an Umbrisol in Spain, under two management systems, and found a fit by the spherical and exponential model. Salvador et al. (2012) fitted semivariograms to water storage in a Ferralsol at two depths in common bean and reported the predominance of the spherical model, followed by the exponential model.
An analysis of the spatial dependence degree (DD) showed a strong DD (<25 %) for minimum and mean water storage, and moderate DD for maximum storage
in both growing seasons. The ranges for minimum, mean and maximum storage were 15, 14 and 14 m, respectively, in the 2008/2009 growing season (Figure 3a,b,c) and 19, 17 and 13 m in the 2009/2010 growing season (Figure 3d,e,f). This variation in soil water storage is explained mainly by the slope of the area (mean of 0.05 m m-1) and variability at the depth of
the profile, favoring surface runoff and drainage, respectively, which are processes that affect soil water storage. Nevertheless, it is important to consider the spatial variations of soil properties in the grapevine plant rows (ridges) in terms of particle size distribution, structure, porosities and plant cover,
850
680
510
340
170
0
850
680
510
340
170
0
850
680
510
340
170
0
0 9 18 27 36 45 0 9 18 27 36 45
Distance, m
Semivariance
a) Minimum storage - Gaussian Model (C0 = 1; C0+C1 = 774, a = 15, R ² = 0.92, SSR = 14,069). Parameters of cross-validation: the linear coefficient = 20.3, slope = 0.80, standard error = 0.10, and R ² = 0.63.
(b) Medium storage - Gaussian Model (C0 = 13; C0+C1 = 679, a = 14, R ² = 0.87, SSR = 17,957). Parameters of cross-validation: the linear coefficient = 15.4, slope = 0.88, standard error = 0.13, and R ² = 0.57.
c) Maximum storage - Gaussian Model (C0 = 179; C0+C1 = 558, a = 14, R ² = 0.99; SSR = 47). Parameters of cross-validation: the linear coefficient = 38.8, slope = 0.74, standard error = 0.36 and R ² = 0.14.
d) Minimum storage - Gaussian Model (C0 = 146; C0+C1 = 700, a = 19, R ² = 0.90, SSR = 12,729). Parameters of cross-validation: the linear coefficient = 14.7, slope = 0.90, standard error = 0.16 and R ² = 0.47.
(e) Medium storage - Gaussian Model (C0 = 82; C0+C1 = 623, a = 17, R ² = 0.99; SSR = 66). Parameters of cross-validation: linear coefficient = 36.5; slope = 0.76; standard error = 0.16; and R ² = 0.40.
(f) Maximum storage - Gaussian Model (C0 = 1; C0+C1 = 668, a = 13, R ² = 0.83, SSR = 15,118). Parameters of cross-validation: linear coefficient = 57.6; slope = 0.64; standard error = 0.18; and R ² = 0.26.
which play an important role in the soil water dynamics (Luciano, 2012).
Generally, in the periods of greater water storage, spatial dependence increased, observed by the greater range (2009/2010 growing season), while in the periods of less storage, the range decreased (2008/2009 growing season). The reduction of spatial dependence with soil drying is probably explained by the reduction in the water matrix potential and the hydraulic conductivity, which favor water flow in the soil. Possibly, the increase of variance, to the extent that mean water content diminished, may have been caused by the variability of macroporosity at the soil surface, which had negative correlation with mean water storage in the two growing seasons (-0.37* and
-0.40*, n=37, p<0.05). According to Sanchez et al.
(2009), the factors that affect water flows in the soil drying period are the slope, particle size distribution, soil structure, and organic matter content, as well as the type of vegetation in the area.
Salvador et al. (2012) also observed that the spatial storage pattern changed with moisture, with the increase of range in the phase of soil water recharge. Vieira et al. (2008) observed that spatial dependence decreases to the extent that the soil becomes drier, and the results of one year are related with other years. As the soil dries, the temporal stability of the spatial distribution tends to disappear since non-saturated hydraulic conductivity controls water evaporation. Nevertheless, Grego et al. (2006) observed greater randomness of spatial variation of moisture in a Ferralsol of Campinas, SP, and attributed this to the drying process, which may lead to cracks and modify the hydraulic conductivity of the soil.
Under field conditions, Libardi et al. (1986) observed that the wetting and drying process occurs in an uncontrolled manner and does not always change the discrepant values (“outliers”) with the wetting of the soil. Apart from moisture, water storage is modified by edaphic factors of the location and the management system used (Sampaio et al., 2010).
With respect to cross validation, the coefficient of determination (R2) ranged from 0.14 to 0.63 in the
2008/2009 growing season and from 0.26 to 0.47 in the 2009/2010 growing season (Figure 3). In general, the linear coefficients were high and the angular coefficient above 0.75, with exception of the coefficients for maximum soil water storage. According to Salvador et al. (2012), a better combination of values of the parameters of cross validation should be sought in order to proceed to the choice of the best semivariogram. Thus, no spatial distribution maps were created for maximum soil water storage because the set of indicators was unsatisfactory.
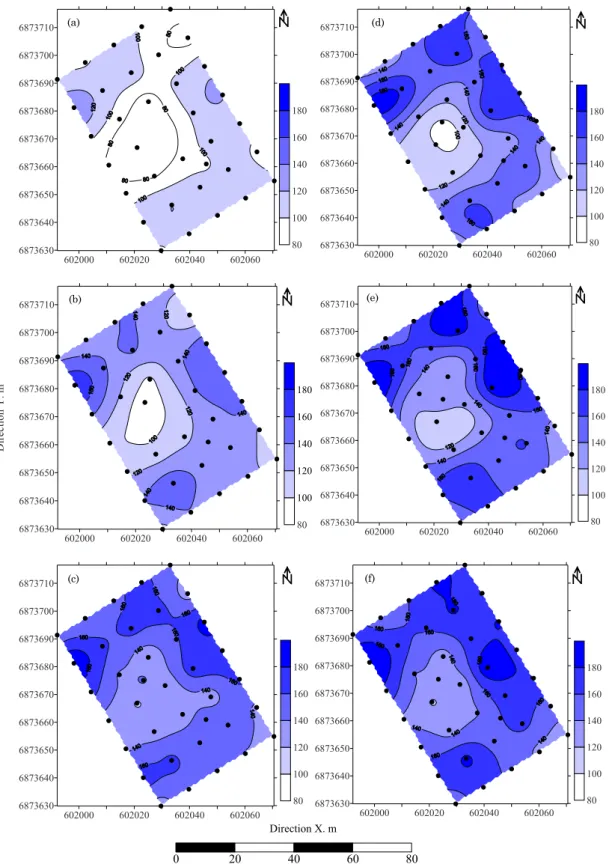
The use of interpolation methods (kriging and inverse weighted distances) generated contour maps of the spatial distribution of water storage in the grapevine rows. Areas of low, medium and high water
storage are discriminated (Figure 4) by the differences in the soil physical properties, such as macroporosity, microporosity, particle size distribution, and organic carbon content, which determine water storage (Luciano, 2012).
The lowest water storage (80-140 mm) was observed in the center west region of the map, corresponding to the region with effective depth less than 0.30 m. The greatest water storage (140 mm - >180 mm) was observed in the northwestern region, with lower slope (Figure 1), which is explained by the concentration of the laminar and interstitial water flow in the soil, which is displaced due to differences in the total potential.
Temporal stability
In the period of lowest water storage, the 0.00-0.30 m layer stored 78 mm in the 2008/2009 and 109 mm in the 2009/2010 growing season (Figure 4a,d); in the period of greatest water storage, this layer stored 184 mm in the 2008/2009 and 200 mm in the 2009/ 2010 growing season (Figure 4c,f).
In the 2008/2009 growing season, the area had points with low water storage, explained mainly by the lower depth of the profile, with even the presence of the Cr horizon or the R layer near the surface (Figure 1b). In the 2009/2010 growing season, there was high rainfall, with a longer period of soil recharge. At 14 points, the mean water storage exceeded field capacity (FC), i.e., the moisture level affected gas exchange rates between the atmosphere and plant roots (Figure 5) due to the reduced aeration capacity in these periods. In addition to high rainfall, the bedrock with little alteration below the soil horizons blocks drainage and, in some periods and regions, induces moisture near saturation.
When comparing the storage at each point, considering both growing seasons, it may be observed that the points with least storage in one year are generally the points with least storage in another year, the same applying to the points of greatest soil water storage (Figure 5). This was evidenced by the linear correlation between the growing seasons, classified as strong (R2=0.75) (Figure 6). It is a
behavior intrinsic to properties such as particle size distribution, organic matter content and soil structure, as well as the effect of soil depth and relief and/or microrelief of the area on water flows and storage. In studies on water storage in a Ferralsol in a citrus orchard in Piracicaba, São Paulo, Rocha et al. (2005) and Moreti et al. (2007) also reported that water storage has a stable spatial pattern over time. According to Gonçalves et al. (1999), this storage pattern at each point over the years (Figure 5) indicates the existence of temporal stability in the studied growing seasons.
602000 602020 602040 602060 6873630
6873640 6873650 6873660 6873670 6873680 6873690 6873700 6873710
D
ir
ec
ti
on
Y
.
m
80 100 120 140 160 180
(a)
(b) (e)
(d)
602000 602020 602040 602060
6873630 6873640 6873650 6873660 6873670 6873680 6873690 6873700 6873710
80 100 120 140 160 180
602000 602020 602040 602060
6873630 6873640 6873650 6873660 6873670 6873680 6873690 6873700 6873710
80
100 120 140 160 180
602000 602020 602040 602060
6873630 6873640 6873650 6873660 6873670 6873680 6873690 6873700 6873710
80 100 120 140 160 180
602000 602020 602040 602060
Direction X. m
6873630 6873640 6873650 6873660 6873670 6873680 6873690 6873700 6873710
80 100 120 140 160 180
602000 602020 602040 602060
6873630 6873640 6873650 6873660 6873670 6873680 6873690 6873700 6873710
80 100 120 140 160 180
0 20 40 60 80
(c) (f)
Figure 4. Maps of water storage (mm) in the 0.00-0.30 m layer of a Cambisol. Minimum (a), medium (b) and maximum storage (c) in 2008/2009; minimum (d), medium (e) and maximum storage (f) in 2009/2010.
-0.34*, n=37, p<0.05) and positively correlated with microporosity (0.30* and 0.35*, n=37, p<0.05). Thus, storage at each point depends on rainfall, but also on the soil properties at each location.
Mean relative difference
stability, i.e., values near the mean value, regardless of the period/date of collection (Figure 7). Mean standard deviation ranged from ±5 to ±27 % in the 2008/2009 growing season and from ±2 to ±18 % in the 2009/2010 growing season. In the 2008/2009 growing season, with less rainfall, there was a greater number of points of collection with standard deviation distant from zero, which indicates greater oscillation in soil water storage over time and, consequently, in water availability to grapevine. Rocha et al. (2005) calculated a standard deviation ranging from ±5 to ±6 % in the years 2001/2002 and 2002/2003, respectively, in a Ferralsol under citrus.
The points for future samplings whose values are representative of the area are chosen by observing the point and/or points with a relative difference (RD)
near zero on the ordered graph, associated with less standard deviation (Gonçalves et al., 1999).
In the 2008/2009 growing season, the points with greatest mean relative difference were 18, 37 (-20 %), 4 (+19 %) and 34 (+39 %). The points that best represent the mean value of water storage were points 26 (+0.1 %), 12 (-0.3 %) and 16 (+2 %). In the 2009/ 2010 growing season, the points with the greatest mean relative difference were 1, 2 (-18 %), 5 (+19 %) and 34 (+25 %). The points that best represented the mean values were 26 (-0.2 %), 20 (-0.7 %) and 13 (-0.6 %). Thus, the points with the least relative difference should be chosen for moisture measurements and monitoring of soil water storage to study water balance in grape in this area. The Cambissolo Húmico (Cambisol) had points with temporal stability, which indicates the validity of the procedure proposed by Vachaud et al. (1985) and confirmed by Gonçalves et al. (1999), Rocha et al. (2005), Moreti et al. (2007) and Salvador et al. (2012).
CONCLUSIONS
1. The mean water storage in a Cambisol under grapevine on ridges had variable spatial dependence, i.e., the lower the mean water storage, the higher the range of spatial dependence.
2. Water storage had a stable spatial pattern over time, which indicates that the points with less storage
60 80 100 120 140 160 180 200 220
60 80 100 120 140 160 180 200 220
R² = 0,75**
Growing season 2009/2010
Growing season 2008/2009
Figure 6. Regression analysis of average water storage (mm), in the layer 0.00-0.30 m, of a Cambisol, for the growing seasons 2008/2009 and 2009/2010.
Point
0 2 4 6 8 10 12 14 16 18 20 22 24 26 28 30 32 34 36 38 40 40
60 80 100 120 140 160 180 200 220
Growing season 2008/2009 Growing season 2009/2010 FC
PWP
Medium water storage, mm
Figure 5. Medium water storage evaluated at each point in the 0.00-0.30 m layer of a Cambisol, in the growing seasons 2008/2009 and 2009/2010. FC: Field capacity; PWP: Permanent wilting point determined by psychrometer (WP4).
0 2 4 6 8 10 12 14 16 18 20 22 24 26 28 30 32 34 36 38
-40 -35 -30 -25 -20 -15 -10-5 0 5 10 15 20 25 30 35 40
Growing season2008/2009 34
18
26
37
4 12 16
0 2 4 6 8 10 12 14 16 18 20 22 24 26 28 30 32 34 36 38
-40 -35 -30 -25 -20 -15 -10-5 0 5 10 15 20 25 30 35 40
34
1
26
2
5 20 13
Mean relative difference, %
Growing season2009/2010
Standart deviation
Rank
Mean relative difference, % Standard deviation
in one time period had less storage in another, and likewise for points with greater storage.
3. The relative difference is a simple methodology for field identification of the points that most adequately represent mean soil water storage at any time for a given area. This represents an advance for monitoring water storage in vineyards, by reducing the number of samples required to estimate a representative mean, with greater reliability and less sampling effort.
LITERATURE CITED
ÁVILA, L.F.; MELLO, C.R.; MELLO, J.M. & SILVA, A.M. Padrão espaço-temporal da umidade volumétrica do solo em uma bacia hidrográfica com predominância de Latossolos. R. Bras. Ci. Solo, 35:1801-1810, 2011. BENEZ, M.C.; CHANIN, Y.M.A.; LAUS NETO, J.A.; BRAGA,
H.J.; PUNDEK, M.; MOLINARI, A.; ROSSO, R.; CARRIÃO, S.L. & BACIC, I.L.Z. Dados e informações biofísicas da Unidade de Planejamento Regional Planalto Sul Catarinense. Florianópolis, Epagri, 2002. 76p. BORGHEZAN, M.; GAVIOLI, O.; PIT, F.A. & SILVA, A.L.
Comportamento vegetativo e produtivo da videira e composição da uva em São Joaquim, Santa Catarina. Pesq. Agropec. Bras., 46:398-405, 2011.
CAMBARDELLA, C.A.; MOORMAN, T.B.; NOVAK, J.M.; PARKIN, T.B.; KARLEN, D.L.; TURCO, R.F. & KONOPKA, A.E. Field-scale variability of soil properties in Central Iowa soils. Soil Sci. Soc. Am. J., 58:1501-1511, 1994.
EMPRESA BRASILEIRA DE PESQUISA AGROPECUÁRIA - EMBRAPA. Centro Nacional de Pesquisa de Solos. Sistema brasileiro de classificação de solos. 2.ed. Rio de Janeiro, 2006. 306p.
EMPRESA BRASILEIRA DE PESQUISA AGROPECUÁRIA - EMBRAPA. Centro Nacional de Pesquisa de Solos. Manual de métodos de análise de solo. 2.ed. Rio de Janeiro, 1997. 212p.
EMPRESA DE PESQUISA AGROPECUÁRIA E EXTENSÃO RURAL DE SANTA CATARINA - EPAGRI. Centro de informações de recursos ambientais e de hidrometeorologia de Santa Catarina. Available at: <http://ciram.epagri.sc.gov.br>. Accessed in 2011. GAO, L. & SHAO, M. Temporal stability of soil water storage
in diverse soil layers. Catena, 95:24-32, 2012.
GEE, G.W. & BAUDER, J.W. Particle-size analysis. In: KLUTE, A., ed. Methods of soil analysis. Madison, America Society of Agronomy, 1986. Part 1. p.383-411. GOLDEN SOFTWARE. SURFER for windows. Realese 7.0. Contouring and 3D surface mapping for scientists and engineers. User’s guide. New York, Golden Software, 1999. 619p.
GONÇALVES, A.C.A.; FOLEGATTI, M.V. & SILVA, A.P. Estabilidade temporal da distribuição espacial da umidade do solo em área irrigada por pivô central. R. Bras. Ci. Solo, 23:153-164, 1999.
GUIMARÃES, E.C. Geostatística básica e aplicada. UFU/ FA M A T . N ú c l e o d e e s t u d o s e s t a t í s t i c o s e b i o m é t r i c o s . 2004. 48p. Available at: <http:// ednaldoufu.webnode.com.br/geoestatistica>. Accessed on: Sept 3, 2011.
GREGO, C.R.; VIEIRA, S.R.; ANTONIO, A.M. & DELLA ROSA, S.C. Geostatistical analysis for soil moisture content under the no-tillage cropping system. Sci. Agric., 63:341-350, 2006.
ISAAKS, E.H. & SRIVASTAVA, R.M. An introduction to applied geostatistics. New York, Oxford University Press, 1989. 561p.
IUSS WORKING GROUP WRB. World reference base for soil resources 2006: A Framework for International Classification, Correlation and Communication. 2nd. ed., Rome, Food and Agriculture Organization of the United Nations, 2006. 132p.
KACHANOSKI, R.G. & DE JONG, E. Scale dependence and the temporal persistence of spatial patterns of soil water storage. Water Resour. Res., 24:85-91, 1988.
KLEIN, V.A.; REICHERT, J.M. & REINERT, D.J. Água disponível em um Latossolo Vermelho argiloso e murcha fisiológica de culturas. R. Bras. Eng. Agríc. Amb., 10:646-650, 2006.
LEMON, E.R. The potentialities for decreasing soil moisture evaporation loss. Soil Sci. Soc. Am. J., 20:120-125, 1956. LIBARDI, P.L.; PREVEDELLO, C.L.; PAULETTO, E.A. & MORAES, S.O. Variabilidade espacial da umidade, textura e densidade de partículas ao longo de uma transeção. R. Bras. Ci. Solo, 10:85-90, 1986.
LUCIANO, R.V. Variabilidade espacial e temporal de atributos do solo e relação com a qualidade da uva para vinificação no Planalto Catarinense. Lages, Universidade do Estado de Santa Catarina, 2012. 156p. (Tese de Doutorado) MATHERON, G. The theory of regionalized variables and its
applications. Paris, Les Cahiers du Centre de Morphologie Mathematique de Fontainebleu, 1971. 211p.
MELO FILHO, J.F. & LIBARDI, P.L. Estabilidade temporal de medidas do teor e do potencial mátrico da água no solo em uma transeção. R. Bras. Ci. Solo, 29:497-506, 2005.
MORETI, D.; LIBARDI, P.L.; ROCHA, G.C.; LOVATTI, M.J. & AGUIAR, L.I.G. Avaliação espaço-temporal das armazenagens gravimétricas e volumétricas da água num Latossolo com citros. R. Bras. Ci. Solo, 31:1281-1290, 2007.
PEEL, M.C.; FINLAYSON, B.L. & McMAHON, T.A. Updated world map of the Köppen-Geiger climate classification. Hydrol. Earth Syst. Sci., 11:1633-1644, 2007.
REICHARDT, K.; KIRDA, C.; ZAPATA, F.; HARDARSON, G. & AXMANN, H. Evaluation of soil-water and plant nitrogen status by nuclear techniques. In: REGIONAL WORKSHOP ON NUCLEAR TECHNIQUES IN CROP PRODUCTION, Piracicaba, 1984. Proceedings… Piracicaba, CENA, 1984. p.239-246.
REICHARDT, K. Processos de transferência no sistema solo-planta-atmosfera. Campinas, Fundação Cargill, 1985. 485p.
ROBERTSON, G.P. GS+: Geostatistics for the environmental sciences (version 5.1 for windows) - GS+ User’s Guide. Plainwell, Gamma Design Software, 1998. 152p. ROCHA, G.C.; LIBARDI, P.L.; CARVALHO, L.A. & CRUZ,
A.C.R. Estabilidade temporal da distribuição espacial da armazenagem de água em um solo cultivado com citros. R. Bras. Ci. Solo, 29:41-50, 2005.
SALVADOR, M.M.S.; LIBARDI, P.L.; BRITO, A.S. & MOREIRA, N.B. Estabilidade temporal e variabilidade espacial da distribuição da armazenagem de água no solo numa sucessão feijão/aveia-preta. R. Bras. Ci. Solo, 36:1434-1447, 2012.
SAMPAIO, F.M.T.; FERREIRA, M.M.; OLIVEIRA, M.; ALMEIDA, A.C. & JOSÉ, M.R. Variabilidade espacial da umidade de um Latossolo Vermelho-Amarelo sob plantio direto. Eng. Agríc., 30:854-861, 2010.
SANCHEZ, R.B.; MARQUES JÚNIOR, J.; SOUZA, Z.M.; PEREIRA, G.T. & MARTINS FILHO, M.V. Variabilidade espacial de atributos do solo e de fatores de erosão em diferentes pedoformas. Bragantia, 68:1095-1103, 2009.
SILVA, F.A.S. & AZEVEDO, C.A.V. Versão do programa computacional Assistat 7.6 Beta para o sistema operacional Windows. Campina Grande, Universidade Federal de Campina Grande, 2012.
SOARES, A. Geoestatística para ciências da terra e do ambiente. 2.ed. Lisboa, Instituto Superior Técnico, 2006. 214p. TEDESCO, M.J.; GIANELLO, C.; BISSANI, C.A.; BOHNEN,
H. & VOLKWEISS, S.J. Análise de solo, plantas e outros materiais. Porto Alegre, Universidade Federal do Rio Grande do Sul, 1985. 174p.
VACHAUD, G.; PASSERAT DE SILANS, A.; BALABANIS, P. & VAUCLIN, M. Temporal stability of spatially measured soil water probability density function. Soil Sci. Soc. Am. J., 49:822-827, 1985.
VIEIRA, S.R. Geoestatística em estudos de variabilidade espacial do solo. In: NOVAIS, R.F., ALVAREZ V., V.H. & SCHAEFER, G.R., eds. Tópicos em ciência do solo. Viçosa, MG, Sociedade Brasileira de Ciência do Solo, 2000. v.1, p.1-54.
VIEIRA, S.R.; HATFIELD, J.L.; NIELSEN, D.R. & BIGGAR, J.W. Geostatistical theory and application to variability of some agronomical properties. Hilgardia, 51:1-75, 1983. VIEIRA. S.R.; GREGO, C.R. & TOPP, G.C. Analyzing spatial and temporal variability of soil water content. Bragantia, 67:463-469, 2008.