* Corresponding author: E-mail: [email protected]
Received: March 12, 2015 Approved: November 18, 2015
How to cite: Islabão GO, Lima CLR, Vahl LC, Timm LC, Teixeira JBS. Hydro-Physical Properties of
a Typic Hapludult under the Effect
of Rice Husk Ash. Rev Bras Cienc Solo. 2016;v40:e0150161.
Copyright: This is an open-access article distributed under the terms of the Creative Commons Attribution License, which permits unrestricted use, distribution, and reproduction in any medium, provided that the original author and source are credited.
Hydro-Physical Properties of a Typic
Hapludult under the Effect of Rice
Husk Ash
Gláucia Oliveira Islabão(1)
, Cláudia Liane Rodrigues de Lima(2)
, Ledemar Carlos Vahl(2) , Luis Carlos Timm(2)
and Juliana Brito da Silva Teixeira(3)* (1)
Instituto Federal de Educação, Ciência e Tecnologia Farroupilha, Alegrete, Rio Grande do Sul, Brasil. (2)
Universidade Federal de Pelotas, Faculdade de Agronomia Eliseu Maciel, Departamento de Solos, Capão do Leão, Rio Grande do Sul, Brasil.
(3)
Universidade Federal de Pelotas, Programa de Pós-graduação em Manejo e Conservação do Solo e da Água, Pelotas, Rio Grande do Sul, Brasil.
ABSTRACT: The combustion of rice husk generates a partially burnt mixture called rice
husk ash (RHA) that can be used as a source of nutrients to crops and as a conditioner of soil physical properties. The objective of this study was to evaluate the effect of RHA levels on the hydro-physical properties of a Typic Hapludult. The experimental design was composed of random blocks with four replications, which comprised plots of 24 m2 and treatments with increasing RHA rates: 0, 40, 80 and 120 Mg ha-1
. Undisturbed soil samples were collected in the soil layers of 0.00-0.10 and 0.10-0.20 m after nine months of RHA application, using steel cylinders (0.03 m of height and 0.047 m of diameter). These samples were used to determine soil bulk density (Bd), total soil porosity (TP), soil macroporosity (Ma), soil microporosity (Mi) and the available water capacity (AWC). Disturbed soil samples were collected to determine the stability of soil aggregates in water, mean weight diameter of water stable aggregates (MWD), and soil particle size distribution. The results show that, as the RHA rate increased in the soil, Bd values decreased and TP, Ma and MWD values increased. No effect of RHA was found on Mi and AWC values. The effects of RHA on the S parameter (Dexter, 2004), precompression stress and compression index (Dias Junior and Pierce, 1995) values are consistent those shown for density and total porosity. Rice husk ash was shown to be an efficient residue to improve soil physical properties, mainly at rates between 40 and 80 Mg ha-1
. Rice husk ash reduces bulk density and increases total porosity, macroporosity and soil aggregation, but does not affect microporosity, field capacity, permanent wilting point, and available water capacity of the soil. The effect of rice husk ash on the S parameter, precompression stress and index compressibility coefficient values are consistent with those observed for the bulk density and total porosity.
Keywords: bulk density, soil porosity, available water capacity, soil compressibility,
soil aggregation.
INTRODUCTION
Brazil is among the top 10 producers of rice globally, with an annual production of 11.8 million tons of grain in the husk (Conab, 2013), of which 68.7 % is produced in Rio Grande do Sul (IRGA, 2014). Considering that rice husk takes up on average 22 % of the total weight of rice (Umamaheswaran and Batra, 2008), 2.6 million tons of rice husk are produced annually in Brazil. Due to its high calorific value and low cost, rice husk has been used as a source of energy (Capeletto, 2012) resulting in a new solid waste, the rice husk ash (RHA). Since RHA is equivalent to 17 % of the dry mass of the husk (Chandrasekhar et al., 2006), the production potential of RHA in Brazil is 0.44 million tons per year.
The most striking feature of RHA is the high content of amorphous silica, i.e. around 90 % SiO2 (Chandrasekhar et al., 2005). Thus, there has been intense research into technological processes for obtaining pure silica and other products for diverse uses (Gorthy and Mukunda, 1999; Chandrasekhar et al., 2005; Zemnukhova, 2005; Della, 2006). Rice husk ash is also used as an adsorbent material in wastewater treatment (Farook and Ravendran, 2000), as an additive in concrete and in the development of materials for construction (Gonçalves and Bergmann, 2007). However, the use of RHA on the industrial scale is still limited to a small fraction of the amount produced. Therefore, its use in agriculture is a very promising and appropriate disposal method for this waste.
The immediate effects of RHA in soil are acidity correction and supply of nutrients. The potential of RHA as a corrective for soil acidity and as a source of P and K for plants has been demonstrated, but rate are high rates are necessary (Silva et al., 2008; Islabão, 2013; Islabão et al., 2014). Such effects are expected due to the alkaline nature of RHA; as a crop residue, it has all the essential elements in its composition. However, due to the physical and chemical nature of RHA, it is not expected to react with the soil, thus the effects of RHA on physical properties of soil are not so obvious. Nevertheless, Salé et al. (1997), Ramesh et al. (2008) and Karmakar et al. (2009) observed that soil bulk density decreased following application of RHA. The RHA reduced resistance to penetration and increased total porosity and water availability (Masulili et al., 2010), although Pauletto et al. (1990) found that RHA does not affect soil water retention.
Compaction is a problem that limits the development and productivity of crops in many soils. In the Rio Grande do Sul, Typic Hapludult with sandy loam, the A horizon is usually has a density higher than 1.6 Mg m-3
, total porosity of approximately 35 % and macroporosity less than 10 %, as demonstrated by Teixeira et al. (1998), Cruz et al. (2003) and Dupont (2011).
In these soils, the hypothesis is that the RHA can modify the soil physical attributes to appropriate values for plants development. In view of this, the aim of this study was to evaluate the effect of RHA rates on some physical properties in the 0.00-0.20 m layer in a Typic Hapludult.
MATERIAL AND METHODS
The experimental design was a randomized complete block design with four replications, comprising plots of 24 m2
(6 × 4 m) and four treatments consisting of 0, 40, 80 and 120 Mg ha-1
as the RHA rate. In April 2010, RHA was applied to each experimental plot using a 0.80 × 0.60 × 0.54 m wooden box, with a total volume of 260 dm3
. Setting the average dry ash density value at 0.184 kg dm-3
, each box was estimated to have 48 kg of RHA (equivalent to 20 Mg ha-1
RHA). The use of the wooden box made it easy to carry and distribute RHA, which was incorporated using rotary tiller equipment at the 0.00-0.10 m layer.
For the chemical characterization of RHA, the content of silicon (Si) was determined by X ray fluorescence spectrometry (EDX-720). The organic carbon (Walkley-Black method) and total nitrogen (Kjeldahl method) contents of RHA as well its pH and calcium carbonate equivalent (CCE) were determined according to Tedesco et al. (1995). To determine the contents of K, Na, Ca, Mg, Al, P, S, Cu, Fe, Mn and Zn, samples were digested in bi-distilled nitric acid and hydrofluoric acid (PA) and the determination was carried out through inductively coupled plasma optical emission spectrometry (ICP OES) (Perkin Elmer Optima 4300 DV) at the Environmental and Industrial Chemistry Laboratory - LAQIA at Federal University of Santa Maria, Santa Maria, RS, Brazil. The chemical composition of the rice husk ash used in this study were in table 2.
Undisturbed soil samples were collected in the depth layers of 0.00-0.10 and 0.10-0.20 m, nine months after the application of RHA, using steel cylinders (0.03 m of height and 0.047 m of diameter). To determine the soil water retention curves (SWRC), in each layer, three replications were randomly taken along the plot, totaling 12 replications per treatment. Soil water contents (θ) were measured at the tensions of 1 and 6 kPa, using a tension table apparatus, and at the tensions of 10, 33, 102 and 1530 kPa using a Richards pressure chamber (Klute, 1986).
Soil total porosity (TP), macroporosity (Ma), microporosity (Mi) and soil bulk density (Bd) values were obtained according to Donagema et al. (2011). The available water capacity (AWC) was calculated considering θ obtained by SWRC and adjusted by the van Genuchten (1980) model at tensions of 10 kPa (taken as the field capacity) and 1,530 kPa (taken as the permanent wilting point) (Reichardt and Timm, 2012). The values of the S parameter (Dexter, 2004) were calculated based on the water retention curves (gravimetric water content), using the model of van Genuchten (1980) in an SWRC computer program (Dourado Neto et al., 2000).
pH(H2O) OC K
+
Ca+2
Mg+2
Na+
CECpH7.0 BS Clay Silt Sand
g dm-3
mmolc dm -3
% g kg-1
0.00-0.10 m
5.54 11.30 1.64 23.60 10.51 0.80 76.19 49.17 169 225 606
0.10-0.20 m
5.23 9.85 1.21 27.4 11.30 0.82 70.56 59.12 193 220 587
Table 1. Soil chemical properties and particle size distribution of a Typic Hapludult in the 0.00-0.10 and 0.10-0.20 m layers
pH in water (1:2.5); OC: organic carbon content (Walkley-Black method); K and Na: extracted by Mehlich-1; Ca and Mg: extracted by 1 mol L-1 KCl; CEC: cation exchange capacity (extracted by 0.5 mol L-1
calcium acetate pH 7.0); BS: base saturation; Clay, silt and sand: pipette method.
pH PN Si K Na Ca Mg Al C N P S Cu Fe Mn Zn
% g kg-1
mg kg-1
8.6 0.91 410.5 11.35 6.83 6.02 4.20 0.23 72.3 0.98 2.64 3.52 7.5 480 1278 34
PN: power neutralization.
Disturbed soil samples were also collected in the depths of 0.00-0.10 and 0.10-0.20 m to determine the stability of the aggregates in water and the particles size distribution particles (clay, sand and silt contents). To determine the distribution of the stable aggregates in water at different size classes and the mean weight diameter of water stable aggregates (MWD), samples were sieved through a 9.52 mm mesh, using the method described by Kemper and Rosenau (1986) and adapted by Palmeira et al. (1999), which employs the Yoder (1936) vertical oscillation device. The size distribution of soil particles and clay dispersed in water were determined by the pipette method (Gee and Bauder, 1986). Based on the clay and dispersed clay in water (DC) contents, the flocculation degree (FD) was also calculated.
For the uniaxial compression tests, samples were saturated through capillarity for 24 h and equilibrated at the tension of 10 kPa using pressure chambers. Subsequently, static pressures of 25, 50, 100, 200, 400, 800 and 1,600 kPa were applied, according to the method described by Silva et al. (2007), and the displacement at each applied pressure was recorded using an automatic consolidometer (Model CNTA-IHM/BR, Masquetto Automação Agrícola). The soil samples were oven dried at 105 o
C for 24 h and soil bulk density was calculated (Donagema et al., 2011). The soil compression curve was graphically constructed plotting the logarithm of the applied loads (x axis) and soil bulk density values (y axis) for each sample. Precompression stress (σp) and compressibility coefficient (Cc) values were calculated according to Dias Junior and Pierce (1995). In order to eliminate the initial soil compaction effect, soil compression curves were normalized by dividing the soil bulk density at the end of each applied pressure by the soil bulk density obtained in the field.
To evaluate the relationship between soil physical properties and rates of RHA, linear and quadratic models were fitted using the software Sigma Plot (Sigmaplot, 2004) using the F test at the 5 % significance level. Pearson correlation coefficients were assessed out to relate MWD and the physico-chemical properties of the soil under RHA.
RESULTS AND DISCUSSION
An increase in RHA rate caused a decrease in bulk density (Bd) in the 0.00-0.10 m layer, but there was no effect on Bd values in the 0.10-0.20 m layer (Figure 1a). An increase in the carbonized rice husk proportion resulted in a reduction in Bd was found by Guerrini and Trigueiro (2004). Figure 1a also shows that the mean value of Bd (1.68 Mg m-3
) when the RHA rate was 0 Mg ha-1
is very close to the critical Bd value (BDc) suitable for the development of a crop root system in sandy loam soils (1.70 to 1.80 Mg m-3
), as stated by Reichert et al. (2003). Using the equations proposed by Reichert et al. (2009) for estimating BDc based on the contents of clay or clay plus silt, for three methods of determination [considering the least limiting water range, values obtained under field conditions and equations developed by Jones (1983)], obtained values around 1.6 Mg m-3
. These values have similarities to this study.
With the increasing RHA rates, there was an increase in total soil porosity (Figure 1b) and macroporosity mean values (Figure 1c) in the 0.00-0.10 m layer. On the other hand, there was no effect of increased RHA rates on microporosity values measured in both soil layers (Figure 1d).
Rice husk ash is a low-density material (0.184 Mg m-3
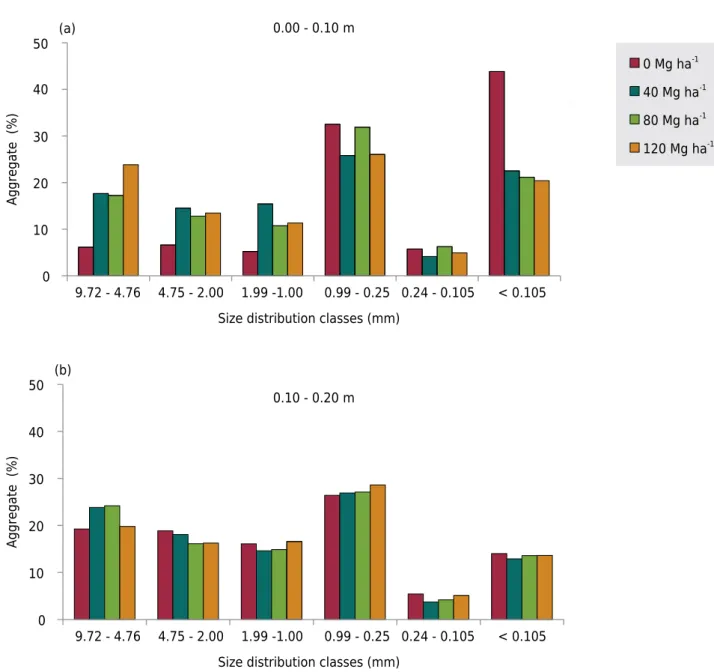
Rice husk ash increased the concentration of stable aggregates in water in the 0.00-0.10 m layer, presenting the greatest effect between the 0 and 40 Mg ha-1
rates (Figure 2a). The results show that, up to the third class aggregates (1.99-1.00 mm), aggregation remained stable with increasing application of RHA; that is, a higher RHA rate did not promote soil disaggregation. In the 0.10-0.20 m layer, certain uniformity in the concentration of stable aggregates in water was observed in different classes with an increase in RHA rate (Figure 2b). In studies with rice husk biochar, Lu et al. (2014) also founded an increase in macroaggregates with a diameter greater than 0.25 mm and a reduction in microaggregates with a diameter less than 0.25 mm.
In the 0.00-0.10 m layer, there was an increase in the MWD values with an increase in RHA rate (Figure 3). Lu et al. (2014) found that an increase in the rate of rice husk biochar resulted in higher values of MWD. This fact was attributed to a decrease in the aggregate breakdown by differential swelling and an increase in aggregate resistance to mechanical breakdown.
The highest MWD value presented in the 0.10-0.20 m layer was due to the prior management, as it had been tilled for at least five years. Compact soils can present high aggregate stability in water and, consequently, higher MWD values (Conte et al., 2011). Mean weight diameter of water stable aggregates values were positively related to the clay content in the soil in both layers. Clay is the most important granulometric fraction for soil aggregation. Physico-chemical processes of aggregation are mainly associated with the clay fraction (Brady and Weil, 2008).
The flocculation degree (FD) was positively related to the MWD in both layers, which might be explained by the relation between the clay and clay dispersed in water contents
Figure 1. Mean values of (a) soil bulk density (Bd), (b) total porosity (TP), (c) macroporosity (Ma) and (d) microporosity (Mi) of a Typic
Hapludult under different rates of rice husk ash in the 0.00-0.10 and 0.10-0.20 m layers. Vertical bars indicate the standard deviation.
Bd (Mg
m
-3 )
TP (%)
0.0 0.5 1.0 1.5 2.0
0.0 0.5 1.0 1.5 2.0
0 10 20 30 40 50 60 70
0 10 20 30 40 50 60 70
Ma (%
)
ŷ = 14.82 + 0.092x R2= 0.98
ŷ = 1.68 + 0.0034x R2= 0.96
ŷ = 45.43 + 0.10x R2= 0.99
0 20 40 60 80 100 120 140 0 20 40 60 80 100 120 140
Mi (%
)
0.00 - 0.10 m 0.10 - 0.20 m
0 20 40 60 80 100 120 140 0 20 40 60 80 100 120 140
Rice husk ash (Mg ha-1)
Rice husk ash (Mg ha-1)
Rice husk ash (Mg ha-1)
of the soil (Table 3). Clay content, and the clay dispersed in water (DC) did not present a significant correlation with MWD in any of the layers (Table 3).
As previously observed, in the 0.00-0.10 m layer, an increase in RHA rate increased TP and MWD but decreased Bd. This relation was confirmed in the MWD correlation with these variables; and increase in soil MWD increases TP and decreases Bd. The MWD in the 0.10-0.20 m layer was positively correlated to organic carbon (Table 3); this is due to the fact that the organic matter acts as an aggregation agent, mainly of macroaggregates (Tisdall and Oades, 1982). This relation between OC and MWD can be confirmed by the fact that the sub-superficial layer also presented higher MWD values.
In the 0.00-0.10 m layer, only for tensions lower than 6 kPa, there were changes in the soil water retention curve (WRC) with an increase of RHA rate (Figure 4a), possibly due to variations in soil macroporosity (Figure 1c). Probably due to the non-incorporation of ash in the 0.10-0.20 m layer, there was no significant variation in the WRC with an increase in RHA rate (Figure 4b).
Figure 2. Distribution of water stable aggregates per size classes of a Typic Hapludult under different rates of rice husk ash in the
0.00-0.10 (a) and 0.10-0.20 m (b) layers.
0 10 20 30 40 50
0.00 - 0.10 m
0.10 - 0.20 m
0 Mg ha-1
40 Mg ha-1
80 Mg ha-1
120 Mg ha-1
(a)
0 10 20 30 40 50
Size distribution classes (mm) Size distribution classes (mm)
9.72 - 4.76 4.75 - 2.00 1.99 -1.00 0.99 - 0.25 0.24 - 0.105 < 0.105
9.72 - 4.76 4.75 - 2.00 1.99 -1.00 0.99 - 0.25 0.24 - 0.105 < 0.105
(b)
Aggregate (%
)
Aggregate (%
No effect of the RHA rate was noted on the θCC and θPMP values (Figures 4a and 4b) and AWC in both layers evaluated (Figure 5), possibly due to the short time period of the experiment. Similar results were obtained by Pauletto et al. (1990) in Brazil. However, several studies showed higher AWD using higher rates of fly ash (Ramesh et al., 2008; Ukwattage et al., 2013; Lu et al., 2014; Ram and Masto, 2014).
The S parameter, which represents the soil water retention curve slope at its inflexion point, was revealed as a sensitive indicator to evaluate the effects of RHA rates on the soil physical quality (Figure 6). The S values in the 0.00-0.10 m layer were above of the 0.035 set by Dexter (2004) as being favorable to the growth of plant roots. In the same layer, it was found that RHA increased S values, becoming stable at the 80 Mg ha-1
. This fact might be related to the increase in total porosity and macroporosity in this layer (Figures 1b and 1c). In the 0.10-0.20 m layer, S values were below that 0.035, indicating, in this case, an unsuitable distribution of pore sizes, according to Dexter (2004). Despite of S is a static parameter, therefore implicitly unable to describe dynamic processes (van Lier, 2014), we agreed that further studies can be carried out in this area including the relationship with different soil properties.
After normalizing the compressibility curves, in the 0.00-0.10 m (Figure 7a) and 0.10-0.20 m (Figure 7b) layers, only the first layer showed deformation of the soil structure with the maximum rate from 200 kPa.
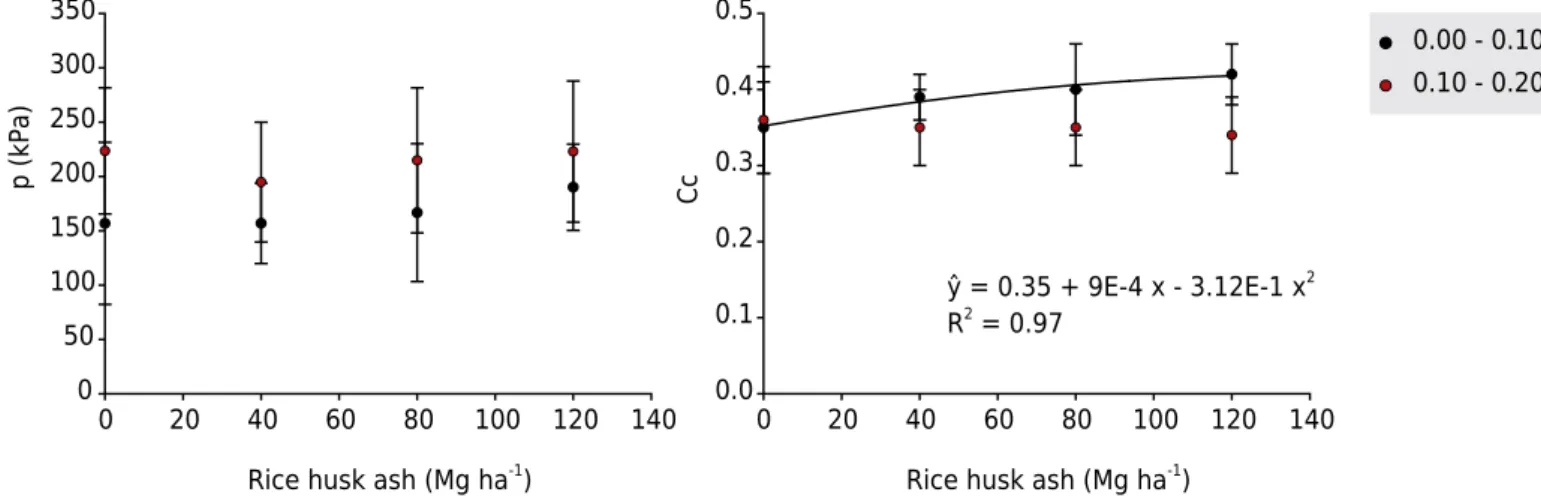
Lower precompression stress values (σp) were obtained and a higher compressibility coefficient was found in the 0.00-0.10 m layer (Figures 8a and 8b), confirming the effects of RHA regarding the decrease in Bd (Figure 1a) and consequent increase in TP (Figure 1b) and Ma (Figure 1c). These values are classified as extremely high by Horn and Fleige (2003). However, similar values (Rucknagel et al., 2010; Vogelmann et al., 2012) and higher (Lima et al., 2004) σp have been found in other agricultural areas.
DC Clay Bd TP FD OC
0.00 – 0.10 m
MWD r -0.02 0.46 -0.58 0.57 0.35 0.23
p 0.924 0.009 <0.001 <0.001 0.030 0.134
0.10 – 0.20 m
MWD r -0.10 0.305 -0.297 0.256 0.436 0.56
p 0.507 0.039 0.045 0.086 0.002 <0.001
DC: water dispersed clay; Bd: bulk density; TP: total porosity; FD: flocculation degree; OC: organic carbon.
Table 3. Coefficient of correlation (r) and probability (p) between the mean weight diameter (MWD)
and the soil physical properties of a Typic Hapludult at the 0.00-0.10 and 0.10-0.20 m layers
Figure 3. Mean weight diameter (MWD) of a Typic Hapludult under different rates of rice husk
ash in the 0.00-0.10 and 0.10-0.20 m layers.
0 20 40 60 80 100 120 140
MWD (mm)
0 1 2 3 4
0.00 - 0.10 m 0.10 - 0.20 m
Rice husk ash (Mg ha-1
Figure 4. Water retention curves adjusted using the van Genutchen model of a Typic Hapludult
under different rates of rice husk ash in the 0.00-0.10 (a) and 0.10-0.20 m (b) layers. The vertical dotted lines indicated the θCC (soil water content at field capacity, 10 kPa) and θPWP (soil water
content at wilting point, 1,500 kPa).
0.0 0.1 0.2 0.3 0.4 0.5 0.6
0.0 0.1 0.2 0.3 0.4 0.5 0.6
θ (m
3 m -3 )
θ (m
3 m -3 )
Ym(kPa)
0 Mg ha-1
40 Mg ha-1 80 Mg ha-1
120 Mg ha-1
Ym(kPa)
Figure 5. Available water capacity (AWC) of a Typic Hapludult under different rates of rice husk
ash at the layers 0.00-0.10 and 0.10-0.20 m. Vertical bars indicate the standard deviation.
θ (m
3 m
-3 )
0.00 0.02 0.04 0.06 0.08 0.10 0.12 0.14 0.16
0 20 40 60 80 100 120 140
Rice husk ash (Mg ha-1)
The parameters obtained from the uniaxial compression curve are relevant to the suitability of use practices, management and machine traffic, aiming to minimize soil degradation (Silva et al., 2002). The σp is related to the soil resistance to root penetration, and high values of precompression stress present a higher probability of reduced root growth (Pacheco and Cantalice, 2011).
Figure 6. S parameter of a Typic Hapludult under different rates of rice husk ash in the 0.00-0.10
and 0.10-0.20 m layers. The dotted line indicates the critical value for crop.
0.00 - 0.10 m 0.10 - 0.20 m
0.00 0.02 0.04 0.06 0.08 0.10 0.12
Slope (S
)
0 20 40 60 80 100 120 140
Rice husk ash (Mg ha-1)
Figure 7. Normalized compression curves of bulk density (Bd) versus applied loads of a Typic Hapludult under different rates of rice
husk ash in the 0.00-0.10 (a) and 0.10-0.20 m (b) layers.
0 Mg ha-1
40 Mg ha-1
80 Mg ha-1
120 Mg ha-1
s (kPa)
0,1 1 10 100 1000 10000
s (kPa)
0,1 1 10 100 1000 10000
0.9
1.0
1.1
1.2
1.3
1.4
1.5
Bd (Mg m
-3 )
0.9
1.0
1.1
1.2
1.3
1.4
1.5
Bd (Mg m
-3 )
Figure 8. Precompression stress (σp) (a) and compressibility coefficient (Cc) (b) of a Typic Hapludult under different rates of rice
husk ash in the 0.00-0.10 and 0.10-0.20 m layers. Vertical bars indicate the standard deviation.
50 100 150 200 250 300 350
p (kPa) Cc
0.1 0.2 0.3 0.4 0.5
ŷ = 0.35 + 9E-4 x - 3.12E-1 x2
R2
= 0.97
0.00 - 0.10 m 0.10 - 0.20 m
0 0.0
0 20 40 60 80 100 120 140 0 20 40 60 80 100 120 140
Rice husk ash (Mg ha-1
) Rice husk ash (Mg ha-1
The findings of this study might serve as a guide to the use of rice husk ash in soils similar to this. However, it is necessary to increase our knowledge on the physical and chemical mechanisms inherent to the observed effects.
CONCLUSIONS
Rice husk ash was shown to be an efficient residue to improve soil physical properties, mainly at rates between 40 and 80 Mg ha-1
.
Rice husk ash reduces bulk density and increases total porosity, macroporosity and soil aggregation, but does not affect microporosity, field capacity, permanent wilting point, and available water capacity of the soil.
The effect of rice husk ash on the S parameter, precompression stress and index compressibility coefficient values are consistent with those observed for the bulk density and total porosity.
ACKNOWLEDGMENTS
The authors are indebted to the National Council for Scientific and Technological Development (CNPq) and the Brazilian Federal Agency for Support and Evaluation of Graduate Education (CAPES) for funding and for scholarships.
REFERENCES
Brady N, Weil RR. The nature and properties of soils. 14th
ed. New Jersey: Prentice-Hall; 2008.
Capeletto GJ. Setor energético do Rio Grande do Sul: ênfase em fontes de energia primária.
In: Capeletto GJ, Moura GHZ, editores. Balanço energético do Rio Grande do Sul, 2012: ano
base 2011. Porto Alegre: Grupo CEEE, Secretaria de Infraestrutura e Logística do Rio Grande do Sul; 2012. p.35-38.
Chandrasekhar S, Pramada PN, Majeed J. Effect of calcination temperature and heating
rate on the optical properties and reactivity of rice husk ash. J Mater Sci. 2006;41:7926-33. doi:10.1007/s10853-006-0859-0
Chandrasekhar S, Pramada PN, Praveen L. Effect of organic acid treatment on the properties of
rice husk silica. J Mater Sci. 2005;40:6535-44. doi:10.1007/s10853-005-1816-z
Companhia Nacional de Abastecimento - Conab. Central de informações agropecuárias. 4º Levantamento de grãos da safra 2012/2013. Brasília, DF: 2013 [Acesssado em: dez. 2014]. Disponível em: http://www.conab.gov.br/OlalaCMS/uploads/arquivos/13_01_09_17_44_20_ boletim_graos_janeiro_2013.pdf.
Conte O, Wesp CL, Anghinoni I, Carvalho PCF, Levien R, Nabinger C. Densidade, agregação e frações de carbono de um Argissolo sob pastagem natural submetida a níveis de ofertas de forragem por longo tempo. Rev Bras Cienc Solo. 2011;35:579-87. doi:10.1590/S0100-06832011000200027
Cruz ACR, Pauletto EA, Flores CA, Silva JB. Atributos físicos e carbono orgânico de um Argissolo Vermelho sob sistemas de manejo. Rev Bras Cienc Solo. 2003;27:1105-12. doi:10.1590/S0100-06832003000600015
Della VP, Hotza D, Junkes JA, Oliveira APN. Estudo comparativo entre sílica obtida por lixívia ácida da casca de arroz e sílica obtida por tratamento térmico da cinza de casca de arroz. Quím Nova. 2006;29:1175-9. doi:10.1590/S0100-40422006000600005
Dexter AR. Soil physical quality: Part I. Theory, effects of soil texture, density, and organic matter, and effects on root growth. Geoderma. 2004;120:201-14.
doi:10.1016/j.geoderma.2003.09.004
Donagema GK, Campos DVB, Calderano SB, Teixeira WG, Viana JHM. Manual de métodos de análise de solos. 2ª. ed. Rio de Janeiro: Embrapa Solos; 2011.
Dourado Neto D, Nielsen DR, Hopmans JW, Reichardt K, Bacchi OOS. Software to model soil water retention curves (SWRC, version 2.00). Sci Agric. 2000;57:191-2. doi:10.1590/S0103-90162000000100031
Dupont PB. Qualidade física de um Argissolo sob diferentes sistemas de uso na Encosta do Sudeste do RS [dissertação]. Pelotas: Universidade Federal de Pelotas; 2011.
Farook A, Ravendran S. Saturated fatty acid adsorption by acidified rice hull ash. J Am Oil Chem
Soc. 2000;77:437-40. doi:10.1007/s11746-000-0070-0
Gee GW, Bauder JW. Particle-size analysis. In: Klute A, editor. Methods of soil analysis; physical and mineralogical methods. Madison: American Society of Agronomy; 1986. Pt 1. p.383-411.
Gonçalves MRF, Bergmann CP. Thermal insulators made with rice husk ashes; production and correlation between properties and microstructure. Constr Build Mater. 2007;21:2059-65. doi:10.1016/j.conbuildmat.2006.05.057
Gorthy P, Mukunda PG. Production of silicon carbide from rice husks. J Am Ceram Soc. 1999;82:1393-400. doi:10.1111/j.1151-2916.1999.tb01929.x
Guerrini IA, Trigueiro RM. Atributos físicos e químicos de substratos compostos por biossólidos e casca de arroz carbonizada. Rev Bras Cienc Solo. 2004;28:1069-76. doi:10.1590/S0100-06832004000600016
Horn R, Fleige H. A method for assessing the impact of load on mechanical stability and on physical properties of soils. Soil Till Res. 2003;73:89-99. doi:10.1016/S0167-1987(03)00102-8
Instituto Rio-grandense do Arroz – IRGA. Relatório final de colheita do arroz irrigado no Rio
Grande do Sul - áreas e produções municipais - safra 2013/2014 [acessado em: dez. 2014]. Disponível em: http://www.irga.rs.gov.br/uploads/anexos/1313154576Area_Producao_e_ Produtividade.pdf.
Islabão GO, Vahl LC, Timm LC, Paul DL, Kath AH. Rice husk ash as corrective of soil acidity. Rev Bras Cienc Solo. 2014;38:934-41. doi:10.1590/S0100-06832014000300025
Islabão GO. Uso da cinza de casca de arroz como corretivo e condicionador do solo [tese]. Pelotas: Universidade Federal de Pelotas; 2013.
Karmakar S, Mittra BN, Ghosh BC. Influence of industrial solid wastes on soil-plant. Interaction
in rice under acid lateritic soil. In: World of Coal Ash (WOCA) Conference; 2009; Lexington. Lexington, KY: 2009. p.1-13.
Kemper WD, Rosenau RC. Aggregate stability and size distribution. In: Klute A, editor. Methods of soil analysis; physical and mineralogical methods. Madison: American Society of Agronomy; 1986. Pt 1. p.425-42.
Klute A. Water retention: laboratory methods. In: Black CA, editor. Methods of soil analysis; Physical and mineralogical methods. Madison: American Society of Agronomy; 1986. p.635-62.
Lima CLR, Silva AP, Imhoff S, Leão TP. Compressibilidade de um solo sob sistemas de
pastejo rotacionado intensivo irrigado e não irrigado. Rev Bras Cienc Solo. 2004;28:945-51. doi:10.1590/S0100-06832004000600002
Lu SG, Sun FF, Zong YT. Effect of rice husk biochar and coal fly ash on some physical properties
of expansive clayey soil (Vertisol). Catena. 2014;114:37-44. doi:10.1016/j.catena.2013.10.014
Masulili A, Utomo WH, Syechfani MS. Rice husk biochar for rice based cropping system
in acid soil. The characteristics of rice husk biochar and its influence on the properties of
acid sulfate soils and rice growth in west Kalimantan, Indonésia. J Agric Sci. 2010;2:39-47. doi:10.5539/jas.v2n1p39
Palmeira PRT, Pauletto EA, Teixeira CFA, Gomes AS, Silva JB. Agregação de um Planossolo submetido a diferentes sistemas de cultivo. Rev Bras Cienc Solo. 1999;23:189-95. doi:10.1590/S0100-06831999000200001
Pauletto EA, Nachtigall GR, Guadagnin CA. Adição de cinza de casca de arroz em dois solos do município de Pelotas, RS. Rev Bras Cienc Solo. 1990;14:255-8.
Ram LC, Masto RE. Fly ash for soil amelioration: A review on the influence of ash
blending with inorganic and organic amendments. Earth Sci Rev. 2014;128:52-74. doi:10.1016/j.earscirev.2013.10.003
Ramesh V, Korwar GR, Mandal UK, Prasad JVNS, Sharma KL, Yezzu SR, Kandula V. Influence of fly ash mixtures on early tree growth and physicochemical properties of soil in semi-arid tropical Alfisols. Agrofor Syst. 2008;73:13-22. doi:10.1080/03601234.2012.669288
Reichardt K, Timm LC. Solo, planta e atmosfera: Conceitos, processos e aplicações. 2ª. ed. São Paulo: Manole; 2012.
Reichert JM, Reinert DJ, Braida JA. Qualidade dos solos e sustentabilidade de sistemas agrícolas. Cienc Amb. 2003;27:29-48.
Reichert JM, Suzuki LEAS, Reinert DJ, Horn R, Hakansson I. Reference bulk density and critical degree-of-compactness for no-till crop production in subtropical highly weathered soils. Soil Till Res. 2009;102:242-54. doi:10.1016/j.still.2008.07.002
Rucknagel J, Brandhuber R, Hofmann B, Lebert M, Marschall, K, Paul R, Stock O, Christen O. Variance of mechanical precompression stress in graphic estimations using the Casagrande method and derived mathematical models. Soil Till Res. 2010;106:165-70. doi:10.1016/j.still.2009.11.001
Salé LY, Chanasyk DS, Naeth MA. Temporal influence of fly ash on select soil physical
properties. Can J Soil Sci. 1997;77:677-83. doi:10.4141/S96-078
Santos HG, Jacomine PKT, Anjos LHC, Oliveira VA, Oliveira JB, Coelho MR, Lumbreras JF, Cunha
TJF. Sistema brasileiro de classificação de solos. 3ª. ed. Rio de Janeiro: Embrapa Solos; 2013.
van Lier QJ. Revisiting the S-index for soil physical quality and its use in Brazil. Rev Bras Cienc Solo. 2014;38:1-10. doi:10.1590/S0100-0683201400010000
Sigmaplot for Windows. Version 9.1. San Jose, CA: Systat Software; 2004.
Silva FF, Bertonha A, Freitas PSL, Muniz AS, Ferreira RC. Aplicação de cinza da casca de arroz e de água residuária de fecularia de mandioca na cultura de aveia. Rev Agroneg Meio Amb. 2008;1:25-36.
Silva RB, Masquetto BJ, Lanças KP. Desenvolvimento e automação de um consolidômetro com interface homem máquina. In: Anais do 31º Congresso Brasileiro de Ciência do Solo [CD-ROM]; 2007; Gramado. Gramado: Sociedade Brasileira de Ciência do Solo; 2007.
Silva VR, Reinert DJ, Reichert JM. Fatores controladores da compressibilidade de
um Argissolo Vermelho-Amarelo distrófico arênico e de um Latossolo Vermelho distrófico típico. II – Grau de saturação em água. Rev Bras Cienc Solo. 2002;26:9-15.
doi:10.1590/S0100-06832002000100002
Soil Survey Staff. Keys to soil taxonomy. 12th
ed. Washington, DC: United States Department of Agriculture, Natural Resources Conservation Service; 2014.
Tedesco MJ, Gianello C, Bissani CA, Bohnen H, Volkweiss SJ. Análises de solo, plantas e outros materiais. 2ª. ed. Porto Alegre: Universidade Federal do Rio Grande do Sul: 1995.
Teixeira CFA. Influência de sistemas de cultivo em plantio direto em alguns atributos físicos de
um Podzólico Vermelho-Amarelo [dissertação]. Pelotas: Universidade Federal de Pelotas; 1998.
Tisdall JM, Oades JM. Organic matter and water stable aggregates in soil. J Soil Sci. 1982;33:141-63. doi:10.1111/j.1365-2389.1982.tb01755.x
Ukwattage NL, Ranjith PG, Bouazza M. The use of coal combustion fly ash as a soil amendment
Umamaheswaran K, Batra VS. Physico-chemical characterization of Indian biomass ashes. Fuel. 2008;87:628-38. doi:10.1021/ef5027373
van Genuchten, MTh. A closed-form equation for predicting the hydraulic conductivity of unsaturated soils. Soil Sci Soc Am J. 1980;44:892-7. doi:10.2136/sssaj1980.03615995004400050002x
Vogelmann ES, Mentges MI, Reichert JM, Rosa DP, Barros CAP, Reinert DJ. Compressibilidade
de um Argissolo Vermelho-Amarelo trafegado e escarificado. Cienc Rural. 2012;42:291-7.
doi:10.1590/S0103-84782012005000004
Yoder RA. A direct method of aggregate analysis of soil and a study of the physical nature of erosion losses. Agron J. 1936;28:337-51. doi:10.2134/agronj1936.00021962002800050001x
Zemnukhova LA, Fedorishcheva GA, Egorov AG, Sergienko VI. Recovery conditions, impurity