ISSN: 1809-4430 (on-line)
_________________________
1 Engº Agrônomo, Doutorando, Programa de Pós-Graduação em Produção Vegetal no Semiárid o, Universidade Estadual de Montes
Claros/Janaúba-MG, agrotecnico10@yahoo.com.br
2 Engº Agrônomo, Prof. Doutor, Departamento de Ciências Agrárias, Universidade Estadual de Montes Claros/Janaúba-MG, Fone:
(38)3821-1378, silvaniors@yahoo.com.br
3 Engº Agrônomo, Prof. Doutor, Departamento de Ciências Agrárias, Universidade Estadual de Montes Claros/Janaúba-MG, Fone:
(38)3821-1378, marcos.kondo@unimontes.br
4 Engº Agrônomo, Prof. Doutor, Instituto de Ciências Agrárias - ICA, UFMG, Avenida Universitária, 1.000 – Bairro
Universitário/Montes Claros – MG, rodinei_pegoraro@yahoo.com.br
5 Engº Agrônomo, Mestrando, Departamento de Engenharia Agrícola, Universidade Federal de Viçosa / Viçosa – MG,
agroeda@yahoo.com.br
SOIL PHYSICAL ATTRIBUTES IN CHEMIGATED BANANA PLANTATION WITH WASTEWATER
Doi:http://dx.doi.org/10.1590/1809-4430-Eng.Agric.v35n6p 998-1008/2015
PABLO F. S. ALVES1, SILVÂNIO R. DOS SANTOS2, MARCOS K. KONDO3,
RODINEI F. PEGORARO4, EDCÁSSIO D. ARAÚJO5
ABSTRACT: The feasibility of using sewage wastewater as a water and nutrient source for plants
is an alternative to harness agricultural natural resource, observing its influence on the organic matter dynamics and soil energy. Our objective here was to evaluate the effects of applying different doses of effluent from a sewage treatment plant, in Janaúba – MG, Brazil, over the
physical attributes of a soil grown with “Prata Anã” banana. From soil sample collection at depths
of 0-20, 20-40, and 40-60 cm, we determined the following soil properties: soil density, total porosity, macroporosity, microporosity, organic matter, clay dispersed in water and stability of soil aggregate. The experimental design was in randomized blocks with four repetitions. Wastewater raising doses promoted increase in suspended solids, contributing to macroporosity reduction at 20-40 and 20-40-60 cm depths; as well as a reduction in organic matter within 0-20 cm layer. Clay dispersal was observed in the depths of 0-20 cm, being derived from an increase in sodium content. Concurrently, there was a reduction of soil aggregate stability.
KEYWORDS: Musa spp, agricultural reuse of effluents, environmental sanitation, semi-arid.
ATRIBUTOS FÍSICOS DO SOLO EM BANANAL FERTIRRIGADO COM ÁGUA RESIDUÁRIA SANITÁRIA TRATADA
RESUMO:A utilização de água residuária proveniente do tratamento de esgoto, como fonte hídrica
e nutricional para as plantas, é uma alternativa para racionalizar o aproveitamento do recurso natural na agricultura, observando-se sua influência sobre a dinâmica da matéria e da energia no solo. O objetivo deste trabalho foi avaliar os efeitos da aplicação de diferentes doses de efluente da estação de tratamento de esgoto de Janaúba - MG, sobre os atributos físicos de um solo cultivado
com banana ‘Prata-Anã’. A partir da coleta de amostras de solo, nas profundidades de 0-20; 20-40 e 40-60 cm, foram avaliados os seguintes atributos: densidade do solo, porosidade total, macroporosidade, microporosidade, matéria orgânica, argila dispersa em água e a estabilidade de agregados do solo. O delineamento experimental foi o em blocos casualizados, com quatro repetições. O aumento das doses de água residuária sanitária tratada no solo promove: a) Incremento nos sólidos suspensos aportados ao solo, o que contribui para a redução da macroporosidade nas profundidades de 20-40 e 40-60 cm do solo; b) Redução da matéria orgânica na profundidade de 0-20 cm do solo; c) Aumento do aporte de sódio, o que determina a dispersão de argilas na profundidade de 0-20 cm, e d) Redução da estabilidade de agregados do solo.
INTRODUCTION
Having in perspective the reduction of hydric offer in terms of not only quantity but also quality for the most varied means, the adequate use and management of water has become indispensable. The use of urban waste, mainly the domestic sewage in agriculture is an important source of water and nutrients. Their inadequate destination may contribute to the increase of costs concerning water treatment headed for human consumption. According to VARALLO et al. (2012), the hydric bodies are considered natural purifier of the man-generated waste. However, this very common practice is compromises the quality of the environment.
Besides that, the destination of domestic sewage in watercourses is pointed out (BARROSO & WOLFF, 2011) as one of the main causes of diseases related to hydric association, especially in areas close to urban centers. The use of domestic sewage in agriculture as a source of water and/or nutrients would be an alternative to minimize its inappropriate destination. Nevertheless, this practice must be done with criteria. Frequent applications in association to high leve ls might influence the physical attributes of the soil, such as its density, structure and stability of aggregates, the aeration, draining and water retention (ERTHAL, et al. 2010; SAMPAIO et al., 2010 e SOUZA
et al., 2010).
Knowing the physical attributes alterations of the soil is fundamentally important because they cause an impact on the use and handling of it, providing information about its quality and productive capacity (ARATANI et al., 2009).
Another factor to be considered when handling the wastewater is the crop to be used. The banana tree besides being a highly demanding plant in nutrients is also sensitive to growing factors concerning the soil physical traits, such as the aeration, soil density, water retention and mechanical resistance to growing roots (COSTA et al., 2011; MIOTTI et al., 2013).
Our objective is to evaluate the behavior of the soil physical attributes influenced by the use of treated wastewater (TWW) in soils cultivated with banana tree OF “Prata Anã” variety.
MATERIAL AND METHODS
This procedure was carried out in the experimental area of the Sewage Treatment Plant (ETE) of the MINAS GERAIS Sewage Company, COPASA, MG in Janaúba – MG, Brazil (15º 49' 53'' S, 43º 16' 20'' W, altitude of 540 m). Local climate is tropical with dry winter (Aw) according to Köppen.
The soil used in the experiment is classified as a eutrophic Red Latosol (Oxisol) (EMBRAPA, 2013). The area showed anthropic degradation signs, an evidence for a poor handling pasture and soil compaction according to Table 1. This way, subsoiling, aeration, harrowing, and ridging were done before planting.
The experimental design was a randomized complete block with four replications. Treatments consisted of different doses of treated wastewater (TWW) from a sewage treatment plant (STP), using as reference an annual ceiling (AC) of 150 kg ha-1 of sodium (Na) (LARCHER, 2005) in the soil. They were named as T1: control (clean water + mineral fertilizing); T2: 70 %; T3: 130 %; T4: 170 % and; T5: 200 % of TWW in relation to AC reference.
TABLE 1. Soil physical and chemical properties (eutrophic Red Latosol – Oxisol) at different depths before banana orchard planting.
Depth Ds Dp Pt VCS CS MS FS VFS Total Sand Silt Clay
(m) ___g cm-3 _____ m3 m-3 ______________________ g kg-1 ___________________________
0 - 20 1.77 2.58 0.31 20 85 150 180 86 521 185 294 20 - 40 1.66 2.54 0.34 20 75 143 177 79 494 172 334 40 - 60 1.57 2.53 0.37 19 67 126 153 75 441 157 403 60 - 80 1.52 2.62 0.42 19 62 109 144 78 411 210 379
Depth pH 1OM 2P 2K 2Na 3Ca 3Mg 3Al 4H+Al 5BS 6T
(cm) (H2O) dag kg-1 ___ mg d m-3 ___ _________________ cmolc d m-3 ____________________
0 - 20 6.2 1.3 2.3 260 0.1 2.8 0.9 0 2.2 4.5 6.7
20 - 40 5.5 0.7 2.0 140 0.1 2.2 0.7 0 2.2 3.4 5.6
Depth 7V 8m 9B 2Cu 2Fe 2Mn 2Zn 10P-rem 11EC
(cm) _____ % _____ _______ mg dm-3 ____________ mg L-1 dS m-1
0 - 20 67 0 0.3 1.0 23.7 10.8 0.8 35.2 0.3
20 - 40 61 0 0.4 0.9 24.8 3.9 0.4 30.6 0.2
Ds: soil bulk density; Dp: particle density; Pt: total porosity; VCS: very coarse sand; CS: coarse sand; MS: medium sand; FS: fine sand; VFS: very fine sand; 1Organic matter determined through colorimetry; 2Mehlich Extractor-1; 3KCl - 1 mo1 L-1; 4Estimator:
SMP pH; 5BS: base sum; 6T: CEC at pH 7; 7V: base saturation; 8m: aluminum saturation; 9Extractor: BaCl
2;10Remaining phosphorus,
determined in balance solution of P; 11EC: Electric conductivity of saturated soil extract, in proportion of 1 (soil): 0.5 (water).
We used “PRATA ANÔ banana variety. The trees were planted on 05/05/2012, using micropropagated seedlings in a 3 x 2 spacing, having 4 rows with 6 plants per row, totalizing 24 plants per plot.
Fifteen days before, base fertilization was carried using a soil mixture with NPK formulation (4-30-10), simple superphosphate and FTE BR12. This was made aiming to supply N (22.8 kg ha-1), P2O5 (200.0 kg ha-1), K2O (50.0 kg ha-1), S (48.6 kg ha-1), Ca (103.9 kg ha-1), B (1.5 kg ha-1), Cu (0.7 kg ha-1), Mn (1.7 kg ha-1), Mo (0.1 kg ha-1) and Zn (7.5 kg ha-1), within plantation furrows at the spacing previously defined.
The TWW applications started forty-one days after plantation (DAP) with a weekly application via irrigation system (micro sprinkling). After TWW application, water supplementation was made to fulfill plant demands. In the third month, chemical fertilizing was initiated via chemigation system with nitrogen and potassium, aiming at controlling and complementing treatments that received effluent for a balanced supply (similar doses) of these nutrients.
Irrigation was based on daily reference evapotranspiration (ET0), calculated by the Penman-Monteith method (ALLEN et al., 2006), using data gathered in a portable meteorological station installed in an experimental area. By multiplying the ET0 by the crop coefficient (Kc), the location coefficient (Kl) and the soil coefficient (KS), we could obtain the crop evapotranspiration (ETc). This value associated with application efficiency (Ea) and nozzle mean flow (qa) are used to estimate gross and net depths, as well as working time. Micro sprinkling had an Ea equal to 97%, consisted of a nozzle with mean flow of 76 L h-1 at service pressure of 200 kPa, using one nozzle for every three plants. Other farming practices followed crop recommendations.
Simple TWW samples were collected monthly at the end of one of the lateral row during application time, and packed in appropriate recipients. They were properly identified and sent to the laboratory for analysis of total nitrogen, nitrogen ammonia, nitrate nitrogen, organic nitrogen, potassium, sodium, phosphorus, zinc, copper, iron, manganese, boron, chloride, cobalt, calcium, magnesium, electrical conductivity, chemical oxygen demand, biochemistry oxygen demand, oils and grease, total suspended soils, total coliforms, Escherichia coli, following methodologies
described inAPHA et al. (2012). Having in hand the results of TWW analysis from the previous
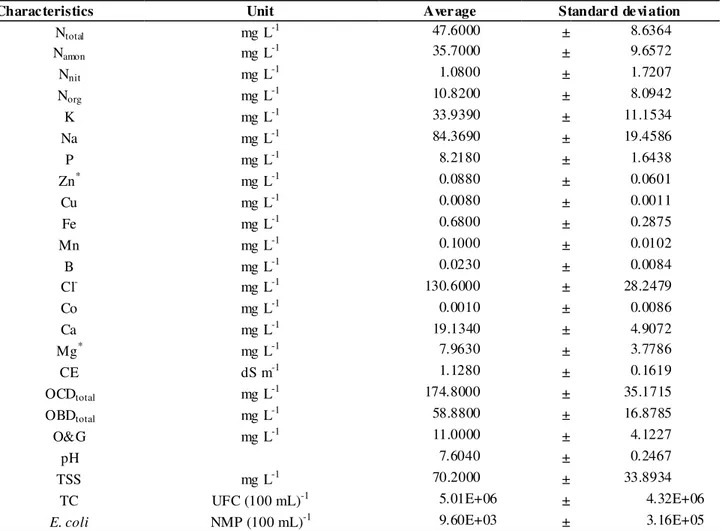
TABLE 2. Chemical characteristics of treated wastewater provided by the Sewage Treatment Plant of Janaúba and collected from June 2012 to June 2014.
Characteristics Unit Average Standard deviation
Ntotal mg L-1 47.6000 ± 8.6364
Namon mg L-1 35.7000 ± 9.6572
Nnit mg L-1 1.0800 ± 1.7207
Norg mg L-1 10.8200 ± 8.0942
K mg L-1 33.9390 ± 11.1534
Na mg L-1 84.3690 ± 19.4586
P mg L-1 8.2180 ± 1.6438
Zn* mg L-1 0.0880 ± 0.0601 Cu mg L-1 0.0080 ± 0.0011 Fe mg L-1 0.6800 ± 0.2875
Mn mg L-1 0.1000 ± 0.0102
B mg L-1 0.0230 ± 0.0084
Cl- mg L-1 130.6000 ± 28.2479
Co mg L-1 0.0010 ± 0.0086 Ca mg L-1 19.1340 ± 4.9072
Mg* mg L-1 7.9630 ± 3.7786 CE dS m-1 1.1280 ± 0.1619
OCDtotal mg L-1 174.8000 ± 35.1715
OBDtotal mg L-1 58.8800 ± 16.8785
O&G mg L-1 11.0000 ± 4.1227
pH 7.6040 ± 0.2467
TSS mg L-1 70.2000 ± 33.8934 TC UFC (100 mL)-1 5.01E+06 ± 4.32E+06
E. coli NMP (100 mL)-1 9.60E+03 ± 3.16E+05
Ntotal: total nitrogen; Namon: nitrogen ammonia Nnit: nitrate nitrogen; Norg: organic nitrogen; K: potassium; Na: sodium; P:
phosphorus; Zn: zinc; Cu: copper; Fe: iron; Mn: manganese; B: boron; Cl-.chloride; Co: cobalt; Ca: calcium; Mg: magnesium; CE:
electrical conductivity; OCDtotal: oxygen chemical demand; OBDtotal: oxygen biochemical demand; O&G: oil and grease; TSS: total
suspended soils; TC: total coliforms; E. coli: Escherichia coli; *: Only quantified from 02/2013.
The supply of the main elements of TWW and nutrients supplied to the soil via fertigation, as well as wastewater depths and clean water in the planting period until 586 days after planting (DAP) are described in Table 3.
After 586 days of plantation, ditches to a depth of 60 cm were open in the central area of the experimental plots to collect soil samples at 0-20, 20-40 and 40-60 cm layers, for further physical hydric analysis of the soil. For doing so, an Uhland sampler and rings with known volumes were used.
For the aggregate stability analysis, samples with undisturbed structure in clod shape (approximately 7 cm diameter) were withdrawn.
TABLE 3.Depths, nutrients and components supplied to the soil (eutrophic Red Latosol – Oxisol) at each treatment, from banana orchard planting up to the following 586 days.
Depths
Treatment TWW ——————————————Rain mm CI ——————————————Total
Control 0 658.7 3190.2 3848.9
70 178.8 658.7 3011.4 3848.9
130 351.2 658.7 2839.0 3848.9
170 438.3 658.7 2751.9 3848.9
200 522.3 658.7 2667.9 3848.9
Nutrients supplied to the soil (kg ha-1)
Treatments ——— Ntotal ——— ——— P2O5 ——— ——— K2O ——— ——— Na ———
MF TWW Total MF TWW Total MF TWW Total MF TWW Total Control 359.5 0.0 359.5 241.7 0.0 241.7 420.0 0.0 420.0 0.0 0.0 0.0
70 243.8 160.9 404.7 233.5 42.2 275.7 349.7 86.3 436.0 0.0 163.3 163.3 130 212.6 202.4 415.0 225.3 82.5 307.8 280.0 168.6 448.6 0.0 320.3 320.3 170 197.4 224.4 421.8 221.3 103.3 324.6 245.9 210.6 456.5 0.0 400.6 400.6 200 181.7 244.5 426.2 217.0 123.0 340.0 211.3 250.7 462.0 0.0 476.9 476.9
Components supplied to the soil (kg ha-1) via TWW
Treatments —————— O&G —————— ——————— TSS ———————
Year 1 Year 2 Total Year 1 Year 2 Total
Control 0.0 0.0 0.0 0.0 0.0 0.0
70 15.4 5.1 20.5 110.7 34.3 145.0
130 30.4 9.8 40.2 220.5 66.4 286.9
170 37.4 12.3 49.7 273.2 84.6 357.8
200 44.8 14.8 59.6 326.7 100.3 427.0
TWW: Treated wastewater; Rain: effective precipitation; CI: complementary irrigation; Total: total depths applied to the experimental plots; MF: mineral fertilization; Ntotal: total nitrogen available to the crop; P2O5: phosphorus; K2O: potassium; Na:
sodium; O&G: oils and grease; TSS: total suspended soils; Control: clean water and mineral fertilization; 70: 70%; 130: 130%; 170: 170%; 200: 200% supply limit (LARCHER, 2005) of sodium in the soil through TWW (150 kg ha-1 year-1).
The clods were manually crushed and sifted in a set of sieves with meshes of 8 and 2 mm. Later, clumps retained on the 2 mm mesh sieve were sorted into two subsamples with 25 g each. One of these samples was used to determine moisture content and the other was placed on a Petri dish with a damp filter paper. After 12 hours, these samples were taken for stirring in a vertical mixer (YODER), under a set of sieves (2, 1, 0.5, 0.25, 0.106 mm mesh) for 15 minutes, with 30 oscillations per minute. After that, the retained aggregates in each sieve were transferred to aluminum recipients, dried in an oven at 105-110 °C and then weighed.
According to the methodology proposed by KEMPER & ROSENAU (1986), the following soil aggregate indexes were determined: weighted mean diameter (WMD), geometric mean diameter (GMD), macro and micro aggregate percentages (MacAgr and MicAgr).
Data underwent variance analysis and, when F was significant at 5% probability, regression analysis was performed. For the comparison of treatment means against control, the Dunnett test was used at a 5% significance. Besides, the Person’s linear correlation analysis was held to check the correlation among the characteristics. Soil depths were compared separately.
RESULTS AND DISCUSSION
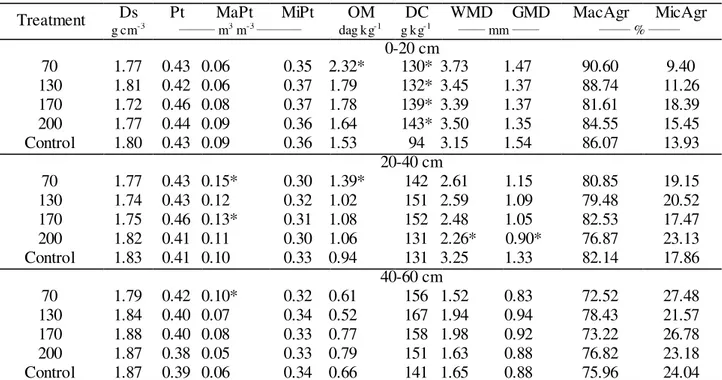
In general, the physical attributes influenced by TWW compared to clean water were DC, MaPt, WMD and GMD (Table 4).
This way, soil density elevation comes from grain-size related factors such as a large amount of fine sand (FS) within total sand fraction in contrast to the other fractions as medium sand fraction (MS), coarse sand (CS) and very coarse sand (VCS) (Table 1). This result validate the findings of LUCIANO et al. (2012), who worked with two Humic Cambisols and two Litholic Neosols (Humic Litholic Nitosol and Dystrophic Litholic Neosol).
TABLE 4. Treatment means and Dunnett test for the soil physical properties (eutrophic Red Latosol - Oxisol) chemigated with treated wastewater (586 days after plantation).
Treatment g cmDs -3 Pt ________ mMaPt 3 m-3 __________MiPt dag kgOM -1 g kgDC WMD GMD MacAgr -1 ______ mm ______ _______ % _______MicAgr
0-20 cm
70 1.77 0.43 0.06 0.35 2.32* 130* 3.73 1.47 90.60 9.40
130 1.81 0.42 0.06 0.37 1.79 132* 3.45 1.37 88.74 11.26
170 1.72 0.46 0.08 0.37 1.78 139* 3.39 1.37 81.61 18.39
200 1.77 0.44 0.09 0.36 1.64 143* 3.50 1.35 84.55 15.45
Control 1.80 0.43 0.09 0.36 1.53 94 3.15 1.54 86.07 13.93
20-40 cm
70 1.77 0.43 0.15* 0.30 1.39* 142 2.61 1.15 80.85 19.15
130 1.74 0.43 0.12 0.32 1.02 151 2.59 1.09 79.48 20.52
170 1.75 0.46 0.13* 0.31 1.08 152 2.48 1.05 82.53 17.47
200 1.82 0.41 0.11 0.30 1.06 131 2.26* 0.90* 76.87 23.13
Control 1.83 0.41 0.10 0.33 0.94 131 3.25 1.33 82.14 17.86
40-60 cm
70 1.79 0.42 0.10* 0.32 0.61 156 1.52 0.83 72.52 27.48
130 1.84 0.40 0.07 0.34 0.52 167 1.94 0.94 78.43 21.57
170 1.88 0.40 0.08 0.33 0.77 158 1.98 0.92 73.22 26.78
200 1.87 0.38 0.05 0.33 0.79 151 1.63 0.88 76.82 23.18
Control 1.87 0.39 0.06 0.34 0.66 141 1.65 0.88 75.96 24.04
For each depth, means followed by an asterisk (*) differ from control by the Dunnett test at 5% significance. Ds: Soil bulk density; Pt: Total porosity; MaPt: Total macroporosity; MiPt: Total microporosity; OM: Organic matter; DC: Water-dispersed clay; WMD: Weighted mean diameter; GMD: Geometric mean diameter; MacAgr: Macro aggregates; MicAgr: Micro aggregates.
TABLE 5. Person´s linear correlations among soil physical properties (eutrophic Red Latosol – Oxisol) chemigated with treated wastewater.
Pt MaPt MiPt OM DC WMD GMD MacAgr MicAgr
Ds -0.88** -0.41** -0.1ns -0.31* 0.07ns -0.4** -0.32* -0.15ns 0.15ns
Pt 0.45** 0.15ns 0.42** -0.03ns 0.45** 0.35** 0.17ns -0.17ns
MaPt -0.55** -0.06ns 0.06ns -0.01ns -0.07ns -0.14ns 0.14ns
MiPt 0.41** -0.06ns 0.41** 0.45** 0.34** -0.34**
OM -0.37** 0.72** 0.65** 0.51** -0.51**
DC -0.36** -0.39** -0.26* 0.26*
WMD 0.87** 0.67** -0.67**
GMD 0.64** -0.64**
MacAg -1.00**
Ds: soil bulk density; Pt: total porosity; MaPt: total macroporosity; MiPt: total microporosity; OM: organic matter; DC: water-dispersed clay; WMD: weighted mean diameter; GMD: geometric mean diameter; MacAgr: macro aggregates; MicAgr: micro aggregates.
**, *: 1 and 5 % significance by t-test, respectively. ns: non-significant.
Macro porosity (MaPt) in the depths of 20-40 and 40-60 cm was superior in chemigated soil with the smaller TWW doses in relation to control (Table 4). However, in Figure 1A, we can observe a linear effect of macroporosity reduction at 0.0003 m3 m-3 for each percentage unit of TWW dose increase.
FIGURE 1. Macro porosity (A), organic matter (B), macro aggregate percentage (C) and micro aggregate (D) of a eutrophic Red Latosol (Oxisol) chemigated with treated wastewater.
Once macroporosity is essential for soil aeration and the development of plants, it can be concluded that high doses of TWW had a negative effect on soil quality. According to LIMA et al. (2007), macroporosity soil ranges between 0.170 and 0.250 m3 m-3, with its critical value at least 0.10 m3 m-3 (KIEHL, 1979).
In accordance with SOUZA et al. (2010), in relation to the soil total porosity and its subdivisions, macroporosity and microporosity, the main interferences through the handling of wastewater would happen because of the suspended solids in sanitary sewer. This way, the relation with the highest values of MaPt obtained with the smaller doses of TWW are possibly related to the supply to the soil of organic substances that are part of TWW. However, the increase of TWW doses and consequent raise of supply to the total suspended solids (TSS) and oils and grease (Table 3). It can be associated to a possible dispersed clay eluviation at 0-20 cm, causing pore clogging and consequent porosity reduction at 20-40 cm and at 40-60 cm. RODRIGUES et al. (2010) observed that the samples of flooded soil with liquid detergent and oil presented soil porosity reduction.
No interference was verified by the adoption of wastewater use regarding microporosity. According to LIMA et al. (2007), soil microporosity is responsible for water storage and has its ideal value within a range between 0.250 and 0.330 m3 m-3. Therefore, our study shows that the obtained values for this attribute are in adequate levels overall (Table 4).
was an OM reduction to 0.005 dag kg-1 for each percentage unit increase of TWW doses. Thus, TWW possibly provided soil fertility increase, which associated to organic components supplementation, especially those with low molecular weight, promoted an increment in microbial activity, as well as stimulation of native organic matter decomposition rates by the highest doses.
ANDRADE FILHO et al. (2013) working with a soil depth of 0-20 cm of a clayey in texture Cambisol cultivated with cotton crops, determined that the wastewater proportion in relation to the clean water mixture superior to 62,5% promoted the soil organic matter reduction. Similarly, SIMÕES et al. (2013) verified that domestic sewage effluent treated without dilution stimulates microbial activity in a Yellow Latosol (Oxisol) grown with castor bean.
THIESSEN et al. (2013) defined the priming effect as a positive stimulus to the microbial population growth with the addition of material rich in energy, causing an increase in decomposition rate due to enzymatic action of such microorganisms.
Nevertheless, in accordance with FORTES NETO et al. (2013), this organic matter reduction effect will remain until a pioneer community of metabolic active microorganisms is succeeded by microorganism communities with more stable metabolism that immobilize the carbon in the microbial biomass and contribute to elevate soil organic matter levels in a long-term.
Regarding DC levels, it was verified that at 0-20 cm, all treatments showed higher DC means compared to control, with mean increments of 38.30, 40.43, 47.87 and 52.13 % respectively for treatment using 70, 130, 170 and 200% TWW.
According to ERTHAL et al. (2010), the DC values are higher in superficial layers and tend to increase with time. The cumulative effect of sodium and potassium is the main cause for this change. In this way, the DC value increment observed are probably attributed to sodium supply whose values supplied to the soil reached variable quantities from 163.3 to 476.9 kg ha-1 among the treatments with the lowest (70) and the highest (200) TWW doses (Table 3).
For DIAS & BLANCO (2010), sodium presents the hydrated radius relatively large compared to the other elements, such as calcium and magnesium, being given significant potential to change the double diffuse layer (DDL) and, consequently soil physical behavior in face of wetting and drying cycles. As stated by MEURER et al. (2004), the dispersed clay in water may eluviate along soil profile and produce horizons richer in clay, as well as block micro pores reducing aeration and water infiltration.
The highest tested doses at 20-40 cm reduced aggregates stability, confirmed by the WMD and GMD indexes (Table 4). Table 4 shows that wastewater management had no influence on aggregate distribution (macro and micro aggregates). However, the regression analysis indicated a macro aggregate reduction of 0.06% and micro aggregate increase of 0.06% at 0-20 cm layer for each increase unit of TWW dose (Figures 1C and 1D).
According to VICENTE et al. (2012), stable aggregates in water restore soil porosity, influencing on infiltration and promoting an erosion resistance. Nonetheless, non-stable aggregates may disappear to the minimum impact of raindrops.
The soil stability increase has been attributed to organic matter increment (SOUZA et al., 2009; ANDERS et al., 2010). In this case, as OM content was reduced with the increase of TWW
doses, it is believed that such reduction has contributed negatively to the aggregation index.
CONCLUSIONS
The treated wastewater modifies the soil porosity distribution.
The macroporosity at deeper layers is reduced with elevated doses of treated wastewater supply.
The treated wastewater increments soil organic matter at superficial layers compared to clean water, being lower with increasing doses.
The increase in treated wastewater doses contributes to clay dispersion within superficial layers.
The chemigation with treated wastewater elevates the risk of soil loss by erosion due to aggregate stability reduction.
ACKNOWLEDGEMENT S
The authors thank the State Funding Agency of Minas Gerais (FAPEMIG) for publication support and scholarship grants, and also the Sanitation Company of Minas Gerais, Banco do Nordeste, the Coordination for the Improvement of Higher Education Personnel (CAPES), the National Council for Scientific and Technologic Development (CNPq) for financial support and scholarship grants.
REFERENCES
ALLEN, R. G.; PRUITT, W. O.; WRIGHT, J. L.; A recommendation on standardized surface resistance for hourly calculation of reference ETo by the FAO56 Penman-Monteith method. Agricultural Water
Management, Amsterdam, v.81, n.1–2, p.1–22, 2006.
ANDERS, M.; BECK, P.; WATKINS, B.; GUNTER, S.; LUSBY, K.; HUBBELL, D. Soil aggregates and their associated carbon and nitrogen content in winter annual pastures. Soil Science Society of
America Journal, Madison, v.74, n.4, p.1339–1347, 2010.
ANDRADE FILHO, J. A.; SOUSA NETO, O. N.; DIAS, N. S.; NASCIMENTO, I. B.;
MEDEIROS, J. F.; COSME, C. R. Atributos químicos de solo fertirrigado com água residuária no semiárido brasileiro. Irriga, Botucatu, v.18, n.4, p.661–674, 2013.
APHA - AMERICAN PUBLIC HEALTH ASSOCIATION; AWWA - AMERICAN WATER
WORKS ASSOCIATION; WEF - WATER ENVIRONMENT FEDERATION. Standard methods
for the examination of water and wastewater. 22nd ed. Washington, 2012, 1360 p.
ARATANI, R. G.; SILVA FREDDI, O.; CENTURION, J.; ANDRIOLI, I. Qualidade física de um latossolo vermelho acriférrico sob diferentes sistemas de uso e manejo. Revista Brasileira de
Ciência do Solo, Viçosa, MG, v.33, n.3, p.677–687, 2009.
BARROSO, L. B.; WOLFF, D. B. Reúso de esgoto sanitário na irrigação de culturas agrícolas.
Engenharia Ambiental: Pesquisa e Tecnologia, Espírito Santo do Pinhal, v.8, n.3, p.225–236,
2011.
COSTA, M. C. G.; ALMEIDA, E. L. DE; FERREIRA, T. O.; OLIVEIRA, D. P. DE; ROMERO, R. E. Profundidade do solo e micro-relevo em bananais irrigados: impactos na nutrição mineral e potencial produtivo. Revista Ciência Agronômica, Fortaleza, v.42, n.3 p.567–578, 2011.
DIAS, N. S.; BLANCO, F. F. Efeitos dos sais no solo e na planta. In: GHEYI, H. R.; DIAS, N. S.; LACERDA, C. F. (Ed.). Manejo da salinidade na agricultura: estudos básicos e aplicados. Fortaleza: Instituto Nacional de Ciência e Tecnologia em Salinidade, 2010. p.127-141.
EMBRAPA - EMPRESA BRASILEIRA DE PESQUISA. Serviço Nacional de Levantamento e Conservação do Solo. Manual de métodos de análise do solo. Brasília: Ministério da Agricultura, 2011. 212p.
ERTHAL, V. J. T.; FERREIRA, P. A.; MATOS, A. T. DE; PEREIRA, O. G. Alterações físicas e químicas de um Argissolo pela aplicação de água residuária de bovinocultura. Revista Brasileira
de Engenharia Agrícola e Ambiental, Campina Grande, v.14, n.5, p.467–477, 2010.
FORTES NETO, P.; VEIGA, P. G. A.; FORTES, N.; TARGA, M.S., GADIOLI, J.L.; PEIXOTO, P.H.M.; Chemical changes in the soil and production of oat fertilized with treated
wastewater. Ambiente & Água - An Interdisciplinary Journal of Applied Science, Taubaté, v.8, n.4, p.71-83, 2014.
KEMPER, W.; ROSENAU, R. Aggregate stability and size distribution. 1986. Washington: Governmet printing office, 1966. (Technical Bullettin, 1355).
KIEHL, E.J. Porosidade. In: KIEHL, E.J. Manual de edafologia: relações solo-planta. São Paulo: Ceres, 1979. p.96-111.
KLEIN, V. A. Física do solo. Passo Fundo: Ediupf, 2008. 212p. LARCHER, W. Ecofisiologia vegetal. São Carlos: Rima, 2005. 531 p.
LIMA, C. G. Da R.; CARVALHO, M. De P.; MELLO, L. M. M. DE; LIMA, R. C. Correlação linear e espacial entre a produtividade de forragem, a porosidade total e a densidade do solo de Pereira Barreto (SP). Revista Brasileira de Ciência do Solo, Viçosa, MG, v.31, n.6, p.1233–1244, 2007.
LUCIANO, R. V.; ALBUQUERQUE, J. A.; COSTA, A. Da; BATISTELLA, B.; WARMLING, M. T. Atributos físicos relacionados à compactação de solos sob vegetação nativa em região de altitude no Sul do Brasil. Revista Brasileira de Ciência do Solo, Viçosa, MG, v.36, n.6, p.1733–1744, 2012.
MARCOLIN, C. D.; KLEIN, V. A. Determinação da densidade relativa do solo por uma função de pedotransferência para a densidade do solo máxima. Acta Scientiarum. Agronomy, Maringá, v.33, n.2, p.349–354, 2011.
MEURER, E. J.; CASTILHOS, D. D.; TEDESCO, M. J. Fundamentos de química do solo. 2. ed. Porto Alegre: Genesis, 2004. 290p.
MIOTTI, A. A.; COSTA, M. C. G.; FERREIRA, T. O.; ROMERO, R. E. Profundidade e atributos físicos do solo e seus impactos nas raízes de bananeiras. Revista Brasileira de Fruticultura, Jaboticabal, v.35, n.2, p.536–545, 2013.
RODRIGUES, R. A.; MOLINA JÚNIOR, V. E.; LOLLO, J. A. De. Influência dos constituintes do esgoto no colapso de um solo arenoso. Engenharia Sanitária e Ambiental, Rio de Janeiro, v.15, n.1, p.29–36, 2010.
SAMPAIO, S. C.; CAOVILLA, F. A.; OPAZO, M. A. U.; NÓBREGA, L. H. P.; SUSZEK, M.; SMANHOTTO, A. Lixiviação de íons em colunas de solo deformado e indeformado. Engenharia
Agrícola, Jaboticabal, v. 30, n.1, p. 150–159, 2010.
SIMÕES, K. Da S.; PEIXOTO, M. De F. Da S. P.; ALMEIDA, A. T.; LEDO, C. A. Da S.;
PEIXOTO, C. P.; PEREIRA, F. A. De C. Água residuária de esgoto doméstico tratado na atividade microbiana do solo e crescimento da mamoneira. Revista Brasileira de Engenharia Agrícola e
Ambiental, Campina Grande, v.17, n.5, p. 518–523, 2013.
SOUZA, Z. M. De; MARQUES JÚNIOR, J.; PEREIRA, G. T.; SÁENZ, C. M. S. Spatial variability of aggregate stability in latosols under sugarcane. Revista Brasileira de Ciência do Solo, Viçosa, MG, v.33, n.2, p.245–253, 2009.
SOUZA, J. A. A. De; BATISTA, R. O.; RAMOS, M. M.; SOARES, A. A. Alteração nas características físicas do solo decorrentes da aplicação de esgoto doméstico tratado. Acta
Scientiarum. Technology, Maringá, v.32, n.4, p.361–366, 2010.
THIESSEN, S.; GLEIXNER, G.; WUTZLER, T.; REICHSTEIN, M. Both priming and temperature sensitivity of soil organic matter decomposition depend on microbial biomass – An incubation study.
Soil Biology and Biochemistry, Oxford, v.57, p.739–748, Feb. 2013.
VARALLO, A. C. T.; SOUZA, C. F.; SANTORO, B. De L. Mudanças nas características físico-químicas de um latossolo vermelho-amarelo distrófico após a irrigação com água de reúso na cultura da alface-crespa (Lactuca sativa L.). Engenharia Agrícola, Jaboticabal, v.32, n.2, p.271–
279, 2012.
VICENTE, T. F. Da S.; PEDROSA, E. M. R.; ROLIM, M. M.; OLIVEIRA, V. S.; OLIVEIRA, A. K. S.; SOUZA, A. M. P. L. Relações de atributos do solo e estabilidade de agregados em canaviais com e sem vinhaça. Revista Brasileira de Engenharia Agrícola e Ambiental, Campina Grande, v.16, n.11, p.1215–1222, 2012.