Environmental and genetic variation of isoflavone content
of soybean seeds grown in Brazil
Mercedes Concórdia Carrão‑Panizzi(1), Mark Berhow(2), José Marcos Gontijo Mandarino(1) and Maria Cristina Neves de Oliveira(1)
(1)Embrapa Soja, Rodovia Carlos João Strass, Distrito de Warta, CEP 86001‑970 Londrina, PR, Brazil. E‑mail: [email protected], [email protected], [email protected] (2)United States Department of Agriculture, Agricultural Research Service, National Center for Agricultural Utilization Research, Peoria, IL, USA, 61604. E‑mail: [email protected]
Abstract – The objective of this work was to evaluate isoflavone concentrations in seeds of different Brazilian soybean cultivars grown in a range of locations and environmental conditions in Brazil. Seeds of 233 cultivars grown in Ponta Grossa, PR, Brazil, during the 2001/2002 soybean season, and of 22 cultivars sown in different locations of Brazilian Northeast, Southeast on South regions were analyzed for total isoflavones, including daidzin, glycitin, genistin and acetylgenistin. The total isoflavones ranged from 12 mg 100 g‑1 (cv. Embrapa 48)
to 461 mg 100 g‑1 (cv. CS 305) among the 233 cultivars grown in Ponta Grossa, and the differences among
them are due to genetic effects since all cultivars were grown and collected at the same locatation and year. This is an indication of the possibility of breeding for isoflavone content. Differences in isoflavone content observed in the cultivars grown in different locations permit the selection of locations for optimum isoflavone content (low or high), depending on the uses of soybean. In the Northeast region (5–8°S), higher concentrations of total isoflavones were observed at São Raimundo das Mangabeiras (232 mg 100 g‑1) and Tasso Fragoso
(284 mg 100 g‑1) municipalities, and in the South (23–30°S), isoflavones were higher in Guarapuava, Canoinhas,
Vacaria and Campos Novos municipalities, ranging from 130 to 409 mg 100 g‑1.
Index terms: Glycine max, isoflavones, sowing location, soybean grains, soybean cultivars, soyfood.
Variação genética e ambiental no teor de isoflavonas
de sementes de soja cultivada no Brasil
Resumo – O objetivo deste trabalho foi avaliar concentrações de isoflavonas nas sementes de diferentes cultivares brasileiras de soja cultivadas numa amplitude de condições ambientais e de locais no Brasil. Sementes de 233 cultivares semeadas em Ponta Grossa, PR, na safra de 2001/2002, e sementes de 22 cultivares plantadas em diferentes locais das regiões Nordeste, Sudeste e Sul foram analisadas quanto ao teor total de isoflavonas, incluindo daidzina, glicitina, genistina e acetilgenistina. O total de isoflavonas variou entre 12 mg 100 g‑1 (cv. Embrapa 48) e 461 mg 100 g‑1
(cv. CS 305) entre as 233 cultivares plantadas em Ponta Grossa, e essas diferenças são devidas aos efeitos genéticos, pois todas foram cultivadas e colhidas no mesmo local e ano. Isso indica que há possibilidade de melhoramento genético para o teor de isoflavonas. Diferenças no teor de isoflavonas observadas nas cultivares plantadas nos diferentes locais de semeadura permitem selecionar locais segundo a concentração ótima de isoflavonas (reduzida ou alta), dependendo do uso da soja. No Nordeste (5–8°S), concentrações mais altas de isoflavonas totais foram observadas nos municípios São Raimundo das Mangabeiras (232 mg 100 g‑1) e Tasso
Fragoso (284 mg 100 g‑1). No Sul (23–30°S), as concentrações de isoflavonas foram maiores nos municípios
Guarapuava, Canoinhas, Vacaria e Campos Novos, com amplitude de 130 a 409 mg 100 g‑1.
Termos para indexação: Glycine max, isoflavonas, local de semeadura, grãos de soja, cultivares de soja, alimento derivado de soja.
Introduction
Three structurally distinct isoflavones (daidzein, genistein, and glycitein) are accumulated in soybean seeds as their acylated 7‑O‑glycoside forms (daidzin, genistin, and glycitin) (MacLeod & Ames, 1988). The 6‑O‑malonyl derivatives of these glucosides have been reported by Kudou et al. (1991) as the predominant
form present in intact soybean seeds. The malonyl isoflavones are heat labile, and easily converted to the corresponding glycosides and aglycones when submitted to heat (Kudou et al., 1991).
from different locations. Air temperature during the seed‑filling period is the most critical environmental factor affecting the final isoflavone concentration. Other factors that affect isoflavones are variations in temperature – both levels and length of time at high or low temperatures –, humidity, light intensity, rainfall – duration and number of rainy days –, and physical damage caused by insects and diseases (Wang & Murphy, 1994; Tsukamoto et al., 1995, 2001; Carrão‑Panizzi et al., 1998; Daydé et al., 2004).
Soybeans grown at low latitudes, generally with higher average temperatures, tend to have relatively lower isoflavone content. The average isoflavone
content of Brazilian soybean cultivars is of about
150 mg 100 g‑1, whereas for American soybeans
it is 200 mg 100 g‑1, while soybean grown in Japan
and Canada have higher concentrations (450 and
550 mg 100 g‑1 respectively) (Tsukamoto et al., 2001).
Although average isoflavone concentrations of Brazilian
soybeans are relatively low (Carrão‑Panizzi et al.,
1996), they vary considerably among cultivars (Silva et al., 2009) and in cultivars grown at different locations over the years. A range of 227 to 105 mg 100 g‑1
was observed for the same cultivar (IAS 5) grown, respectively, in a location with low (Vacaria, RS, 19°C), and high (Palotina, PR, 24°C) average air temperatures during the seed‑filling months (Carrão‑Panizzi et al., 1999). Daydé et al. (2004) found that low temperatures coupled with late precipitation (rain or irrigation) increased isoflavone concentrations.
Isoflavones in the diet may have effects on the health of humans, through their antioxidant and estrogenic activities, and a wide spectrum of pharmacological properties (Messina, 1999). Isoflavones are also reported as influencing the development and remediation of some of the chronic diseases associated with aging, such as osteoporosis, cognitive disfunction, coronary heart disease and cancer (Messina, 1999). They also have an effective antixenotic, antioxidant and antibiotic action in mammalian systems (Graham, 1991).
Much research is underway with soybean and its isoflavones regarding human health issues. In order to certify isoflavone content and composition in dietary supplements or soyfoods, the qualitative determination of these compounds in various soybean cultivars grown under different environmental conditions is needed. The objective of this work was to evaluate isoflavone concentrations in seeds of different Brazilian soybean cultivars, verifying genetic differences and effects of different sowing locations in Brazil.
Materials and Methods
To determine genetic variations on the isoflavone content of soybean genotypes, 233 Brazilian soybean
cultivars were grown in Ponta Grossa, PR, Brazil
(soybean season 2001/2002), in fertile soil (pH
CaCl2: 5.0, Al: 0.0, K: 0.43, Ca: 2.97, Mg: 1.29,
and H+Al: 10.45 cmolc dm‑3; C: 22.75 g dm‑3; and
P = 11.96 mg dm‑3).
For the evaluation of environmental effects on isoflavone composition, seed samples of five soybean cultivars grown in five northeastern municipalities, six cultivars grown in Minas Gerais state municipalities, and of seven cultivars grown in 19 southern municipalities, from Embrapa’s uniform field tests, in Brazil (2001/2002 growing season) were analyzed. Isoflavone composition of 17 Embrapa soybean cultivars (BRS 133, BRS 184, BRS 185, BRS 212, BRS 213, BRS 214, BRS 215, BRS 230, BRS 231, BRS 232, BRS 257, BRS 258, BRS 259, BRS 260, BRS 261, BRS 262 and Embrapa 48) sown in Londrina, PR, in three dates (October, November and December) (2004/2005 soybean season), were also evaluated.
Seed lots from each location and cultivar were analyzed for isoflavone concentration. Seed samples were dried in an oven with forced air circulation at 50°C for three days, before grinding. Weighed samples of ground soybean were defatted overnight with hexane, then washed with three volumes of hexane and allowed to dry. The defatted samples were then extracted overnight with 4x DMSO:MeOH (1:1, volume:mass)
at 50°C. Sample extracts were centrifuged at 20,800 g
for 15 min at 5ºC. After centrifugation, an aliquot of
each sample was filtered through a 0.45‑µm Millipore
filter into autoinjector vials for HPLC analysis.
The isoflavone concentrations were determined according to Berhow (2002) and Barnes et al. (1994) on an Agilent 1100 Series HPLC system equipped with a photodiode array detector system running under HP Chemstation software (A.06.01) (Agilent
Technologies, Wilmington, DE, USA) and a 5‑µm
trifluroacetic acid) and 80% water (0.025% trifluroacetic acid) at a flow rate of 1 mL min‑1. After injection, the
column was run for 2 min at the initial conditions, then developed with a linear gradient to 100% methanol (0.025% trifluroacetic acid) over a period of 50 min. The wavelength monitored and used for integration was of 285 nm. Isoflavone peaks were identified by their spectra and retention time and confirmed by LC‑MS. Standard curves were prepared with pure standards of daidzin, glycitin and genistin isolated at the National Center for Agricultural Utilization Research – NCAUR (USDA/ARS, USA). Molar extinction coefficients obtained from these curves were used to determine the levels of all forms of the isoflavones measured in the samples on a molar basis.
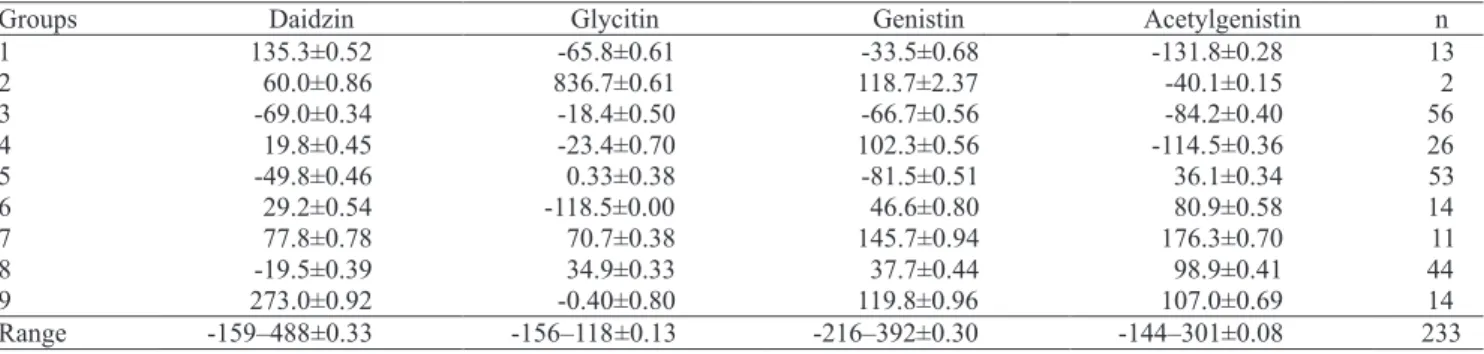
The multivariate statistics method was applied to the 233 soybean cultivars using a k‑means partition cluster analysis (Souza, 2004) by means of the Statistica software, version 7.1 (Statsoft, 1995). For cluster analysis, each isoflavone content datum was standardized by subtracting the average value and dividing the result by the standard deviation. Differences in isoflavone content – daidzin, glycitin, genistin and acetylgenistin, the only forms found above detection limits in these samples – were evaluated in 233 cultivars by cluster analysis through the multivariate exploratory method of k‑means (Andeberg, 1973). The method determines the greatest distance between any two cultivars at different clusters.
A completely randomized design was used to evaluate the experimental data from different planting locations. To determine significant differences among the mean
values, ANOVA andTukey tests at 5% probability were
used for comparing data from cultivars and locations by using SAS (SAS Institute, 1995).
Results and Discussion
The 233 soybean cultivars were divided in nine groups according to their isoflavone contents (Table 1). The analysis of variance was significant (p≤0,000) for all the studied variables of the nine groups. The evaluation of the classified cultivar groups showed that the multivariate method was efficient in 94.4% of the cases. For each of the nine groups, cultivars were arranged as presented in Table 2. The descriptive statistical analysis showed large variability for daidzin and genistin.
Daidzin and genistin were the major compounds observed in the analysis, which affected the total content of isoflavones. The highest values for total isoflavones were detected in groups nine, seven and two, represented by the following cultivars in decreasing order within the range of 461 to 200 mg 100 g‑1:
CS 305, Embrapa 65, MG/BR‑46, BRS 60, MS/ BRS 171, FT‑15, FT‑18, Tiaraju, Embrapa 59, MT/ BR‑49, BRS 156, São Luiz, Emgopa 313, Mineira, Numbaíra, IAC 10 and MSBR 20. The lowest values
in an increasing range from 12 to 100 mg 100 g‑1 were
observed in cultivars Embrapa 48, Ocepar 19, IAS‑3, BR‑36, FT‑13, CEP‑16, FT‑Iramaia, Ivorá, CEP‑10, FT‑Cometa, FT‑9, Ivaí, Davis, Vila Rica, Ocepar 10, IAS‑2, FT‑Guaíra, Embrapa 58, Industrial, FT‑16, Viçoja, BR‑3, Pérola, Emgopa 302, Década, IAC‑16, Embrapa 47, FT‑20, BR‑32, Bienville, Ocepar 17, SSP‑S1, IAC‑17, Ocepar‑14. Cultivar Embrapa 48 showed the lowest concentration of total isoflavones (12 mg 100 g‑1). This cultivar is preferred by food
Table 1. The nine groups with standardized data (average±standard deviation, and range of maximum and
minimum values±standard deviation) of isoflavone concentrations (mg 100 g‑1) of 233 soybean cultivars defined
industries because of its mild flavor, which could be due to the low concentrations of isoflavones. These compounds are related to the astringency in soybean flavor. Cultivar BR‑36 also presented low isoflavone concentration, which confirms the genetic effect observed in previous works (Carrão‑Panizzi et al., 1995, 1998; Silva et al., 2009).
For daidzin, the highest average values were found in groups one, seven and nine, represented by cultivars
IPB‑T (138 mg 100 g‑1), BRS 60 (145 mg 100 g‑1) and
FT‑15 (165 mg 100 g‑1). The lowest values for group
eight were found in cv. CS 110 (29 mg 100 g‑1), for
group five in cv. Ocepar 19 (14 mg 100 g‑1), and for
group three in cv. Embrapa 48 (5 mg 100 g‑1). Groups
two (55–156 mg 100 g‑1), seven (72–158 mg 100 g‑1)
and nine (77–188 mg 100 g‑1) had the highest values
for genistin, while groups five (6–7 mg 100 g‑1), three
(5–100 mg 100 g‑1) and one (38–96 mg 100 g‑1) had
the lowest concentrations. For glycitin, an average of
18 mg 100 g‑1 was observed in all groups, except for
group two, in which distinctive values for cultivars
BR‑2 (127 mg 100 g‑1) and Embrapa 65 (Itapoty)
(116 mg 100 g‑1) were observed. Acetylgenistin was
detected in lower concentration for all cultivars. Isoflavones are highly affected by environmental conditions, as has already been observed in other soybean cultivars and in alternate growing locations (Tsukamoto et al., 1995; Carrão‑Panizzi et al., 1998; Daydé et al., 2004). In Brazil, soybean is grown in locations within latitudes 32°S to 5°N. This wide environmental range supports the need for further research aiming at determining location effects on isoflavone content of soybean seeds.
In the locations in the Northeast of Brazil (5– 8°S), the weather is very similar, with average temperatures of 27°C for the seed‑filling period (February to April). Some variation in the local conditions (precipitation or temperature) could cause the differences in isoflavone concentrations among locations. No significant correlation was found between cultivars and locations for this region. However, in the municipalities of São Raimundo
das Mangabeiras, MA, and Tasso Fragoso, MA, higher concentrations of total isoflavones were found for all cultivars (Table 3). In general, differences among cultivars were not remarkable in the Northeast, but cultivars BRS Sambaíba and BRS Tracajá showed the highest and lowest total average values for isoflavone content.
Growing locations in Minas Gerais, MG, in the
Southeast region, are much closer to each other (only 18°–19°S), and all had an average temperature of 24°C, and precipitation of about 400 mm. Nevertheless, higher concentrations of isoflavones were observed in Sacramento, MG, for all cultivars (Table 4). Cultivar Preciosa had higher concentrations of isoflavones in all locations except for Uberlândia, MG.
In the South, with more weather variation among locations (Figure 1), all cultivars grown in Londrina and Palotina, PR, with higher average temperatures during the filling period (26°C), showed reduced isoflavone concentrations. Higher concentrations of isoflavones were observed in Guarapuava, PR, and Campos Novos, SC, which had the lowest average temperatures (21°C). Similar observations have encouraged nutriceutical‑grade soybean production at locations in the South of Paraná state, where reduced average temperatures have resulted in
increased isoflavone content (Carrão‑Panizzi et al., 2003). Cultivars Codetec 202 and IAS‑5 had the highest isoflavone concentrations (Figure 1). Cultivar IAS‑5 showed higher concentrations of isoflavones in other studies, which suggests this may be a genetic trait (Carrão‑Panizzi et al., 1999). The highest concentrations of isoflavones were observed for cultivars IAS‑5 and BRS 66, grown in most of Rio Grande do Sul (Figure 2), where average temperatures are generally lower. Cultivars grown in these locations had higher isoflavone concentrations, except for soybeans grown in Seberi and São Luiz, RS, where warmer average temperatures were observed (Table 5).
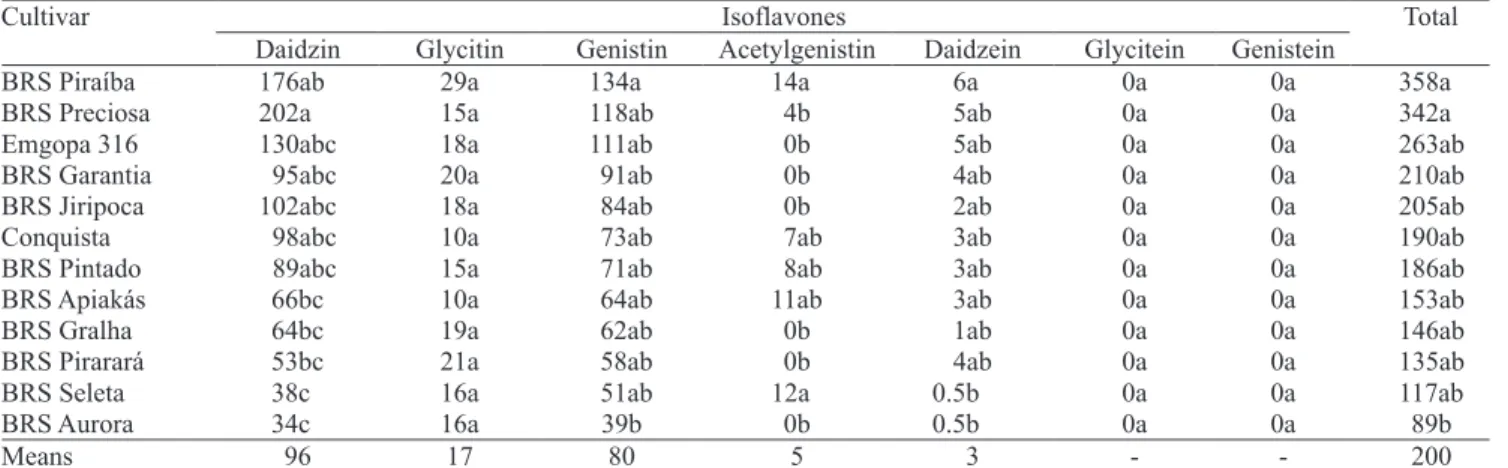
Genetic variability in isoflavone concentration is observed when different soybean cultivars are grown in the same location. Of 12 different cultivars grown in Conquista, MG, cultivars BRS Piraíba and BRS Preciosa had the highest concentrations of isoflavones, while BRS Aurora, BRS Seleta, and BRS Pirarará had the lowest (Table 6). The concentrations of isoflavone aglycones (daidzein, glycitein and genistein) were either small or undetected, as expected for soybean seeds before processing. Malonyl and some acethyl forms of the isoflavones were not found in this study, because they were transformed to glycoside forms
Table 3. Total isoflavone (daidzin, genistin, glycitin, acetylgenistin, daidzein, genistein, glycitein) content (mg 100 g‑1) in
seeds of Brazilian soybean seed cultivars sown in different locations in the Northeast region of Brazil, in the 2001/2002 soybean season(1).
(1)Mean values followed by equal letters, small in the lines and capital in the columns, do not differ by the Tukey’s test at 5% probability.
Table 4. Total isoflavone (daidzin, genistin, glycitin, acetylgenistin, daidzein, genistein, glycitein) content (mg 100 g‑1) in
seeds of Brazilian soybean cultivars sown in different locations of Minas Gerais state, Brazil, in the 2001/2002 soybean season(1).
during heat treatment, when seed samples were dried for three days at 50°C before grinding. Reduction of malonyl forms was also observed when soybean grains were soaked for 12 hours at 50°C (Carrão‑Panizzi et al., 2003).
The evaluation of the soybean crops grown in
Londrina, PR (23°18'S), during the soybean season of 2004/2005 showed differences in isoflavone content for crops initiated at three different planting dates
(October, November and December). The filling periods for the three crops were January, February and March respectively. The average temperatures and precipitations for these three crops were 23.4°C and 376 mm, 24.2°C and 52 mm, and 24.5°C and 48 mm respectively (Brasil, 2007). All cultivars except BRS 262 yielded higher concentrations of isoflavones when sown in October (Table 7), with lower average temperatures and higher precipitation during the January seed‑filling period. Adequate water supply and lower temperatures enhance isoflavone concentrations in the
Figure 1. Total isoflavone (daidzin, genistin, glycitin, acetylgenistin,
daidzein, genistein, and glycitein) content (mg 100 g‑1) in seeds of
Brazilian soybean cultivars sown in different locations of the South region of Brazil, in Paraná (PR) and Santa Catarina (SC) states, in the 2001/2002 soybean season.
Figure 2. Total isoflavone (daidzin, genistin, glycitin,
acetylgenistin, daidzein, genistein, glycitein) content (mg 100 g‑1) in seeds of Brazilian soybean cultivars sown in
Rio Grande do Sul (RS) state, in the South region of Brazil, in the 2001/2002 soybean season.
Table 5. Environmental data of some of the locations in the South region of Brazil, in 2002.
mature beans (Daydé et al., 2004). The crops harvested from the November and December planting dates resulted in beans with lower isoflavone concentrations, which could be due to higher average temperatures (24°C) and lower rainfall during the seed‑filling period. Precipitation was sevenfold lower in February and March than in January. Cultivar BRS 262 has a much later maturation time, and the seed‑filling period in all
three planting times occurred during months of water shortage and higher mean temperature.
Daydé et al. (2004) also observed high heritability for isoflavone content and composition in the various cultivars they examined. Differences among genotypes in these experiments are consistent over time. For the experiment carried out in 2005, cultivar BRS 212 had the highest concentration of total isoflavones for all the planting periods (218.68 mg 100 g‑1), while cultivar
BRS 258 had the lowest (47.39 mg 100 g‑1). The lower
concentration of isoflavone observed in BRS 258 must be a genetic character related to cultivar BR 36, which also had lower isoflavone concentration in several other studies (Carrão‑Panizzi et al., 1998). BRS 258 is derived from BR‑36 improved for resistance to stem canker (Cultivares de soja 2008/2009 região Centro‑Sul, 2007). Genetic expression of high or low isoflavone content manifests itself regardless of the environment, as observed in this experiment for the three different planting dates.
Conclusions
1. There are genetic differences for isoflavone contents among Brazilian soybean cultivars, and there is a good possibility of breeding for isoflavone
content.
2. The highest values for total isoflavones are found in groups nine, seven and two, represented by the following cultivars, in decreasing order, within the
range of 461 to 255 mg 100 g‑1: CS 305, Embrapa 65,
Table 6. Isoflavone content (mg 100 g ) in seeds of Brazilian soybean cultivars sown in the region of Conquista, Minas
Gerais state, Brazil, in the 2002 soybean season(1).
Table 7. Total isoflavones (mg 100 g‑1) in samples of
soybean seeds from different cultivars sown in Londrina, PR (23°18’S), in three different dates of the soybean season of 2004/2005.
(1)Means followed by equal letters, small in the lines and capital in the columns, do not differ by the Tukey’s test at 5% probability.
MG/BR‑46, BRS 60, MS/BRS 171, FT‑15, FT‑18, Tiaraju, Embrapa 59, MT/BR‑ 49, BRS 156, São Luiz, Emgopa 313 e Mineira.
3. The lowest isoflavone content is observed in the following cultivars, in increasing order within the range
of 12 to 100 mg 100 g‑1: Embrapa 48, Ocepar 19, IAS‑3,
BR‑36, FT‑13, CEP‑16, FT‑Iramaia, Ivorá, CEP‑10, FT‑Cometa, FT‑9, Ivaí, Davis, Vila Rica, Ocepar 10, IAS‑2, FT‑Guaíra, Embrapa 58, Industrial, FT‑16, Viçoja, BR‑3, Pérola, Emgopa 302, Década, IAC‑16, Embrapa 47, FT‑20, BR‑32, Bienville, Ocepar 17, SSP‑S1, IAC‑17, Ocepar 14.
4. Differences in isoflavone content in different sowing locations permit the selection of locations for the production of soybean with low or high contents of isoflavones.
References
ANDEBERG, M.R. Cluster analysis for applications. New York:
Academic Press, 1973. 359p.
BARNES, S.; KIRK, M.; COWARD, L. Isoflavones and their conjugates in soy foods: extraction conditions and analysis by HPLC‑mass spectrometry. Journal of Agricultural and Food
Chemistry, v.42, p.2466‑2474, 1994.
BERHOW, M.A. Modern analytical techniques for flavonoid determination. In: BUSLIG, B.S.; MANTHEY, J.A. (Ed.).
Flavonoids in the living cell. New York: Kluwer Academic, 2002.
p.61‑76.
BRASIL. Ministério da Agricultura, Pecuária e Abastecimento.
Agritempo. 2007. Available at: <http://www.agritempo.gov.br/>.
Accessed on: 25 Oct. 2009.
CARRÃO‑PANIZZI, M.C. Avaliação de cultivares de soja quanto aos teores de isoflavonóides. Pesquisa Agropecuária Brasileira,
v.31, p.691‑698, 1996.
CARRÃO‑PANIZZI, M.C.; BELÉIA, A. del P.; KITAMURA, K.; OLIVEIRA, M.C.N. Effects of genetics and environment on isoflavone content of soybean from different regions of Brazil.
Pesquisa Agropecuária Brasileira, v.34, p.1787‑1795, 1999.
CARRÃO‑PANIZZI, M.C.; KITAMURA, K. Isoflavone content
in Brazilian soybean cultivars. Breeding Science, v.45, p.295‑300,
1995.
CARRÃO‑PANIZZI, M.C.; KITAMURA, K.; BELÉIA, A. del P.; OLIVEIRA, M.C.N. Influence of growth locations on isoflavone
contents in Brazilian soybean cultivars. Breeding Science, v.48,
p.409‑413, 1998.
CARRÃO‑PANIZZI, M.C.; SIMÃO, A.S.; KIKUCHI, A. Efeitos de genótipos, ambientes e de tratamentos hidrotérmicos na concentração de isoflavonas agliconas em grãos de soja. Pesquisa
Agropecuária Brasileira, v.38, p.897‑902, 2003.
CULTIVARES de soja 2008/2009 região Centro‑Sul. Londrina: Embrapa Soja: Fundação Meridional, 2008. 76p. (Embrapa Soja. Documentos, 309).
DAYDÉ, J.; BERGER, M.; THÉODOROU, V. Screening and breeding soybean for isoflavone content and composition. In: WORLD SOYBEAN RESEARCH CONFERENCE, 7.; INTERNATIONAL SOYBEAN PROCESSING AND UTILIZATION CONFERENCE, 4.; BRAZILIAN SOYBEAN CONGRESS, 3., 2004, Foz do Iguaçu. Proceedings. Londrina:
Embrapa Soja, 2004. p.845‑851.
GRAHAM, T.L. Flavonoid and isoflavonoid distribution in developing Soybean seedling tissues and in seed and root exudates. Plant Physiology,v.95, p.594‑603, 1991.
KUDOU, S.; FLEURY, Y.; WELTI, D.; MAGNOLATO, D.; UCHIDA, T.; KITAMURA, K.; OKUBO, K. Malonyl isoflavone glycosides in soybean seeds (Glycine max (L.) Merril). Agricultural
and Biological Chemistry, v.55, p.2227‑2233, 1991.
MACLEOD, G.; AMES, J. Soy flavor and its improvement. CRC
Critical Reviews in Food Science and Nutrition,v.27, p.219‑400,
1988.
MESSINA, M.J. Legumes and soybeans: overview of their nutritional profiles and health effects. American Journal of
Clinical Nutrition, v.70, p.439‑450, 1999.
SAS INSTITUTE. SAS proprietary software release. Version
8.2. Cary: SAS Institute, 1995.
SILVA, J.B. da; CARRÃO‑PANIZZI, M.C.; PRUDÊNCIO, S.H. Chemical and physical composition of grain‑type and food‑type soybean for food processing. Pesquisa Agropecuária Brasileira,
v.44, p.777‑784, 2009.
SOUZA, S.R. de. Classificação de variedades da soja quanto à concentração de isoflavonas utilizando análise estatística
multivariada. Londrina: Universidade Estadual de Londrina,
2004. 71p.
STATSOFT. STATISTICA for Windows: computer program
manual. Tulsa: Statsoft, 1995.
TSUKAMOTO, C.; KUDOU, S.; KUKUCHI, A; CARRÃO‑PANIZZI, M.C.; ONO, T.; KITAMURA, K.; OKUBO, K. Isoflavones in soybean products: composition, concentration and physiological effects. In: SIMPÓSIO BRASILEIRO SOBRE BENEFÍCIOS DA SOJA NA SAÚDE HUMANA, 1., 2001, Londrina. Anais. Londrina: Embrapa Soja, 2001. p.9‑14. (Embrapa
Soja. Documentos, 169).
TSUKAMOTO, C.; SHIMADA, S.; IGITA, K.; KUDOU, S.; KOKUBUN, M.; OKUBO, K.; KITAMURA, K. Factors affecting isoflavone content in soybean seeds: changes in isoflavones, saponins, and composition of fatty acids at different temperatures during seed development. Journal of Agricultural and Food
Chemistry, v.43, p.1184‑1192, 1995.
WANG, H.; MURPHY, P.A. Isoflavone composition of American and Japanese soybeans in Iowa: effects of variety, crop year and
location. Journal of Agricultural and Food Chemistry, v.42,
p.1674‑1677, 1994.