Revista Brasileira de
Engenharia Agrícola e Ambiental
Campina Grande, PB, UAEA/UFCG – http://www.agriambi.com.br
v.21, n.6, p.427-432, 2017
Mapping of sugarcane crop area in the Paraná State
using Landsat/TM/OLI and IRS/LISS-3 images
Clóvis Cechim Junior
1, Jerry A. Johann
1& João F. G. Antunes
2 DOI: http://dx.doi.org/10.1590/1807-1929/agriambi.v21n6p427-432A B S T R A C T
The knowledge on reliable estimates of areas under sugarcane cultivation is essential for the Brazilian agribusiness, since it helps in the development of public policies, in determining prices by sugar mills to producers and allows establishing the logistics of production disposal. The objective of this work was to develop a methodology for mapping the sugarcane crop area in the state of Paraná, Brazil, using images from the Landsat/TM/OLI and IRS/LISS-3 satellites, for the crop years from 2010/2011 to 2013/2014. The mappings were conducted through the supervised Maximum likelihood classification (Maxver) achieving, on average, an overall accuracy of 94.13% and kappa index of 0.82. The correlation with the official data of the IBGE ranged from moderate to strong (0.64 ≤ rs ≤ 0.80) with average agreement (dr) of 0.81. There was an increase of 2.73% (18,630 ha) in the area with sugarcane in Paraná between 2010/2011 and 2013/2014.
Mapeamento de área cultivada de cana-de-açúcar no estado
do Paraná com imagens Landsat/TM/OLI e IRS/LISS-3
R E S U M O
O conhecimento de estimativas confiáveis de áreas cultivadas de cana-de-açúcar é imprescindível para o agronegócio brasileiro por auxiliar no desenvolvimento de políticas públicas, na determinação dos preços aos produtores pelas usinas e permitir estabelecer a logística de escoamento da produção. O objetivo deste trabalho foi realizar o mapeamento de área da cultura de cana-de-açúcar para o estado do Paraná a partir de imagens dos satélites Landsat/TM/OLI e IRS/LISS-3, para as safras de 2010/2011 a 2013/2014. Os mapeamentos foram realizados por meio da classificação supervisionada de Máxima verossimilhança (Maxver) obtendo-se, em média, uma exatidão global de 94,13% e índice kappa de 0,82. As correlações com os dados oficiais do IBGE variaram de moderada a forte (0,64 ≤ rs ≤ 0,80) com concordância (dr) média de 0,81. Houve aumento de 2,73% (18.630 ha) de área com cana-de-açúcar no Paraná entre 2010/2011 e 2013/2014.
Key words: remote sensing
digital image processing supervised classification maxver
agricultural statistic
Palavras-chave: sensoriamento remoto
processamento digital de imagens classificação supervisionada maxver
estatística agrícola
1 Universidade Estadual do Oeste do Paraná/Programa de Pós-Graduação em Engenharia Agrícola. Cascavel, PR. E-mail: [email protected];
[email protected] (Corresponding author)
2 Empresa Brasileira de Pesquisa Agropecuária/Embrapa Informática Agropecuária. Campinas, SP. E-mail: [email protected]
Introduction
Agricultural planning and the acquisition and provision of precise and fast information on the agricultural statistics can be made in a more objective way through orbital remote sensing (Aguiar et al., 2011; Mulianga et al., 2015; Schultz et al., 2015). It is possible to map and estimate crop areas in large territorial extensions in short and medium term, as performed by Rudorff et al. (2010), who mapped and monitored sugarcane in the Center South of Brazil through the Canasat project using techniques of visual interpretation on satellite images.
Among the data of remote sensing, the MODIS orbital sensor has great potential in the mapping of agricultural areas (Adami et al., 2010; Souza et al., 2015). The temporal series of vegetation indices (VI) allow to monitor the dynamics of agricultural cultivation through the analysis of the VI spectro-temporal profile and, then, identify and map semi-perennial crops such as sugarcane (Xavier et al., 2006; Alves et al., 2014) or other annual crops such as soybean and maize (Arvor et al., 2011; Johann et al., 2016).
The sensors Thematic Mapper (TM) and Operational Land Imager (OLI) of the Landsat satellite and Linear Imaging Self Scanning (LISS-3) of the IRS satellite are widely used because of their better spatial resolution (Landsat with 30 m and IRS with 23.5 m) when compared to the MODIS, which allows a better distinction of the terrestrial targets, as demonstrated by studies on the mapping of areas of sugarcane and other agricultural crops (Silva et al., 2010; Vieira et al., 2012; Adami et al., 2012; Zhou et al., 2015).
According to the data of IBGE (2016), the state of Paraná produced, on average, in the period of five years comprehended between 2011 and 2015, 47.3 million tons of sugarcane per year, which represents 6.4% of the national production, being the 4th largest producer. Thus, the state needs a rapid and efficient methodology to map these areas, especially because the Canasat project has been discontinued.
This study aimed to use images of the Landsat/TM/OLI and IRS/LISS-3 satellites associated with data of the TERRA and AQUA satellites of the MODIS sensor to map and estimate areas cultivated with sugarcane in the Paraná state.
Material and Methods
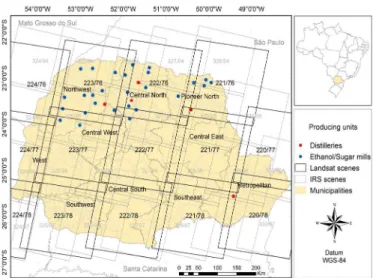
The Paraná state is located in the Southern region of Brazil, situated between the parallels 22º 29’ S and 26º 43’ S and meridians 48º 2’ W and 54º 38’ W (Figure 1).
The images of the Landsat/TM/OLI and IRS/LISS-3 satellites were made available by the United States Geological Survey (USGS, 2012) and by the National Institute for Space Research (INPE, 2016), and have, respectively, spatial resolutions of 30 and 23.5 m.
The supervised classification method of Maximum Likelihood (Maxver) was used to map sugarcane areas, following the example of other studies (Phongaksorn et al., 2012; Silva Junior et al., 2013; Mulianga et al., 2015). This algorithm makes the ‘pixel-to-pixel’ classification of the images, using the multispectral information of each pixel obtained in previously acquired training samples to find homogeneous
regions (classes). It is assumed that these classes have normal distribution, estimate the mean values of each class and the covariance matrix of the training samples to then compute the statistical probability of an unknown pixel of the image to be classified (Nery et al., 2013).
Here, the acquisition and selection of the set of training samples used in the classifications were performed in images from off-season periods of summer crops (maize and soybean) and winter crop (wheat), in false-color compositions RGB-564 for Landsat/OLI and RGB-453 for IRS/LISS-3 and Landsat/ TM. This step also used the spectro-temporal profile of the vegetation index EVI (Enhanced Vegetation Index) (Huete et al., 1997) of the TERRA and AQUA satellites of the MODIS sensor, so that the training samples were homogeneous and exclusively from sugarcane plantations. To obtain a maximum classification error of 5%, Eq.1 (Niel et al., 2005) was used to define the minimum size of training samples (540 pixels) for each orbit/point of the studied satellites and years. This procedure facilitated the learning of the Maxver classification in the mapping of sugarcane area, performed in the program ENVI 4.5 (EXELIS, 2016).
Figure 1. Paraná state with location and distribution of the mills and distilleries with the Landsat/TM/OLI and IRS/ LISS-3 scenes
n≈30× ×N K
where:
n - total of training samples;
N - dimension of the data (09 images, Landsat orbits/ points 223/76, 222/76, 221/76, 223/77, 222/77, 221/77, 223/78, 22/78 and 221/78 or IRS orbits/points 324/94, 325/94, 326/94, 327/94, 324/95, 325/95, 326/95, 327/95 and 328/95 illustrated in Figure 1); and,
K - number of classes (2 classes, sugarcane and not-sugarcane)
by the INPE (Rudorff et al., 2010). To obtain a sampling error of approximately 1.58%, 4000 samples are necessary, according to Barbetta (2007). Thus, a stratified sampling was applied, randomly selecting 2000 sampling pixels in each Sugarcane class and 2000 pixels in the Not-sugarcane class.
The last step consisted in the extraction of the mapped sugarcane area using a routine developed in the IDL programming language (Esquerdo et al., 2011), which counts the number of mapped pixels and multiplies it by the area of each pixel for each municipality. These data of municipal area of each crop year were compared with the municipal data of harvested area provided by the IBGE (2016) based on the statistical indicators: Spearman’s correlation coefficient (rs), because the data do not exhibit normality by the Shapiro-Wilk test at 0.05 significance level; mean error (ME) and the refined version of the Willmott’s index of agreement (dr) (Willmott et al., 2012), which measures the accuracy of the values estimated by the mapping in relation to the data from the IBGE.
Results and Discussion
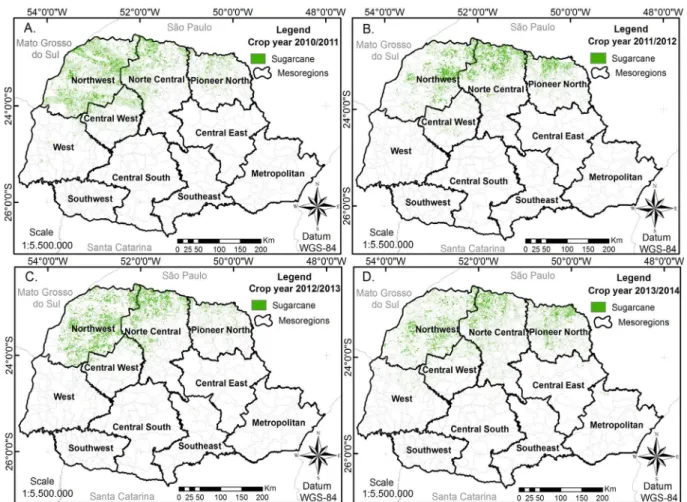
The results of the spatial distributions of the areas cultivated with sugarcane in the Paraná state evidenced a higher concentration in the mesoregions Northwest, Central North and Pioneer North (Figure 2), which corroborates official data of harvested area (in hectare) of the crop between the years 2008 and 2012 (IBGE, 2016).
The accuracy analysis for the mappings with the Kappa index varied from 0.8 (2010/11) to 0.84 (2013/14), indicating
excellent thematic quality (KI ≥ 0,81) (Table 1) according to Landis & Koch (1977). Phongaksorn et al. (2012), using the Landsat-/TM satellite in a sugarcane area in Thailand, obtained a KI of 0.92. Silva Junior et al. (2013) made an automatic detection of fires in sugarcane plantations and obtained the best result (KI = 0.90) with the Maxver classification with the treatment of radiometric correction.
Vieira et al. (2012), using segmentation and Object-Based Image Analysis (OBIA) in Landsat/TM/ETM images, mapped sugarcane in the Northern São Paulo state and obtained a KI of 0.87. With the same method, Schultz et al. (2015) found maximum KI values of 0.89, in an area to the South of the same state using various scenes of the Landsat-8 satellite.
Despite the size of the areas and different studied regions, these results were similar to those found in the present study, indicating that the mappings of sugarcane areas in Paraná with the Maxver classifier showed excellent results, allowing reliable estimates of areas, in a fast and objective way.
One of the reasons that led the Maxver classifier to be excellent was the method of acquisition of training samples, which was not exclusively based on the RGB false-color compositions of the Landsat and IRS, but also on the analysis of the spectro-temporal profile of the EVI vegetation index of the MODIS sensor, considerably decreasing the spectral confusion in the mapping process. In addition, the state does not have extensive areas of pasture, which normally generate a lot of spectral confusion in the mapping of sugarcane area.
The mean overall accuracy (OA) obtained through the Maxver classification in Paraná was 94.31% (Table 1), above the
Table 1. Accuracy indices obtained for the mappings of sugarcane area through Maxver
Crop/
Years KI
OA IE OE
Sugarcane Not sugarcane Sugarcane Not sugarcane
(%)
2010/11 0.80 93.51 10.31 16.42 19.11 10.43
2011/12 0.81 94.05 09.63 17.11 18.24 09.21
2012/13 0.83 94.22 07.42 15.23 16.32 07.33
2013/14 0.84 94.75 06.24 14.43 15.53 06.04
85% considered as desirable by Foody (2002). Similar results were observed by Phongaksorn et al. (2012) with GE of 96%; by Vieira et al. (2012) with GE of 94%; by Silva Junior et al. (2013) with GE of 93%; by Mulianga et al. (2015) with 90% and by Adami et al. (2012), who evaluated the thematic accuracy of the mapping in the crop year of 2010/11 generated by the Canasat, found OA of 98%.
The high accuracy obtained in this study indicates that the methodology is efficient in the mapping of sugarcane crop area; however, the accuracy must also be analyzed individually by the errors IE and OE. The samples randomly selected on the mappings of sugarcane crop had a variation from 6.24% (crop year 2013/14) to 10.31% (crop year 2010/11) of IE (Table 1).
In the samples randomly selected on the not-sugarcane areas, there was a variation between 14.43% (crop year 2013/14) and 16.42% (crop year 2010/11) of IE, which represents the values of the sugarcane crop not selected by the classification. The OE varied between 15.53% (crop year 2013/14) and 19.11% (crop year 2010/11), and that is the proportion of reference samples that were excluded from the class to which they belonged.
Vieira et al. (2012) obtained IE of 5.1% for the Sugarcane class and 6.6% for the Not-sugarcane class, and the OE were 9.7% for the Sugarcane class and 3.4% for the Not-sugarcane class. Mulianga et al. (2015), mapping sugarcane areas, found IE of 4.2% and OE of 20%.
Adami et al. (2012) obtained a mean overall error for sugarcane of 2% with an inclusion of mean error of 2%, compensated by the omission of the mean error of also 2%, and concluded that the Canasat maps have excellent thematic quality. Although the Canasat maps show higher accuracy, the procedure for their generation consists in a more costly and time-consuming method, compared with the Maxver, which allows estimates of area prior to harvest.
Although the OE and IE obtained by Adami et al. (2012) are lower than those obtained in the present study in Paraná, the use of Maxver supervised classification in this study has the great advantage of being automatic and agile in the estimate of sugarcane areas in the state, which consequently allows anticipation of agricultural statistics by the official organs or companies interested in the information.
In addition, it should be highlighted that the evaluation of spatial accuracy in Paraná was made with large number of samples (4000) generated from the reference of the Canasat maps, which gives statistical reliability in the analyses presented here.
The area obtained by the mapping in the Paraná state had an increase of 18.63 thousand ha (2.73%) in the period between 2010/11 and 2013/14 (Table 2). Rudorff et al. (2010) reported an area increment of 1.88 million ha (73.2%) between 2003/04 and 2008/09 in São Paulo, concluding that the large growth in
this period occurred due to the demand for ethanol caused by the advent of vehicles equipped with the Flex-fuel technology from 2003 on in Brazil.
In the comparison between the official data of IBGE and those of the mappings (Table 2), there was a mean overestimation of 6.03% in the four evaluated crop years. The greatest difference occurred in the crop year 2012/13 (8.74%), while the lowest difference occurred in the crop year 2013/14 (3.03%), showing higher KI, which can be partially explained by the greater availability of images for acquisition, being free from clouds on the dates of off-season periods of the summer crops and quality of the OLI sensor images.
Silva et al. (2010), based on the analysis of information on sugarcane cultivation area of the Canasat, observed a growth of 3.21 million ha (76.2%) between 2005/06 and 2009/10, which occurred mostly because of the construction of new processing facilities. In Paraná, the growth was 77.5%, but in the comparison of the last crop years (2008/09 com 2009/10) there was a decrease of area expansion and also in other states.
According to Aguiar et al. (2011), the decrease in harvested areas in the São Paulo state from the crop years 2008/09 and 2009/010 was influenced by the economic crisis, which also corroborates with the stabilization of growth in the estimates of areas observed in the Paraná state by the mapping generated through Maxver in the period between 2010/11 and 2013/14 (Table 2).
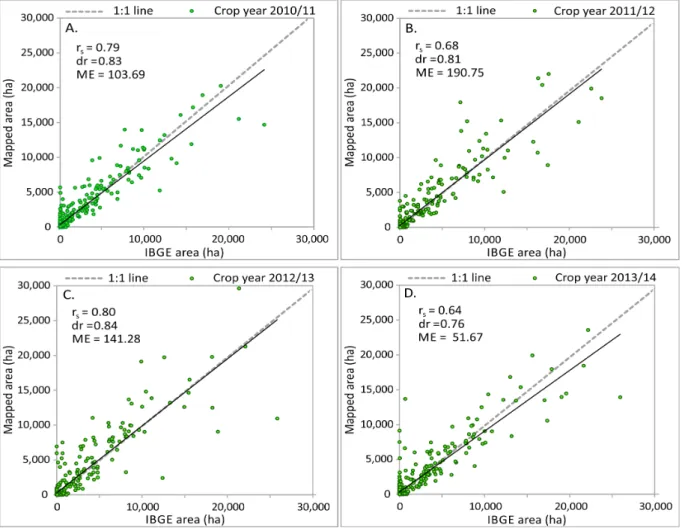
The official data of area from IBGE and those estimated in the mappings of sugarcane areas showed correlations (rs) (Figure 3) that varied from 0.64 (crop year 2013/14) to 0.80 (crop year 2012/13), although they overestimated the area cultivated with sugarcane.
The mean error (ME) indicated that, on the state scale, the area obtained by the mapping was overestimated only between 51.67 ha (2013/14) and 141.28 ha (2012/13), compared with the official data from IBGE, showing a consistency between what was mapped and the official data.
The refined Willmott’s index of agreement (dr) evidenced a high accuracy of the estimated values (sugarcane mapping) in comparison to the official data (IBGE) in all crop years evaluated, since the trend line of these data (Figure 3) is close
Variables Crop years
2010/11 2011/12 2012/13 2013/14
Official area (ha) 641,765 655,509 645,280 681,152 Mapping area (ha) 683,137 694,114 701,650 701,767 Difference (Map - Official) (ha) 041,372 038,605 056,370 020,615 Difference (%) 6.45 5.89 8.74 3.03
Table 2. Official sugarcane area according to IBGE and to
the mappings generated by the Maxver method (2010/11 and 2013/14)
to the 1:1 line and with values ranging from 0.76 (crop year 2013/14) to 0.84 (crop year 2012/13).
In general, these statistical indicators show that, although there are differences between the estimates of sugarcane area obtained through the Maxver method and the official data, it is possible to know, besides estimating the sugarcane area earlier, the spatial distribution (Figure 2) with which the crop is cultivated in the state.
Conclusions
1. The Maxver classification method showed excellent results in the mapping of sugarcane in Paraná, allowing reliable estimates of area, in a fast and objective way.
2. The obtained mappings showed optimal performance in the analysis of spatial accuracy using, as reference, the Canasat maps. The high accuracy obtained in the evaluation indicates that the methodology is efficient in the mapping of areas cultivated with sugarcane and can also be analyzed individually, from the analyses of the errors IE and OE.
3. The use of MODIS sensor images for the acquisition of sampling sets through the analysis of the spectro-temporal profile of EVI was essential to decrease the spectral confusion in the process of selection of homogeneous training samples, which caused the performance of the Maxver classifier to be more efficient.
4. The use of the Maxver supervised classification has the great advantage of being automatic and agile in the estimate of sugarcane areas in the state, which consequently allows to assist in the development of public policies and an earlier provision of agricultural statistics.
Acknowledgments
The authors thank the support from the Coordination for the Improvement of Higher Education Personnel (CAPES), Ministry of Education of Brazil, through the grant of the master’s scholarship to the first author, and to the PhD. Bernardo F. T. Rudorff for providing the reference vector maps of the Canasat.
Literature Cited
Adami, M.; Mello, M. P.; Aguiar, D. A.; Rudorff, B. F. T.; Souza, S. A. F. A Web platform development to perform thematic accuracy assessment of sugarcane mapping in South-Central Brazil. Remote Sensing, v.4, p.3201-3214, 2012. https://doi.org/10.3390/ rs4103201
Adami, M.; Rizzi, R.; Moreira, M. A.; Rudorff, B. F. T.; Ferreira, C. C. Amostragem probabilística estratificada por pontos para estimar a área cultivada com soja. Pesquisa Agropecuária Brasileira, v.45, p.585-592, 2010. https://doi.org/10.1590/S0100-204X2010000600008
Aguiar, D. A.; Rudorff. B. F. T.; Silva, F. W.; Adami, M.; Mello, M. P. Remote sensing images in support of environmental protocol: Monitoring the sugarcane harvest in São Paulo State, Brazil. Remote Sensing, v.3, p.2682-2703, 2011. https://doi.org/10.3390/rs3122682 Alves, C. D.; Florenzano, T. G.; Alves. D. S.; Pereira, M. N. Mapping land use land cover changes in a region of sugarcane expansion using TM and MODIS. Revista Brasileira de Cartografia, v.2, p.337-347, 2014. Arvor, D.; Jonathan, M.; Meirelles, M. S. P.; Dubreuil, V.; Duriex, L.
Classification of MODIS EVI time series for crop mapping in the State of Mato Grosso, Brazil. International Journal of Remote Sensing, v.29, p.1-25, 2011. https://doi.org/10.1080/01431161.20 10.531783
Barbetta, P. A. Estatística aplicada às ciências sociais. Florianópolis: UFSC, 2007. 316p.
Congalton, R. G. A review of assessing the accuracy of classifications of remotely sensed data. Remote Sensing of Environment, v.37, p.35-46, 1991. https://doi.org/10.1016/0034-4257(91)90048-B Esquerdo, J. C. D. M.; Zullo Junior, J.; Antunes, J. F. G. Use of NDVI/
AVHRR time series profiles for soybean crop monitoring in Brazil. International Journal of Remote Sensing, v.32, p.3711-3727, 2011. https://doi.org/10.1080/01431161003764112
EXELIS - Visual Information Solutions. Products and Solutions: Environment for Visualizing Images. 2016. <http://www.exelisvis. com/ProductsServices.aspx>. 7 Fev. 2015.
Foody, G. M. Status of land cover classification accuracy assesment. Remote Sensing of Environment, v.80, p.185-201, 2002. https:// doi.org/10.1016/S0034-4257(01)00295-4
Huete, A.; Liu, H. Q.; Batchily, K.; Leween, W. A comparison of vegetation indices over a global set of TM images for EOS-MODIS. Remote Sensing of Environment, v.59, p.440-451, 1997. https://doi. org/10.1016/S0034-4257(96)00112-5
IBGE – Instituto Brasileiro de Geografia e Estatística. Banco de dados agregados: Sistema IBGE de recuperação automática – Sidra. 2016. <http://www.sidra. ibge.gov.br>. 6 Mar. 2016.
INPE – Instituto Nacional de Pesquisas Espaciais. Catálogo de imagens. 2016. <http://www.dgi.inpe.br/CDSR/>. 18 Abr. 2016.
Johann, J. A.; Becker, W. R.; Uribe-Opazo, M. A.; Mercante, E. Uso de imagens do sensor orbital Modis na estimação de datas do ciclo de desenvolvimento da cultura da soja para o estado do Paraná-Brasil. Engenharia Agrícola, v.36, p.126-142, 2016. https://doi. org/10.1590/1809-4430-Eng.Agric.v36n1p126-142/2016
Landis, J. R.; Koch, G. G. The measurement of observer agreement for categorical data. Biometrics, v.33, p.159-174, 1977. https://doi. org/10.2307/2529310
Mulianga, B.; Bégué, A.; Clouvel, P.; Todoroff, P. Mapping Cropping Practices of a sugarcane-based cropping system in Kenya using remote sensing. Remote Sensing, v.7, p.14428-14444, 2015. https:// doi.org/10.3390/rs71114428
Nery, C. V. M.; Fernandes, F. H. S.; Moreira, A. A.; Braga, F. L. Avaliação das técnicas de classificação Maxver, Maxver – ICM e Distância Mínima Euclidiana de acordo com Índice Kappa. Revista Brasileira de Geografia Física, v.6, p.320-328, 2013.
Niel, T. G. van; Mcvicar, T. R.; Datt, B. On the relationship between training sample size and data dimensionality: Monte Carlo analysis of broadband multi-temporal classification. Remote Sensing of Environment, v.98, p.468-480, 2005. https://doi. org/10.1016/j.rse.2005.08.011
Phongaksorn, N.; Tripathi, N. K.; Kumar, S.; Soni, P. Inter-sensor comparison between THEOS and Landsat 5 TM data in a study of two crops related to biofuel in Thailand. Remote Sensing, v.4, p.354-376, 2012. https://doi.org/10.3390/rs4020354
Rudorff, B. F. T.; Aguiar, D. A.; Silva, W. F., Sugawara, L. M., Adami, M., Moreira, M. A. Studies on the rapid expansion of sugarcane for ethanol production in São Paulo state (Brazil) using Landsat data. Remote Sensing, v.2, p.1057-1076, 2010. https://doi.org/10.3390/ rs2041057
Schultz, B.; Immitzer, M.; Formaggio, A. R.; Sanches, I. D. A.; Barreto Luiz, A. J.; Atzberger, C. Self-guided segmentation and classification of multi-temporal Landsat 8 images for crop type mapping in Southeastern Brasil. Remote Sensing, v.7, p.14482-14508, 2015. https://doi.org/10.3390/rs71114482
Silva, W. F.; Aguiar, D, A.; Rudorff, B. F. T.; Sugawara, L. M. Canasat project: Monitoring of the sugarcane cultivation area in south central Brazil. ISPRS TC VII Symposium - 100 years,7, 2010, Vienna. Anais…. Vienna: IAPRS, p.535-540, 2010.
Silva Junior, C. A.; Bacani, V. M.; Carvalho, L. A. Rotinas de tratamento digital de imagem Landsat 5/TM para a identificação de queimadas em lavouras canavieiras. Bioscience Journal, v.29, Supplement 1, p.1514-1523, 2013.
Souza, C. H. W.; Mercante, E.; Johann, J. A.; Lamparelli, R. A. C.; Uribe-Opazo, M. A. Mapping and discrimination of soya bean and corn crops using spectro-temporal profiles of vegetation indices. International Journal of Remote Sensing, v.36, p.1809-1824, 2015. https://doi.org/10.1080/01431161.2015.1026956
USGS – United States Geological Survey. Earth Explorer. Landsat Data Continuity Mission (LDCM) – Mission Data – Data Format Control Book (DFCB), 2012. <http://earthexplorer.usgs.gov/>. 18 Abr. 2016.
Vieira, M. A.; Formaggio, A. R.; Rennó, C. D.; Atzb erger, C.; Aguiar, D. A.; Mello, M. P. Object Based Image Analysis and Data Mining applied to a remotely sensed Landsat time-series to map sugarcane over large areas. Remote Sensing of Environment, v.123, p.553-562, 2012. https://doi.org/10.1016/j.rse.2012.04.011
Willmott, C. J.; Roberson, S. M.; Matsuura, K. A Refined Index of Model Performance. International Journal of Climatology, v.32, p.2088-2094, 2012. https://doi.org/10.1002/joc.2419
Xavier, A. C.; Rudorff, B. F. T.; Shimabukuro, E.; Berka, L. M. S.; Moreira, M. A. Multi-temporal anlysis of MODIS data to classify sugarcane crop. International Journal of Remote Sensing. Taylor & Francis, London, v.27, p.755-768, 2006.