Ability of non-linear mixed models to predict growth in laying hens
Luis Fernando Galeano-Vasco1, Mario Fernando Cerón-Muñoz1, William Narváez-Solarte2
1 Grupo de Investigación GaMMA, Facultad de Ciencias Agrarias, Universidad de Antioquia, Medellín, Colombia. 2 Universidad de Caldas, Manizales, Colombia.
ABSTRACT - In this study, the Von Bertalanffy, Richards, Gompertz, Brody, and Logistics non-linear mixed regression models were compared for their ability to estimate the growth curve in commercial laying hens. Data were obtained from 100 Lohmann LSL layers. The animals were identified and then weighed weekly from day 20 after hatch until they were 553 days of age. All the nonlinear models used were transformed into mixed models by the inclusion of random parameters. Accuracy of the models was determined by the Akaike and Bayesian information criteria (AIC and BIC, respectively), and the correlation values. According to AIC, BIC, and correlation values, the best fit for modeling the growth curve of the birds was obtained with Gompertz, followed by Richards, and then by Von Bertalanffy models. The Brody and Logistic models did not fit the data. The Gompertz nonlinear mixed model showed the best goodness of fit for the data set, and is considered the model of choice to describe and predict the growth curve of Lohmann LSL commercial layers at the production system of University of Antioquia.
Key Words: chickens, mathematical models, poultry, regression analysis, weight gain ISSN 1806-9290
www.sbz.org.br R. Bras. Zootec., 43(11):573-578, 2014
Received January 14, 2014 and accepted August 5, 2014. Corresponding author: [email protected] http://dx.doi.org/10.1590/S1516-35982014001100003
Copyright © 2014 Sociedade Brasileira de Zootecnia. This is an Open Access article distributed under the terms of the Creative Commons Attribution Non-Commercial License, which permits unrestricted non-commercial use, distribution, and reproduction in any medium, provided the original work is properly cited.
Introduction
Growth can be defined as body weight gain or weight gain of body parts with age. This process is influenced by genetic and environmental conditions. A common practice in poultry production is to measure the increase in body mass of birds to control and modify the external conditions that affect their weight gain (Oliveira et al., 2000; Agudelo Gómez et al., 2008; Aggrey, 2009).
Mathematical models have been applied to poultry production for the study of performance events through their simplification and characterization. An example is the construction of the curve-fitting models that relate the age of the bird with its weight, which allows estimating the age at which the animal stops growing, when it reaches sexual maturity, and characterizing the different phases of growth in the hen (Laird, 1965; Grossman et al., 1985; Grossman and Koops,1988; Galeano-Vasco and Cerón-Muñoz, 2013).
The modeling of growth performance in laying hens is an elaborate process due to the use of parameters which are difficult to interpret from a biological perspective, and the difficulty to predict the events that are influenced by the
variation of the observations in time (Aggrey, 2002; Aggrey, 2009; Galeano-Vasco et al., 2013).
An alternative is the use of nonlinear mixed models, which include the fixed effects that refer to the population mean of the parameter and random effects that indicate the differences between the mean value of the parameter and the adjusted value for each individual (Wang and Zuidhof, 2004). For Littell et al. (2000), the fixed effects correspond to the expected values, while the random effects are the variance and covariance of the observations. Therefore, applying mixed models to longitudinal measurements of growth allows quantifying the variability between animals and in each animal. Other advantages of these models are that they can handle unbalanced data and have a flexible covariance structure (Pinheiro and Bates, 1995; Aggrey, 2009), because in the animal investigation it is common to have data with dependence structures, missing values and lack of normality.
The current study was designed to compare Von Bertalanffy, Richards, Gompertz, Brody and Logistics non-linear regression models for their ability to estimate the growth curve in hens. The models were modified to include random effects (mixed models). We used weight records from Lohmann LSL layers obtained on a commercial egg farm in Antioquia, Colombia.
Material and Methods
located on La Montaña Farm, at University of Antioquia, located in the municipality of San Pedro de los Milagros (Antioquia, Colombia) at 6°19'19" North latitude, 1°37'40" West longitude and 2,350 m altitude. Average outdoor, maximum and minimum temperatures in this region are 15 ºC, 22 ºC and 7 °C, respectively.
At 0-13 weeks of age birds were reared in floor pens and then moved into cages which housed 4 birds/ cage (730 cm2 hen–1). The birds were identified and
then weighed from day 20 after hatch until they were 553 days of age. From 0-2 wk, all birds received a starter diet followed by a grower diet, which was fed to nine weeks of age. The developer and layer diets were fed from 10-16 and 17-80 wk of age, respectively (Table 1). The chickens consumed fresh and purified waterad libitum at all times. Supplemental heating was provided from 0-6 weeks, and no environmental control was provided afterwards.
Five nonlinear models used for the analysis of growth curves were adapted to mixed models, with the inclusion of random parameters:
(1) Brody (Brody, 1945):
yij = (β0 + b0i) * (1 − β1exp(β2 + b2i)* tij) + εij
(2) Logistic (Verhulst, 1838):
yij = (β0 + b0i) * (1 − exp−β1* tij)−1 + εij
(3) Gompertz (Gompertz, 1825):
yij = (β0 + b0i) * exp−β1* exp(−β2 + b2i) * tij + εij
(4) Von Bertalanffy (Bertalanffy, 1938): yij = (β0 + b0i) * (1 − β1* exp(−β2 + b2i)* tij)3 + εij
(5) Richards (Richards, 1959):
yij = (β0 + b0i) * (1 − β1 * exp(−β2 + b2i)* tij) −(1⁄m) + εij
In which yij = body weight (g) of the i-th bird at the j-th
time; t = time, age in days; β0= fixed component of the
model, associated with the asymptotic weight when t tends to infinity (percentage of maturity with respect to adult weight); β1= fixed component of the model, defined as the
adjusting parameter when Y≠0 or t≠0; β2= fixed component
of the model, representing the maturity index expressed as a proportion of the percentage of maximum growth with regard to the adult weight of the bird; b0i and b2i = random
effects associated with the β1 and β2 fixed effects, which in
turn define the variance and covariance of the observations for each fixed effect for the i-th bird; m = asymptotic weight proportion corresponding to the inflexion point; and εij= residual effect associated with the i-th bird at j-th time.
The residue and the random effects were assumed to be independent and normally distributed with zero mean and constant variance.
The models were compared using log maximum likelihood (-2 Log L), Akaike’s information criterion (AIC) (Akaike, 1974), and Bayesian information criterion (BIC) (Schwartz, 1978). Lower AIC and BIC values indicate a better model fit to the original data. The correlation between observed and predicted data was obtained with the Pearson method. For data analysis and model-programming, NLMIXED procedures of SAS (Statistical Analysis System, version 9.0) was used.
Results and Discussion
Based on information on the body weight data used to model the growth curve with the nonlinear mixed models (Table 2) we calculated the weight gain (body weight weekn+1 - body weight weekn).
The average daily feed intake (Table 3) between weeks 3-10 was 3.67 g higher than the average level recommended by the guide. This effect was greater between weeks 8 and 10 (5.6 g/hen/day), with an average gain of 80 g/week, presenting a peak increase in weight at week 7 (122.7 g). The purpose of providing more food in these weeks was to increase the weight of the birds before they were moved to the cages. Between weeks 14 and 17, we observed a decrease of 1.53 g to below average 71.4 g of feed intake
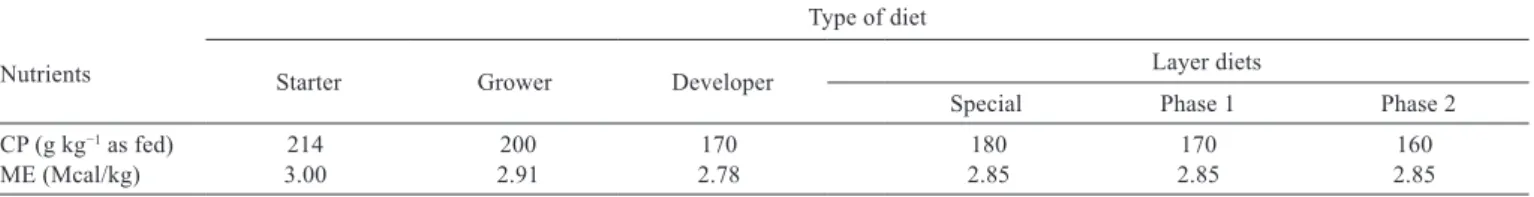
Table 1 - Nutritional composition of diets supplied to the birds in the evaluation period
Nutrients
Type of diet
Starter Grower Developer Layer diets
Special Phase 1 Phase 2
CP (g kg−1 as fed) 214 200 170 180 170 160
ME (Mcal/kg) 3.00 2.91 2.78 2.85 2.85 2.85
CP - crude protein, ME - metabolizable energy.
recommended by the management guide, as a result of adaptation of the bird to the cage, the drinking system, feeders and social interactions with other birds. A similar trend occurred in the weight gain from 153 to 74.65 g/week in this same period.
The greatest average weight gains were observed between weeks 14 and 23, reaching a maximum value of 163 g/bird at 144 days (20.6 weeks). Previous reports (Grossman and Koops, 1988; Kwakkel et al., 1993) indicate that the increase in bird weight is associated with sexual maturity and precedes the onset of the egg production cycle of the bird, and is also defined as the third phase of growth. Weeks 18 through 20 showed an increase in the average level of feed intake (87 g), which could have an effect on the increasing weight gain of birds of 74.65 to 147.5 g/week in the aforementioned period. Following this plan, feed restriction was applied between weeks 22 and 27, reaching 113.3 g/hen/day at week 28 (1.3 g above the theoretical intake). From weeks 28 to 80, the average intake per bird day was 2.4 g higher than that recommended by the management guide throughout the period, and weight gain was stabilized at an average of 0.6 g/week.
The Gompertz model had the best fit for modeling the growth curve of the birds, according to AIC and BIC (Table 4). In a descending order, models were ranked
as follows: Gompertz, Richards, and Von Bertalanffy. Pearson’s correlation coefficients were higher than 0.957 for the three models, indicating good fit and high ability to predict weight gain during the rearing, growing, and laying periods. The Brody and Logistic models did not fit the growth curve, so they were not considered in the results.
The graphs of the residuals showed that all models underestimate weight from days 100 to 150, a period that coincided with the onset of laying, indicating changes in body weight of birds that the models did not estimate (Figure 1).
The β0 value of the parameters estimated by Richards
and Gompertz models was over 1,500 to 1,600 g, which is the weight range proposed by Lohmann® (Table 5). The β
0
estimation by Von Bertalanffy was below the weight range. The estimation and analysis of the asymptotic weight is essential to evaluate and project the flock efficiency, as underweight animals have delayed onset of sexual maturity and tend to lay fewer eggs (Kirikçi et al., 2007).
According to Gompertz, weight at the inflection point (Yi = β0/e) was 610.85 g, reached at 59 days of age. The
weight proportion at the inflection point with respect to the asymptotic weight (Yi/β0) was 36.79%, confirming that
Gompertz model has a fixed inflection point at 37% of the asymptotic weight, as stated by Tabatabai et al. (2005).
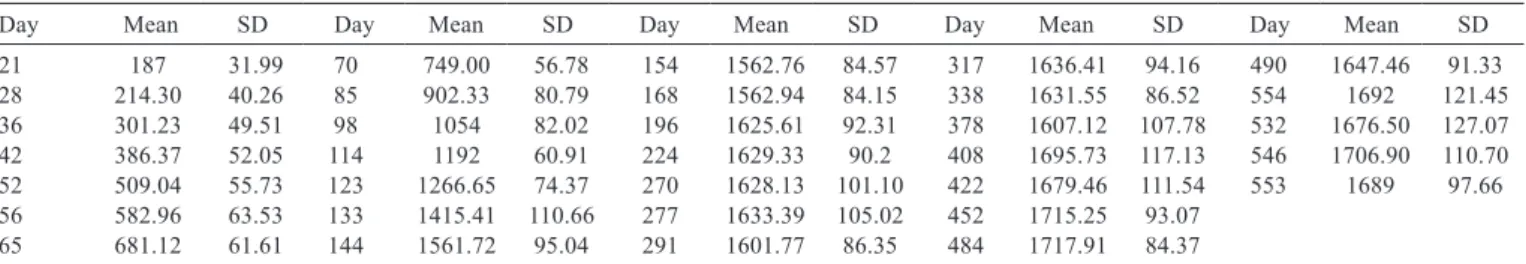
Table 2 - Body weight data of Lohmann LSL hens used to model the growth curve with nonlinear mixed models
Day Mean SD Day Mean SD Day Mean SD Day Mean SD Day Mean SD
21 187 31.99 70 749.00 56.78 154 1562.76 84.57 317 1636.41 94.16 490 1647.46 91.33
28 214.30 40.26 85 902.33 80.79 168 1562.94 84.15 338 1631.55 86.52 554 1692 121.45
36 301.23 49.51 98 1054 82.02 196 1625.61 92.31 378 1607.12 107.78 532 1676.50 127.07
42 386.37 52.05 114 1192 60.91 224 1629.33 90.2 408 1695.73 117.13 546 1706.90 110.70
52 509.04 55.73 123 1266.65 74.37 270 1628.13 101.10 422 1679.46 111.54 553 1689 97.66
56 582.96 63.53 133 1415.41 110.66 277 1633.39 105.02 452 1715.25 93.07
65 681.12 61.61 144 1561.72 95.04 291 1601.77 86.35 484 1717.91 84.37
Day - day of measurement; Mean - average hen weight; SD - standard deviation.
Table 3 - Differences between the amount of feed intake per bird day–1 and the amount recommended by the management guide of Lohmann
LSL hens (weeks 1 to 25)
Week Dif Week Dif Week Dif Week Dif Week Dif Week Dif Week Dif Week Dif Week Dif
1 0.74 4 1.41 7 3.25 10 7.42 13 6.47 16 –0.47 19 82.09 22 –9.01 25 –6.79
2 0.61 5 1.25 8 7.06 11 3.77 14 –0.41 17 –3.72 20 92.30 23 –10.79
3 1.65 6 1.92 9 5.42 12 3.46 15 5.00 18 –1.97 21 87.68 24 –8.82
Dif - actual feed intake (g/hen/day) – theoretical feed intake (g/hen/day).
Table 4 - Classification based on information criteria and correlation value of non-linear mixed models used to evaluate growth of Lohmann LSL hens
Model –2 Log likelihood AIC1 BIC1 Correlation2
Gompertz 8405.4 8419.4 8428.2 0.991*
Richards 8408.0 8424.0 8434.1 0.990*
Von Bertalanffy 8464.3 8478.3 8487.1 0.957*
1 Low values indicate better fit of the model to the data.
2 Correlation between observed and predicted data obtained with the Pearson method.
When parameter m is equal to one in the Gompertz and Richards models, the inflection point is at the same place (Nahashon et al., 2006). Parameter m value was 2.29E-03, so the inflection point by both models differed. For the Richards model, weight at the inflection point was 623.53 g (Yi = β0/(m+1)(1/m)) at 61 days of age. Therefore, Gompertz
and Richards models placed the inflection point between weeks 8 and 9 of the bird age.
With regard to growth, birds reached 89% of the asymptotic weight ( = 1403±118.7 g) at 133 days of age, and 94% ( = 1553±98.8 g) at 144 days. Therefore, the estimated weight of the birds was 90% of the adult weight at 140 days (starting production or sexual maturity). A goal in raising laying hens is to avoid early maturity (before 18 weeks), because under such circumstances precocious birds tend to lay low-weight eggs (Rafart et al., 2006). In
Table 5 - Parameters estimated by nonlinear-mixed growth models used to evaluate Lohmann LSL birds
Parameters Models
Gompertz Richards Von Bertalanffy
β0 1660.46±15.5 1678.28±18.6 1483.59±50.1
b0 72.68±11.9 80.08±14.3 192.84±51.4
β1 2.44±3.7E–02 5.54E–04±6.9E–04 0.55±1.2E–02
β2 2.30E–02±5.1E–04 2.24E–02±5.4E–04 2.74E–02±7.4E–04
b2 1.84E–03±3.6E–04 1.84E–03±4.5E–04 1.36E–02±2.5E–03
m 2.29E–03
e 73.37±2.01 72.64±2.22 72.51±1.99
β0, β1 and β2 - estimated fixed parameters; b0 and b2 - estimated random parameters; m - asymptotic weight proportion corresponding to the inflexion point in Von Bertalanffy model,
Scientific notation a*E-n where E is equal to 10, n is an integer, and a is any real number; e - error of estimation.
Figure 1 - Growth curves of Lohman LSL birds, estimated by the models: Gompertz (A), Richards (B) and Von Bertalanffy (C) and projected growth curve by the Gompertz model for Lohmann LSL hens under the University of Antioquia production system (D).
addition to weight, other factors such as feed management, nutrient intake, and the lighting program (duration of photo-stimulation and light intensity) affect the age at which birds reach sexual maturity (Joseph et al., 2003).
The Gompertz and Richards models share a similar pattern throughout the curve (Figure 1). As reported by Oliveira (2000), both models fit well the initial weights. On the other hand, parameters generated by the Von Bertalanffy model were skewed until day 224 and thereafter their trend was similar to the other models.
Two graphs are plotted for the expected growth projection based on the information generated by the Gompertz-Laird model. In the first graph, the ideal weights should fall between the purple lines, tending to fit the average demarcated by the blue line (Figure 1).
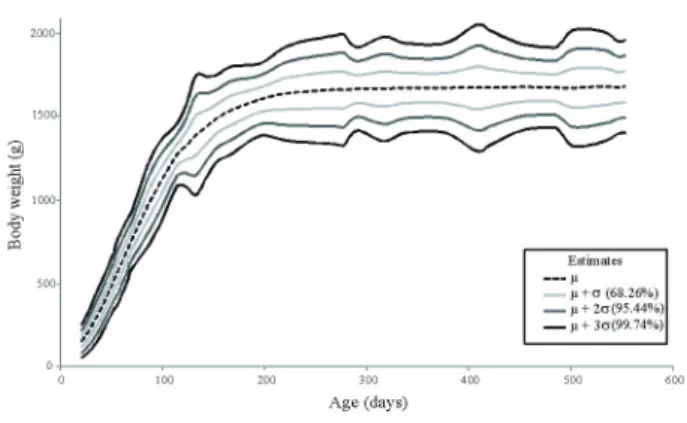
The weight dispersion of the population was assigned to one of three ranges created based on increases of one, two, or three standard deviations from the mean (Figure 2).
These graphical models allow evaluating the physical development of Lohmann LSL flocks at the farm of the University of Antioquia, as they correspond to the response of the birds under the conditions of that production system.
Although the ability to estimate and fit by the Gompertz and Richards models are similar, the former has the best fit to the variability of animal weight with increasing age.
This paper provides a model to evaluate poultry development, allowing to know the system productive parameters and to determine optimal growth ranges for Lohmann LSL birds under environmental conditions and farm management.
Acknowledgments
The authors thank the Departamento de Formación Académica de Haciendas of the University of Antioquia for data collection. This research was funded by the University of Antioquia (CODI Sostenibilidad 2014/ E01808 y Convocatoria Mediana cuantía “Diseño y validación de sistemas de apoyo a la toma de decisiones en granjas avícolas productoras de huevo comercial” E01533) and the Colombian Departamento Administrativo de Ciencia, Tecnología e Innovación (COLCIENCIAS), (Convocatoria Nacional para Estudios de Doctorados en Colombia 528, año 2011).
References
Aggrey, S. E. 2002. Comparison of three nonlinear and spline regression models for describing chicken growth curves. Poultry Science 81:1782-1788.
Aggrey, S. E. 2009. Logistic nonlinear mixed effects model for estimating growth parameters. Poultry Science 88:276-280. Agudelo Gómez, D. A.; Cerón Muñoz, M. F. and Restrepo Betancur,
L. F. 2008. Modelación de las funciones de crecimiento aplicadas a la producción animal. Revista Colombiana de Ciencias Pecuarias 21:39-58.
Akaike, H. 1974. A new look at the statistical model identification. IEEE Transactions on Automatic Control AC 19:716-723. Available at: <http://www.unt.edu/rss/class/Jon/MiscDocs/Akaike_ 1974.pdf.> Accessed on: Dec. 1, 2013.
Bertalanffy, L. von. 1938. A quantitative theory of organic growth. Human Biology 10:181-213.
Brody, S. 1945. Bioenergetics and growth; with special reference to the efficiency complex in domestic animals. Reinhold Publishing Corporation, New York.
Galeano-Vasco, L. and Cerón-Muñoz, M. F. 2013. Modelación del crecimiento de pollitas mediante el uso de redes neuronales. Revista MVZ de Córdoba 18:3861-3867.
Galeano-Vasco, L.; Cerón-Muñoz, M. F.; Rodríguez, D. and Cotes, J. M. 2013. Uso del modelo de distribución con retardo para predecir la producción de huevos en gallinas ponedoras. Revista Colombiana de Ciencias Pecuarias 26:270-279.
Gompertz, B. 1825. On the nature of the function expressive of the law of human mortality, and on a new mode of determining the value of life contingencies. Philosophical Transactions of the Royal Society of London 115:513-585.
Grossman, M.; Bohren, B. B. and Anderson, V. L. 1985. Logistic growth curve of chickens: a comparison of techniques to estimate parameters. Journal of Heredity 76:397-399.
Figure 2 - Projected growth curve of Lohmann LSL hens using the Gompertz model based on population deviations, for the production system of the University of Antioquia. µ- mean; σ - standard deviation.
Conclusions
Grossman, M. and Koops, W. J. 1988. Multiphasic analysis of growth curves in chickens. Poultry Science 67:33-42.
Joseph, N. S.; Robinson, F. E.; Renema, R. A. and Thorsteinson, K. A. 2003. Comb growth during sexual maturation in female broiler breeders. The Journal of Applied Poultry Research 12:7-13 Kirikçi, K.; Günlü, A.; Çetin, O. and Garip, M. 2007. Effect of hen
weight on egg production and some egg quality characteristics in the partridge (Alectoris graeca). Poultry Science 86:1380-1383 Kwakkel, R. P.; Ducro, B. J. and Koops, W. J. 1993. Multiphasic
analysis of growth of the body and its chemical components in White Leghorn pullets. Poultry Science 72:1421-1432.
Laird, A. K.; Tyler, S. A. and Barton, A. D. 1965. Dynamics of normal growth. Growth 29:233-248.
Littell, R. C.; Pendergast, J. and Natarajan, R. 2000. Modeling covariance structure in the analysis of repeated measures data. Statistics in Medicine 19:1793-1819.
Nahashon, S. N.; Aggrey, S. E.; Adefope, N. A.; Amenyenu, A. and Wright, D. 2006. Growth characteristics of pearl gray guinea fowl as predicted by the Richards, Gompertz, and logistic models. Poultry Science 85:359-363.
Oliveira, H. N.; Lôbo, R. B. and Pereira, C. S. 2000. Comparação de modelos não-lineares para descrever o crescimento de fêmeas da raça Guzerá. Pesquisa Agropecuária Brasileira 35:1843-1851.
Pinheiro, J. C. and Bates, D. M. 1995. Approximations to the Log-likelihood function in the nonlinear mixed-effects model. Journal of Computational and Graphical Statistics 4:12-35.
Rafart, J.; Revidatti, F.; Terraes, J. C.; Sindik, M. and Rollet, C. 2006. Evaluación de la fase de cría, recría y pre-postura de ponedoras Rubia-INTA en la Escuela Agrotécnica Lomas de Empedrado. Comunicaciones Científicas y Tecnológicas Universidad Nacional del Nordeste. Available at: <http://www.produccionbovina.com. ar/produccion_aves/produccion_avicola/66-cria.pdf>. Accessed on: Dec. 1, 2013.
Richards, F. J. 1959. A flexible growth function for empirical use. Journal of Experimental Botany 10:290-301.
Schwarz, G. 1978. Estimating the dimension of a model. Annals of Statistics 6:461-464.
Tabatabai, M.; Williams, D. K. and Bursac, Z. 2005. Hyperbolastic growth models: theory and application. Theoretical Biology & Medical Modelling 2:1-13.
Verhulst, P. F. 1838. Notice sur la loi que la population poursuit dans son accroissement. Correspondence of Mathematical Physics 10:113-121.