http://dx.doi.org/10.1590/1806-9061-2016-0357
Mini Chickens
Author(s)
Decai XI
Zhiyong ZI
Bin ZI
Zhongcheng HII
Quanshu WII
Jing LIII,IV
I Institute of Pig and Animal Nutrition ,
Yun-nan Animal Science and Veterinary Institu-te, Kunming, Yunnan 650224, China)
II Husbandry and Veterinary Bureau of
Pin-gbian Country, Honghe, Yunnan 661200, China)
III Agricultural college, Kunming University,
Kunming, Yunnan 650214, China)
IV Engineering Research Center for Urban
Modern Agriculture of Higher Education in Yunnan Province, Kunming University, Yun-nan 650214, China)
Mail Address
Corresponding author e-mail address Li Jing
Agricultural college, Kunming University, Kunming, Yunnan , China
Tel: +86 65098571 Email: [email protected]
Keywords
ADFP; FATP1; ApoB; Daweishan Mini chicken; Fat traits; RT-PCR.
Submitted: August/2016 Approved: August/2016
ABSTRACT
Quantitative RT-PCR was applied to measure the relative expression levels of the adipose differentiation-related protein (ADFP) gene, fatty acid transport protein 1 (FATP1) gene and apolipoprotein B (ApoB) gene in subcutaneous fat, abdominal fat, liver and muscle at five growth stages (28, 49, 70, 91 and 112 d) to determine the effect of the expression ofthese genes on fat deposition in Daweishan Mini chickens. The relative expression of ADFP gene mRNA in the abdominal fat andthe liver was significantly different between 49 d and 70 d (p<0.05). The relative ApoB gene expression on 91d was higher in the liver, followed by muscles,subcutaneous fat, and abdominal fat, and was significantly higher in the liver than in the other three tissues. FATP1 gene expression in the liver presented a significant positive correlation with subcutaneous fat thickness (p<0.05). The results of this study suggest that the three genes may control the fat development in Daweishan Mini chicken.
INTRODUCTION
Broilers are considered to have high quality when they are fleshy, and proper meat fat content can contribute for this trait. However, excessive carcass fat may affect meat flavor, and result in waste and pollution. Therefore, in poultry breeding, fat carcass content is an important indicator of chicken meat quality. Studies on the genetic mechanisms of fat synthesis and regulation may contribute for the genetic improvement and production of high-quality chickens.
Daweishan Mini chicken (Figure 1) is a rare native breed of Pingbian County, Yunnan Province, China. It is a local variety used for both meat and egg production, as well as ornamental purposes. It is called “Fragrant Chicken”, it is adaptable and resistant to diseases, and hasfleshy body, well-developed breast and legs, thin bones, and high meat yield. In addition, its meat contains low fat and cholesterol level, has meaty flavor, and it is tender, when reared under extensive management conditions.If its nutritional requirements are met, it has high growth rate and matures early.
Fat deposition involves numerous signal transduction and metabolic pathways, including many functional genes and transcriptional regulatory factors, which playimportant roles in fat synthesis, transport, storage, and decomposition. Adipose differentiation-related protein (ADFP) is a phospholipid lipid droplet protein that promotes the uptake of long-chain fatty acids, stimulates lipid accumulation and the formation of lipid droplets, maintainsthe reserves of triglycerides, and it is involved in the synthesis, transfer, and metabolism of lipids(Imamura et al., 2002; Listenberger et al., 2007). Fatty acid transport protein 1 (FATP1) is a member of the fatty acid transport protein family (FATPs). It is an integrated transmembrane protein involved in the transmembrane transport of fatty acids and in fatty acid metabolism, and the gene that expresses FATP1 is one of the key genes affecting body fat content of the body (Binnert et al., 2000). Because FATP1 can indirectly influence lipid profile and deposition by regulating fatty acid uptake and metabolism in the skeletal muscle, the determination of its expression may be important for the genetic improvement of meat traits(Poh et al., 2004). Apolipoprotein B (ApoB) is one of the proteins with highest molecular weight and one of the most hydrophobic of the apolipoprotein family. It is the ligand and the main structural protein of triglyceride-rich low-density lipoprotein (LDL) receptor, which plays an important role in the transport and metabolism of lipids and energy (Glickman et al., 1986; Schumaker et al., 1994). ApoB is closely related to the body weight, abdominal fat and other growthrelated traits.
The objectives of this study were to measure the expression levels of three candidate genes (ApoB, ADFP, FATP1) in different tissues of Daweishan Mini chickens at different developmental stages,as well as to analyze the correlation between the expression of these genes and carcass fat traits to determine their role in carcass fatdeposition. The results may aid the screening of molecular markers, and thus,molecular marker assisted breeding, contributing for the production and conservation of Daweishan Mini chickens.
MATERIALS AND METHODS
Animals and sample preparation
Daweishan Mini chickens were obtained from a Daweishan Mini chickens farm located in Pingbian County, Honghe city, Yunnan province, China, andsacrificed at five growth stages (28, 49, 70, 91 and 112d). Four individuals per stage were evaluated. Blood was collected from the jugular vein, and the following
tissues were thensampled: subcutaneous fat from the back midline and the front of the tail sebaceous glands, and abdominal fat, liver, muscle tissue from the abdominal cavity.Tissue samples were immediately placed in a centrifuge tube containinga tissue storage solution RNA Save (AB, USA). Live weight at slaughter, heavy comb and subcutaneous fat thickness (at the back midlineand anterior to the uropygeal gland) after slaughter were determined.
Primer design
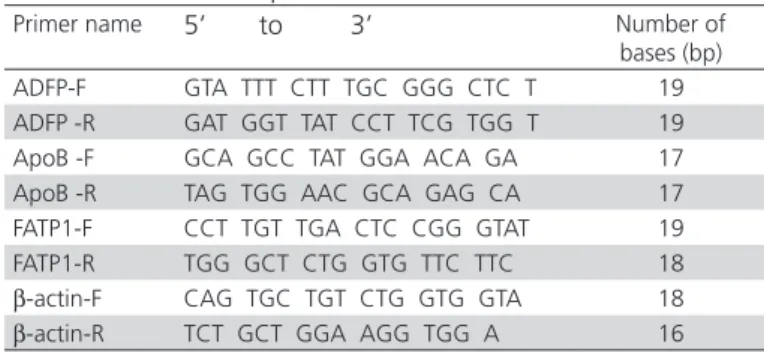
In this study, the Primer Premier 5.0 software was used to design four pairs of primers for the ADRP (NM_001031420.1), ApoB (NM_001044633.1), FATP1 (NM_001039602.2) and β-actin (NM_205518.1) gene mRNA region (Table 1).
Table 1 – Primer sequence
Primer name 5’ to 3’ Number of bases (bp) ADFP-F GTA TTT CTT TGC GGG CTC T 19 ADFP -R GAT GGT TAT CCT TCG TGG T 19
ApoB -F GCA GCC TAT GGA ACA GA 17
ApoB -R TAG TGG AAC GCA GAG CA 17
FATP1-F CCT TGT TGA CTC CGG GTAT 19 FATP1-R TGG GCT CTG GTG TTC TTC 18 β-actin-F CAG TGC TGT CTG GTG GTA 18 β-actin-R TCT GCT GGA AGG TGG A 16
Extraction and reverse transcription of genomic RNA
Total RNA of Daweishan Mini chicken was directly extracted from tissues by TRNzol-A+ Reagent (Tian’gen, Beijing, China). The Ultra Micro Nucleic Acid Protein Analyzer (AJ, Germany) was used to determine RNA concentration (400 ng/μL or so) and purity (OD260/ OD280=1.8 ~ 2.0). The reagents and conditions of FastQuant cDNA first strand synthesis kit (Tian’gen, Beijing, China) were used to synthesize cDNA by reverse transcription.
Quantitative PCR system and conditions
Statistical analysis
Excell2007 was used to count Ct(cycle threshold) values of each sample. Relative quantitative analysis was performed by 2-ΔΔCt method. SPSS.17 software
was used to accomplish the multiple comparisons among target genes relative expression (Duncan’s test), and to analyze the correlation between target genes relative expression and developmental changes of the evaluated traits (Person method).
RESULTS AND ANALYSIS
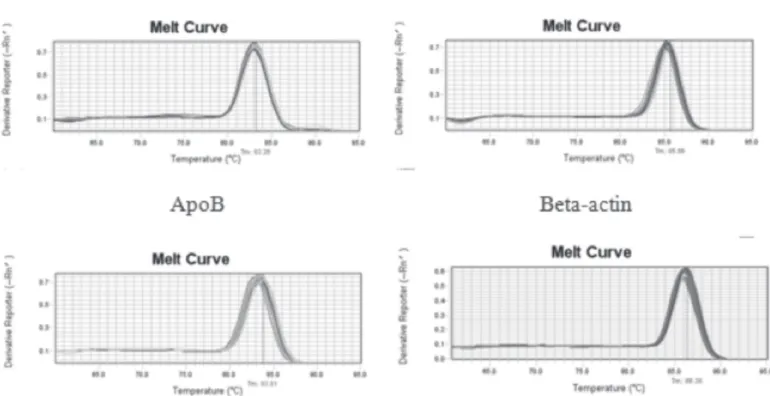
Melting curve of target gene and reference gene
Total RNA concentration of all samples was about 400ng/μL, and the OD260/OD280 was between 1.8 and 2.0. Therefore all thesamples met the experimental requirements. The melting curve (Fig 2) showed that the amplification product of all genes had the same peak, high reproducibility, and that there were no primer-dimer and non-specific peak. The results revealed that the fluorescence signal of the amplification process was the specific amplification product.
Correlation analysis between ADFP gene expression and the fat traits
The average Ct value of subcutaneous fat at 28d was used as control to compute the relative quantity
of the ADFP gene in the four evaluated tissues at five stages. The results showed that the relative expression of the ADFP gene was not significantly different among tissues at five growth stages (28, 49, 70, 91 and 112 d) (p>0.05). The relative expression of ADFP gene in subcutaneous fat and muscle was not differentamong time points (p>0.05), but was significantly different between 49 d and 70 d (p<0.05) (Table 2).
The correlation between the relative expression of ADFP gene and the fat traits was analyzed by the Pearson’s method. The results showed that relative expression levels of ADFP gene in subcutaneous fat, abdominal fat, liver, muscle were not significant correlated with fat traits (subcutaneous fat thickness, comb weight and live weight) (p>0.05) (Table 3).
Correlation analysis between FATP1 gene expression and fat traits
The average Ct value of subcutaneous fat at 28d was used as control to compute the relative quantity of the FATP1 gene in the four evaluated tissues at five stages. The results showed that the relative expression
of FATP1 gene was not significantly different among
tissues at five growth stages (28, 49, 70, 91 and 112d) (p>0.05),and was not influenced by chicken age (p>0.05) (Table 4).
The Pearson method was used to analyze the correlation between FATP1 gene expression and the
fat traits. The results showed that relative expression of
FATP1 gene in the liver was significantly and positively
correlated with subcutaneous fat thickness (p<0.05), but the relative expression of FATP1 gene in the other three tissues had no significant correlation with fat traits (p>0.05) (Table 5).
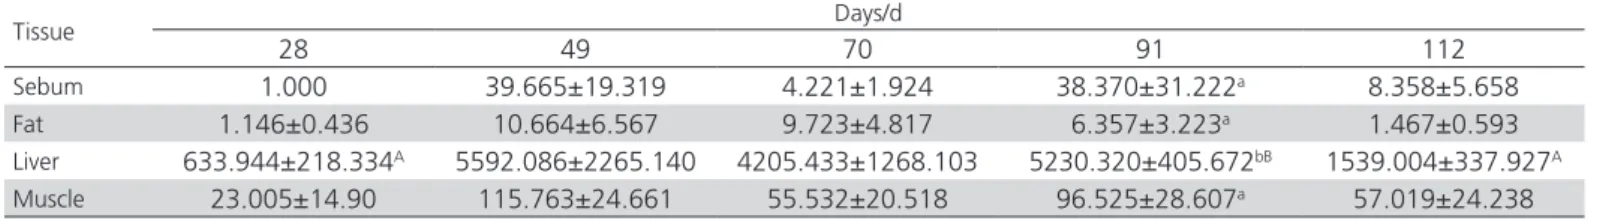
Correlation analysis between ApoB gene expression and fat traits
The average Ct value of subcutaneous fat at 28 d was used as control to compute the relative quantity of the
ApoB gene in four evaluated tissues at five stages. The relative expression of ApoB gene was not significantly
different among tissues at four growth stages (28, 49, 70 and 112d) (p>0.05). However, the relative expression of ApoB gene at 91d was significantly higher in the liver compared with the muscle, subcutaneous fat,and abdominal fat. The relative expression of ApoB gene was significantly higher on d 91 compared with 21d and 112d (p<0.05) (Table 6).
The analysis of the relative expression of ApoB gene was associated with fat traits by the Pearson method. The results showed that relative expression levels of ApoB gene in each tissue were not significantly correlated with fat traits (Table 7).
Table 2 – Relative expression of the ADFP gene in Daweishan Mini chicken
Tissue Days/d
28 49 70 91 112
Sebum 1.000 0.578±0.481 0.808±0.087 0.767±0.123 1.026±0.303
Fat 0.887±0.173 0.237±0.091A 2.491±0.462B 0.953±0.239 1.000±0.298
Liver 0.607±0.294 0.167±0.062A 2.332±0.350B 1.445±0.328 1.528±0.310
Muscle 2.579±0.447 1.306±0.650 2.550±0.612 0.950±0.136 1.973±0.266
A,B Values followed by different uppercase superscripts in the same row are significantly different (p<0.05).
Table 3 – Correlation analysis of relative expression of ADFP gene in different tissues and fat traits
Traits Sebum Fat Liver Muscle
Live weight R 0.316 0.114 0.533 -0.333
P 0.604 0.856 0.355 0.584
Sebum thickness R 0.510 0.178 0.431 0.167
P 0.380 0.774 0.469 0.788
Comb weight R 0.344 0.159 0.559 -0.246
P 0.571 0.799 0.327 0.690
Note: R = correlation coefficient, P = probability.
Table 4 – Relative expression of the FATP1 gene in Daweishan Mini chicken
Tissue Days/d
28 49 70 91 112
Sebum 1.000 0.719±0.201 1.201±0.523 1.375±0.426 0.818±0.126
Fat 0.646±0.117 0.962±0.240 0.924±0.166 0.671±0.199 0.501±0.191
Liver 1.021±0.115 1.595±0.265 1.743±0.212 1.156±0.093 2.544±0.793
Muscle 0.651±0.104 1.132±0.278 1.086±0.239 1.098±0.327 1.144±0.335
Table 5 – Correlation analysis of relative expression of FATP1 gene in different tissues and fat traits
Traits Sebum Fat Liver Muscle
Live weight R 0.193 -0.604 0.629 0.609
P 0.756 0.281 0.255 0.276
Sebum thickness R -0.329 -0.519 0.95 0.458
P 0.589 0.370 0.013 0.438
Comb weight R 0.109 -0.579 0.725 0.628
P 0.862 0.306 0.166 0.257
DISCUSSION
The relationship between ADFP gene expression and fat deposition
The ADFP gene was initially detected in fat cells. Brasaemle et al. (1997) were the first to determine the mRNA expression of ADFP in the lungs, liver, testes, spleen, brain, heart, skeletal muscle, and kidneys of rats. The main cell types in abdominal fat and subcutaneous fat are fat cells,intramuscular fat gradually deposited between muscle bundles as chicken muscle fiber matures (Desruisseaux et al., 2007). Therefore, ADFP
gene in the muscle and adipose tissues is mainly expressed in adipocytes.
The present study revealedsome differences in the
ADFP gene expression pattern among tissues. ADFP
gene expression in the abdominal fat and muscle sharply decreased on 91 d, but did notchange on 112 d and 91 d. But the gene expression in the subcutaneous fat was not significantly different between 70 d and 91 d. It appears that ADFP gene is regulated by the transcription level, because its the relative expression decreased as adipocytes gradually mature between 70d and 91 d. The maximum relative expression of ADFP
gene in theliver wasdetected on 70 d. This suggests that liver lipid synthesis was faster when birds were 10 weeks of age, and that the liver may be the main site of triglyceride synthesis in Daweishan Mini chickens.
The relationship between FATP1 gene expression and fat deposition
The fat deposition in different parts of animal body is an important factor affecting the quality of ketone
bodies (Hug et al., 2004). Fatty acids transmembrane transport is an important prerequisite for fat deposition in poultry, and FATP1 is an important carrier protein involved in fatty acid transmembrane transport (Kubota et al., 2002). At present, many experiments have confirmed that FATP1 can stimulate adipocytes to absorb fatty acids (Stahl, 2004; Doege et al., 2005; Lobo et al., 2007). Studies have shown FATP1 is highly expressed in skeletal muscle, heart, white adipose tissue (WAT) and brown adipose tissue (BAT) (Schaffer
et al., 1994; Stahl et al., 2002), but has low expression
in the brain, kidneys, lungs, liver and keratinocytes (Schmuth et al., 2005). The present study showed differences among tissues in FATP1 gene expression. The expression of this gene in subcutaneous fat did not change on 70 d and 91 d, and sharply declined on 112 d. It appears that FATP1 gene expression during adipocyte growth (70 d - 91 d) reached the highest level, increasing the rates of fatty acid transport and triglyceride synthesis in the adipose tissue, as well as the amount of fat deposition. However, the relative expression of the FATP1 gene decreased, as shown by its transcription level during the adipocyte maturation period (on 112 d). The expression of this gene in the abdominal fat and muscle did not change on 49 d and 112 d, indicating that fat deposition was relatively stable at the stage.
Subcutaneous fat thicknessindicates further fat deposition, including in chickens. The relative expression of the FATP1 gene in the liver was significantly correlated with subcutaneous fat thickness (p<0.05). This indicates that FATP1 gene expression
Table 6 – Relative expression of the ApoB gene in Daweishan Mini chicken
Tissue Days/d
28 49 70 91 112
Sebum 1.000 39.665±19.319 4.221±1.924 38.370±31.222a 8.358±5.658
Fat 1.146±0.436 10.664±6.567 9.723±4.817 6.357±3.223a 1.467±0.593
Liver 633.944±218.334A 5592.086±2265.140 4205.433±1268.103 5230.320±405.672bB 1539.004±337.927A
Muscle 23.005±14.90 115.763±24.661 55.532±20.518 96.525±28.607a 57.019±24.238
a,b Values followed by different lowercase superscripts in the same column are significantly different (p<0.05). A,B Values followed by different uppercase superscripts in the same row
are significantly different (p<0.05).
Table 7 – Correlation analysis of relative expression of ApoB gene in different tissues and fat traits
Traits Sebum Fat Liver Muscle
Live weight R 0.077 -0.276 -0.008 0.130
P 0.902 0.653 0.990 0.835
Sebum thickness R -0.356 -0.371 -0.364 -0.184
P 0.557 0.539 0.547 0.767
Comb weight R 0.000 -0.271 -0.051 0.087
P 0.999 0.660 0.936 0.889
is closely related to the development of the adipose tissue in Daweishan Mini chickens. Therefore FATP1
gene developmental expression may reflect fat content changes in the adipose tissue.
Relationship between ApoB gene expression and fat deposition
The protein ApoB is not only a key component of VLDL particles and microsomal triglyceride transfer protein (MTP) (Malaguarnera et al., 2013), but it isalso the main structural component of triglycerides (TG) secreted by liver (LDL) and present in the intestinal lumen (chylomicron) (Davidson et al., 2000; Fisher et al., 2002; Hussain et al., 2005; Shelness et al., 2005). ApoB is a glycoprotein that contains 4536 amino acid residues in chickens (Davis et al., 2001), and plays an important role in lipid metabolism. ApoB gene expression influences energy absorption and reproductive performance, which may directly or indirectly affect fat deposition and growth and development (Sen et al., 2006; Zhang et al., 2007). The present study showed that the relative expression of the ApoB gene was different among tissues and significantly higher in liver than in the other tissues at all stages. Its expression in liver was highest on 49 d, did not change between 70 d and 91 d, and sharply declinedon112 d. This indicates that ApoB lipid transport rate in the liver was faster than in the other tissues on 49 d, leading to fat accumulation in these tissues. In addition, maximum fat content affectedfat transport and metabolism on 112 d, reducing fat deposition rate. The pattern of
ApoBexpression in theother three tissues was similar to that in liver, that is, the ApoB gene expression in the four tissues as increased and reduced at the same stages. This demonstrates ApoB gene expression inthe liver can affect fat deposition in the subcutaneous fat, abdominal fat and muscle.
CONCLUSIONS
This study was the first to demonstratethe expression of the ADFP, FATP1, APOBgenes in multiple tissues and multiple rearing stages ofDaweishan Mini chickens, as well as the correlation between changes in the expression of these genes and fat traits. Based on the results obtained, we speculate that those three genes have a strong influence on the formation of fat, and may play a role inthe regulation of fat deposition.
ACKNOWLEDGEMENTS
The assistance of the staff at Daweishan Mini chicken farm of Pingbian County is highly appreciated. The
work was supported by breeding and demonstration promotion in multi-line hybrid breeding system of Yunling quality broiler. We thank STEVE WYLIE, G. E. Cun, L.M. Su and C.S. Long for their support during the course of experiment. This work was funded by grants provided by the National Natural Science Foundation of China (31200924), the Applied Basic Research programs of Yunnan Province (2010ZC162) and by the Scientific Research Foundation of Kunming University (YJL11003).
REFERENCES
Binnert C, Koistinen HA, Martin G, Andreelli F, Ebeling P, Koivisto VA, et al. Fatty acid transport protein-1mRNA expression in skeletal muscle and in adipose tissue in humans. American Journal of Physiology Endocrinology and Metabolism 2000;279:1072-1079.
Brasaemle DL, Barber T, Wolins NE, Serrero G, Blanchette-Mackie EJ, Londos C. Adipose differentiation-related protein is an ubiquitously expressed lipid storage droplet-associated protein. Journal of Lipid Research 1997;38:2249-2263.
Davidson NO, Shelness GS. Apolipoprotein B: mRNA editing, lipoprotein assembly, and presecretory degradation. Annual Review of Nutrition 2000;20:169-193.
Davis RA, Hui TY. George Lyman Duff memorial lecture—atherosclerosis is a liver disease of the heart. Arteriosclerosis Thrombosis Vascular Biology 2001;21:887-898.
Desruisseaux MS, Nagajyothi, TME, Tanowitz HB, Scherer PE. Adipocyte, adipose tissue, and infectious disease. Infection and Immunity 2007;(3):1066-1078.
Doege H, Stahl A. Protein-mediated fatty acid uptake: novel insights from in vivo models. Physiology 2005;21:259-268.
Fisher EA, Ginsberg HN. Complexity in the secretory pathway: the assembly and secretion of apolipoprotein B-containing lipoproteins. Journal of Biology Chemistry 2002;277:17377-17380.
Glickman RM , Rogers M , Glickman JN. Apolipoprotein B synthesis by human liver and intestine in vitro. Proceedings of the National Academy Sciences USA 1986;83:5296-5300.
Hussain MM, Fatma S, Pan XY, Iqbal J. Intestinal lipoprotein assembly. Current Opinion in Lipidology 2005;6:281-285.
Hug JC, Ahmad NS, Bogan JS, Tsao TS, Lodish HF. T-cadherin is a receptor for hexameric and High-molecular-weight forms of Acrp30/ adiponectin. Proceedings of the National Academy Sciences USA 2004;101(28):10308-10313.
Imamura M, Inoguchi T, Ikuyama S, Taniguchi S, Kobayashi K, Nakashima N. ADRP stimulates lipid accumulation and lipid droplet formation in murine fibroblasts. American Journal of Physiology and Endocrinology 2002;283:775-783.
Kubota N, Terauchi Y, Yamauchi T, Kubota T, Moroi M, Matsui J, et al. Disruption of adiponectin causes insulin resistance and neointimal formation. Journal of Biological Chemistry 2002;277(29):25863-25866.
Lobo S, Wiczer B M, Smith AJ, Hall AM, Bernlohr DA. Fatty acid metabolism in adipocytes: functional analysis of fatty acid transport proteins 1 and 4. Journal of Lipid Research 2007;48:609-620.
Malaguarnera M, Vacante M, Russo C, Mala-guarnera G, Antic T, Malaguarnera L, et al. Lipoprotein(a) in cardiovascular diseases. BioMed Research International 2013;2013: 650989.
Poh J, Ring A, Hermann T, Stremmel W. Role of FATP in parenchymal cell fatty acid uptake. Biochimica et Biophysica Acta 2004;1686:1-6.
Schaffer JE, Lodish HF. Expression cloning and characterization of a novel adipocyte long chain fatty acid transport protein. Cell 1994;79(3):427– 436.
Schumaker VN, Phillips ML , Chatterton JE. Apolipoprotein B and low density lipoprotein structure: implications for biosynthesis of trigly ceride rich lipoproteins. Advances in Protein Chemistry 1994;45:205-248.
Schmuth M, Ortegon AM, Mao-Qiang M, Elias PM, Feingold KR, Stahl A. Differential expression of fatty acid transport proteins in epidermis and skin appendages. Journal of Investigative Dermatology 2005;125(6):1174-1181.
Sen Zhang, Hui Li. Advances in the research of apolipoprotein B. International Journal of Genetics 2006;29(5):364-367.
Shelness GS, Ledford AS. Evolution and mechanism of apolipoprotein B-containing lipoprotein assembly. Current Opinion Lipidology 2005;16:325-332.
Stahl A. A current review of fatty acid transport proteins (SLC27). Pflügers Archiv: European journal of Physiology 2004;447:722-727.
Stahl A, Evans JG, Pattel S, Hirsch D, Lodish HF. Insulin causes fatty acid transport protein translocation and enhanced fatty acid uptake in adipocytes. Developmental Cell 2002;2(4):477–488.