Article
J. Braz. Chem. Soc., Vol. 22, No. 7, 1263-1270, 2011. Printed in Brazil - ©2011 Sociedade Brasileira de Química
0103 - 5053 $6.00+0.00
A
*e-mail: [email protected]
Optimization of a New Dissolution Test for Oxcarbazepine Capsules
using Mixed-Level Factorial Design
Hudson C. Polonini,a Marcone A. L. de Oliveira,b Anderson O. Ferreira,c
Nádia R. B. Raposo,a Lívia N. Grossic and Marcos A. F. Brandão*,a
aFaculty of Pharmacy and bDepartament of Chemistry, Federal University of Juiz de Fora,
36036-900 Juiz de Fora-MG, Brazil
cOrtofarma – Controle de Qualidade, 36120-000 Matias Barbosa-MG, Brazil
Neste trabalho foi desenvolvido e validado um teste de dissolução para cápsulas de oxcarbazepina. Para o estudo de triagem, foi utilizado um planejamento experimental de níveis mistos composto de fatores com dois e três níveis (32 × 2), de modo a selecionar a velocidade de agitação, o meio de dissolução e o aparato. Esta estratégia é útil, pois reduz o tempo de desenvolvimento do método e também gera resultados mais exatos. A melhor porcentagem de dissolução foi obtida utilizando o aparato pá a 80 rpm e com solução aquosa de laurilsulfato de sódio a 1% m/v como meio de dissolução. A quantiicação da massa dissolvida foi realizada por análise espectrofotométrica UV-Vis a 304 nm. Os resultados do estudo da validação demonstraram que o método é preciso e linear no intervalo de 83-249 μg mL-1 de oxcarbazepina. Os resultados evidenciaram que o método apresenta utilidade e adequabilidade para o estudo da dissolução de cápsulas de oxcarbazepina, uma vez que não existe método oicial com este propósito.
In this work, a dissolution test for oxcarbazepine capsules was developed and validated. For the screening study, a mixed-level factorial design containing factors at three and two levels (32 × 2) was used in order to select the stirring speed, the dissolution medium and the dissolution apparatus. This strategy is needful for reducing the time of method development and to provide less ambiguous data. The best in vitro percentage dissolution was obtained using apparatus paddle at 80 rpm and sodium lauryl sulfate 1% m/v aqueous solution as the dissolution medium. The quantiication of the mass dissolved was obtained by UV-Vis spectrophotometric analysis at 304 nm. The validation results demonstrate that the method was precise and linear over the range of 83-249 μg mL-1 of oxcarbazepine. Thus, the method is useful and adequate for oxcarbazepine capsules dissolution test, once there is no oficial monograph regarding it.
Keywords: oxcarbazepine, dissolution test, mixed-level factorial design
Introduction
Oxcarbazepine (OCBZ) (Figure 1) is a keto analog of carbamazepine1 indicated as monotherapy or adjunctive therapy for the treatment of partial seizures with or without secondarily generalized tonic-clonic seizures in adults and children aged over six years.2,3 The advantages of OCBZ on carbamazepine are: lower frequency and severity of adverse events (particularly endocrine),4-6 better tolerability,3,6 fewer drug interactions7 and almost complete absorption after oral ingestion.3
Another point is that OCBZ is a low therapeutic index, high dosage and low potency drug. Its compounding and marketing, therefore, can only be made if the performance of the formulation is proved by conducting the dissolution test of the inal product.8
Dissolution tests have become a highly valuable tool for quality analysis in the pharmaceutical industry in what concerns the performance of the oral solid dosage form/delivery system,9,10 because its results can be directly correlated to and relect the bioavailability and bioequivalence of an active substance.11 A regulatory approval is a requirement for the product to be marketed, and so the performance of oral solid dosage forms such as soft-gel capsules must be veriied through an in vitro dissolution test.12,13
This in vitro dissolution test is so relevant for the pharmaceutical industries because it can predict the in vivo performance of a drug product, once the absorption of an oral drug is mainly dependent on the release of the active substance from its dosage form and also its dissolution and/or solubilization under physiological conditions.11 The capability of releasing the drug substance in aqueous media, making it available for gastrointestinal absorption, is indispensable for quality of the oral dosage forms.10 Other important applications of the dissolution tests include the assessing of the batch-to-batch quality, the guidance for the development of new formulations and the assurance that changes in the original formulation do not affect the inal product.11
After the dissolution testing, the amount of the substance dissolved should be determined by an adequate analytical procedure. This method has to be suficiently sensitive, selective in presence of excipients, robust and rapid because the dissolution experiments generate a large number of samples.13
Many of the oficial pharmaceutical compendiums such as American,10 European,14 British,15 Japanese,16 Brazilian17 pharmacopoeias have general chapters for dissolution harmonized among them, including its standards and policies. However, dissolution test of OCBZ capsule is not included in any of these pharmacopoeias, thus there is no oficial method description for this purpose. Within this context, a dissolution test using a simple UV-Vis spectrophotometric method to evaluate the dissolution performance of soft-gel capsules containing oxcarbazepine was developed, optimized and validated.
Experimental
Reagents and materials
The following analytical-grade reagents were used: sodium lauryl sulfate (SLS), hydrocholoric acid, tribasic sodium phosfate (all from Vetec, Rio de Janeiro, Brazil) and ethanol (Neon, São Paulo, Brazil). Oxcarbazepine (99.1% purity) (Henrifarma, São Paulo, Brazil) was
used as the reference material and as the raw material for the compounding of the capsules. Ultra-pure water (aquaMAX - Ultra 370 Series, Young Lin, Korea) was used for the dissolution medium and throughout analysis. The OCBZ capsules with 150 mg were compounded using: soft-gel white/white n. 1 capsules (Catalent, Moorestown, NJ, USA) and the following preparation of excipients: pharmaceutical talc (Pharmanostra, Rio de Janeiro, RJ, Brazil), 3%; colloidal silica (Deg, São Paulo, SP, Brazil), 1%; SLS (Mapric, São Paulo, SP, Brazil), 1.5%; corn starch (All Chemistry, São Paulo, SP, Brazil), q.s.p. (quantity suficient for preparation) 100%.
Equipment
OCBZ quantiication was performed on a dual beam UV-Visible spectrophotometer system from Cary 50 Probe (Varian, Palo Alto, CA, USA) with 190-1100 nm absorption spectrum, 1.5 nm ixed spectral bandwidth, iber optic reading probe and quartz regular cells of optical path equal to 1.0 cm. Dissolution tests were conducted in a dissolutor Mod 299 (Nova Ética, São Paulo, SP, Brazil). The equipment consists of (i) six cylindrical glass vessels with hemispherical bottoms, nominal capacity of 1 L, its sides are langed at the top, and a itted cover so that the evaporation of the dissolution media is retarded, (ii) a water bath that keeps the temperature inside the vessel at 37 ± 0.5 ºC during the test and (iii) a stainless steel
drive shaft to which the dissolution apparatus can be attached and “positioned so that its axis is not more than 2 mm at any point from the vertical axis of the vessel and rotates smoothly and without signiicant wobble that could affect the results”,10(iv) a motor to rotate the shaft, and (v) a speed-regulating device to select and maintain, within 4% of variation, the shaft rotation speed. The dissolution apparatus used were: (i) six stainless steel baskets with external diameter of 22.2 ± 1.0 mm,
external height of 36.8 ± 3.0 mm and mesh 40 screen
with welded seam and (ii) six stainless steel paddles with height of 19.0 ± 0.5 mm, width of 74.5 ± 0.5 mm, and
thickness of 4.0 ± 1.0 mm. The distance between the inside
bottom of the vessel and the bottom of the apparatuses was maintained at 25 ± 2 mm. Illustrations of the design
of the equipment can be found in the previously cited pharmacopoeias.10,14-17
Solutions
All dissolution media used (hydrochloric acid 0.1 mol L-1, pH 6.8 phosphate buffer and SLS 1% m/m aqueous solution) were degassed in ultrasonic bath for 30 min prior to use.
A pH 6.8 buffer potassium phosphate was prepared by adding 76 g of tribasic sodium phosphate in water to obtain 1000 mL of solution. An aliquot of 250 mL of this solution was mixed with 750 mL of hydrochloric acid 0.1 mol L-1. The pH value was checked with the pHmeter and if needed adjusted with hydrochloric acid 2 mol L-1 or sodium hydroxide 2 mol L-1, if necessary.
The standard solutions of OCBZ were prepared in a 1000 mL volumetric lask by dissolving an accurately weighed amount (0.166 g) of OCBZ standard in 10 mL of ethanol and diluting to volume with 1% m/v SLS aqueous solution, hydrochloric acid or sodium phosphate buffer, depending on the dissolution medium used. It was used ultrasonic bath for solubilization of the OCBZ reference substance in the dissolution media. This solution was iltered through a 0.45 μm porosity regenerated cellulose membrane (Macherey-Nagel, Duren, Germany) and used for the spectrophotometric analysis (inal concentration ca. 166 μg mL-1).
Sample solutions were prepared in six replicates by putting one capsule in each vessel containing the dissolution medium (900 mL) at the temperature of 37 ± 0.5 °C
and using the adequate apparatus (inal concentration ca. 166 μg mL-1). A sample aliquot of 10 mL was withdrawn from each vessel at the end of 60 min and iltered in a quantitative ilter paper (Vetec, Rio de Janeiro, RJ, Brazil). This solution was assayed by spectrophotometry at 304 nm, using the respective dissolution medium as blank. Masses of drug dissolved from the capsules were calculated by comparison with the standard solution measured by spectrophotometric analysis.18
Factorial design with mixed levels
In order to establish a method of analyzing dissolution of OCBZ, the following parameters were evaluated accordingly to criteria of The United States Pharmacopoeia (USP),10 The U. S. Food and Drug Administration (FDA),11 The International Conference on Harmonization (ICH)19 and the Brazilian Legislation:20(i) dissolution medium at pH 6.8 phosphate buffer, HCl 0.1 mol L-1 and 1% m/v SLS aqueous solution, (ii) 1 (basket) and 2 (paddle) concerning apparatus and (iii) stirring speed of 50, 75 and 100 rpm.
To evaluate the signiicance that each parameter/factor has on the dissolution of OCBZ and to determine the
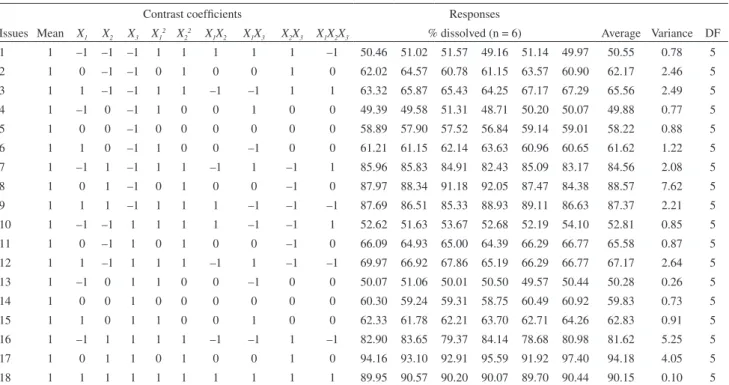
optimal conditions for inclusion of the method in routine laboratorial tests, a 32 × 2 factorial design with mixed levels containing factors at three (–1, 0, +1 for the factors stirring speed and dissolution medium) and two (–1 and +1 for the factor dissolution apparatus) levels was randomly conducted in a total of 18 experiments with six replicates in each experimental level.21 The factors, levels and matrix of contrast coeficients are listed in Table 1.
Each experiment was conducted by adding one OCBZ capsule in a dissolution vessel (n = 6) containing 900 mL of dissolution medium stabilized at 37 ± 0.5 ºC (variables
kept constant). After 60 min of testing (usual time for immediate release solid pharmaceutical forms),21 aliquots of 10 mL were collected, iltered and measured directly in spectrophotometer at 304 nm using the dissolution medium as blank.
After the experiments, statistical analysis was conducted.22,23 From the results of each experiment, the coeficients for determining the statistical model prediction were calculated accordingly to equation 1:
b = (Xt X)–1Xt y
b (1)
where vector b represents model parameter estimators, X and y are matrix and vector respectively, according to Table 1. To achieve the equation of the itted model, it was calculated the standard errors of the coeficients using equation 2:
e(b) = √(Xt X)–1 s2 (2)
where ε(b) is the matrix of standard errors of the elements
of vector b and s2 is the populational variance of the experiments, which can be estimated as s2 using equation 3:
(3)
where ν
i and si
2 are the number of degree of freedom and
the variance within each experimental level, respectively.
Method validation
Network. The second part regards the test validation itself. In this case, the dissolution test is categorized by USP10 and Brazilian legislation25 as “category III - performance test”, being the parameter precision required. It were also evaluated the parameters linearity and limits of detection and quantiication.26
Linearity
The test was performed from three analytical curves, plotted from the concentrations of 50-150% of the OCBZ work concentration (real concentrations: 83, 124, 166, 208 and 249 μg mL-1), to assess a linear relationship between analyte concentration and absorbance. For this purpose, data from each concentration level were statistically evaluated using analysis of variance (ANOVA) and the value of the correlation coeficient of the analytical curve.
Limits of Detection and Quantiication
The limit of detection (LOD) and limit of quantiication (LOQ) of the proposed method were determined from three standard analytical curves and they were calculated using equations 4 and 5:
(4)
(5)
where S is the standard deviation of the intercept with the y axis of the three analytical curves and a is their slope.
Precision
The precision was assessed by the coeficient of variation, determined for the repeatability and the intermediate precision. The repeatability (intra-assay precision) was assessed by analyzing seven replicates at the concentration of 166.6 μg mL-1 of OCBZ (100%). The intermediate precision consisted of the same test, but performed for two consecutive days with two different analysts. A coeficient of variation < 5% was considered appropriate.25
Software
All statistical analysis was performed in Microsoft Ofice® Excel 2007 software, which is easy to use and therefore can be widely applied in teaching the topics elaborated upon here.
Results and Discussion
Factorial design is a very useful tool to obtain deeper information about the relationships among the studied variables and to establish the optimum experimental conditions. Its application to dissolution studies is needful for reducing the time of method development and to provide
Table 1. Factors, levels, matrix of contrast coeficients and responses for 32 × 2 mixed experimental design for dissolution of OCBZ capsules
Contrast coeficients Responses
Issues Mean X1 X2 X3 X1
2 X
2
2 X
1X2 X1X3 X2X3 X1X2X3 % dissolved (n = 6) Average Variance DF
1 1 –1 –1 –1 1 1 1 1 1 –1 50.46 51.02 51.57 49.16 51.14 49.97 50.55 0.78 5
2 1 0 –1 –1 0 1 0 0 1 0 62.02 64.57 60.78 61.15 63.57 60.90 62.17 2.46 5
3 1 1 –1 –1 1 1 –1 –1 1 1 63.32 65.87 65.43 64.25 67.17 67.29 65.56 2.49 5
4 1 –1 0 –1 1 0 0 1 0 0 49.39 49.58 51.31 48.71 50.20 50.07 49.88 0.77 5
5 1 0 0 –1 0 0 0 0 0 0 58.89 57.90 57.52 56.84 59.14 59.01 58.22 0.88 5
6 1 1 0 –1 1 0 0 –1 0 0 61.21 61.15 62.14 63.63 60.96 60.65 61.62 1.22 5
7 1 –1 1 –1 1 1 –1 1 –1 1 85.96 85.83 84.91 82.43 85.09 83.17 84.56 2.08 5
8 1 0 1 –1 0 1 0 0 –1 0 87.97 88.34 91.18 92.05 87.47 84.38 88.57 7.62 5
9 1 1 1 –1 1 1 1 –1 –1 –1 87.69 86.51 85.33 88.93 89.11 86.63 87.37 2.21 5
10 1 –1 –1 1 1 1 1 –1 –1 1 52.62 51.63 53.67 52.68 52.19 54.10 52.81 0.85 5
11 1 0 –1 1 0 1 0 0 –1 0 66.09 64.93 65.00 64.39 66.29 66.77 65.58 0.87 5
12 1 1 –1 1 1 1 –1 1 –1 –1 69.97 66.92 67.86 65.19 66.29 66.77 67.17 2.64 5
13 1 –1 0 1 1 0 0 –1 0 0 50.07 51.06 50.01 50.50 49.57 50.44 50.28 0.26 5
14 1 0 0 1 0 0 0 0 0 0 60.30 59.24 59.31 58.75 60.49 60.92 59.83 0.73 5
15 1 1 0 1 1 0 0 1 0 0 62.33 61.78 62.21 63.70 62.71 64.26 62.83 0.91 5
16 1 –1 1 1 1 1 –1 –1 1 –1 82.90 83.65 79.37 84.14 78.68 80.98 81.62 5.25 5
17 1 0 1 1 0 1 0 0 1 0 94.16 93.10 92.91 95.59 91.92 97.40 94.18 4.05 5
18 1 1 1 1 1 1 1 1 1 1 89.95 90.57 90.20 90.07 89.70 90.44 90.15 0.10 5
less ambiguous data.27 The application of experimental design for optimizing the dissolution test is a valuable tool for reducing the amount of work needed for formulation and test development. In fact, the factorial design makes possible the reduction of the number of single experiments and the improvement of the method reliability.28
In the present study, each experiment was conducted in a number of 6 replicates because of the design of the equipment, which contains 6 dissolutions vessels and because the pharmacopoeic acceptance criterion states that is needed to have 6 units being tested in order to achieve an adequate overview of the dosage form dissolution quality. The pharmacopeias have harmonized general chapters for dissolution test, and they recommend that the irst 6 units must give results fallen within the speciication “Q + 5%”, being Q the amount of dissolved active ingredient speciied in the individual monograph, expressed as a percentage of the labeled content of the dosage unit. This value is generally 75-80%.29 However, it is acceptable that the dosage form does not meet this irst requirement. In this case, another test must be conducted therefore with additional 6 units (criterion: the average of the 12 units, the irst 6 and the additional ones, must be equal to or greater than Q, and no unit is less than “Q – 15%”). Once the results do not show adequate values, the test is repeated with more 12 capsules (speciication: the average of the all 24 units must be equal to or greater than Q, not more than 2 units are less than “Q – 15%” and no unit is less than “Q – 25%”).10,14,16,17
When there is no official monograph for a given medicine, the method has to be developed and validated, and the referred Q value can be selected by the authors, provided it has a plausible justiication. In this case, it was chosen to work with Q = 80%, because of its widespread use by the pharmacists. The other test parameters had also to be selected. According to the Brazilian legislation,20 one has to investigate three different dissolution media (all within the physiological pH 1.2-6.8). Oxcarbazepine is well-characterized as a water-insoluble drug,10 thus it is required to use dissolution media dissimilar from the normally employed in this type of test. In this sense, the utilization of surfactants such as the SLS is largely widespread, once it mimics, up to some extent, the human body physiologically conditions, such as the presence of natural surfactants (bile salts and lecithin, for instance) in the gastrointestinal tract. Surfactants as the SLS are wetting, micellar solubilizing agents, so they have the capacity of enhancing the solubility of such drugs. This probably happens via the reduction of the interfacial tension and/or their association with the excipients and the active ingredient itself. Nevertheless, it is recommended that these substances are used only in small concentrations, so that the in vitro/in vivo results are better
correlated,29 so that is why it was chosen to work with the concentration of 1% m/v. The other media was chosen to verify whether the substance is better solubilized in acidic or neutral pH.
In addition to the dissolution medium, it were also measured the inluence of two stirring apparatus (basket and paddle, the most commonly used) and three different stirring speeds (50, 75 and 100 rpm, also the most commonly used in the in the pharmaceutical ield). The dissolution experiment was therefore conducted using a 32 × 2 mixed-level factorial design, in a total of 18 experiments, whose parameters are described in Table 1, as well as the contrast coeficients for the interaction effects of the factors and the results of each experiment.
In Table 1, can be seen that keeping X3 (apparatus) ixed at level –1, it appears that the increased level of X1 (stirring speed), when X2 (dissolution medium) is kept constant, leads to higher response, except when X2 is at level +1. In this case, the highest response occurs when X1 is at level 0.
The same analysis is true when one considers the level X3
ixed at +1, which suggests that the answer related to X1 is
likely to forecast, with the two other factors held constant. Similarly, when X3remains ixed at level –1, the response
as a function of X2, with X1 ixed, also follows predictable
behavior, but differently from what happens in the previous situation. With X2, the lower response is observed at level 0
and the highest at level +1. When X1 and X2 are set constant
to investigate the effect of X3 on the response, it is observed
that changing the level –1 to +1 always leads to an increased response. Thus, from this initial screening, it appears that higher responses are observed when the agitation speed is at levels +1 (100 rpm, when X2 is at –1 and 0) and
0 (75 rpm, when X2 is +1), the dissolution medium at
level +1 (1% m/v SLS) and the apparatus at level +1 (paddle). However, it was performed a study involving factorial surface response for the experiments in order to achieve and verify the optimal conditions for the dissolution test.
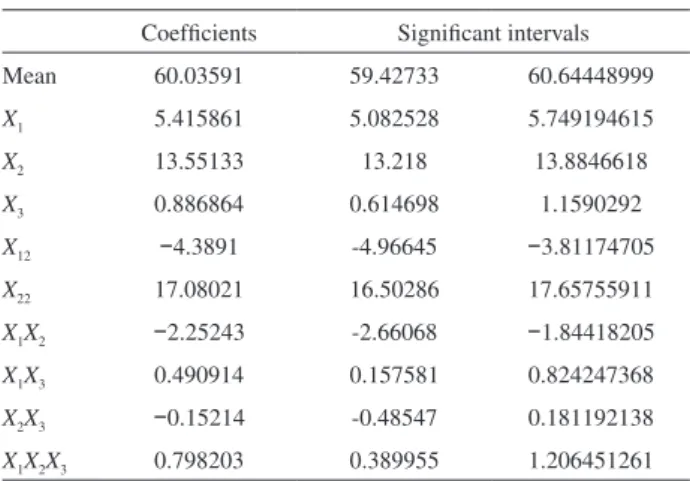
Calculating the coefficients of the statistical model using the equations 1, 2 and 3 (Tables S1 and S2), it was obtained y^= 60.03 (± 0.30) + 5.41 x1 (± 0.17) + 13.55 x2
(± 0.17) + 0.88 x
3 (± 0.14) – 4.38 x1
2 (± 0.29) + 17.08 x 2
2
(± 0.29) – 2.25 x
1x2 (± 0.20) + 0.49 x1x3 (± 0.17) – 0.15 x2x3
(± 0.17) + 0.79 x
1x2x3 (± 0.20). The signiicance evaluation
for each error using t value (ca. 2.0) with 90 degrees of freedom was performed and only coefficient x2x3 was
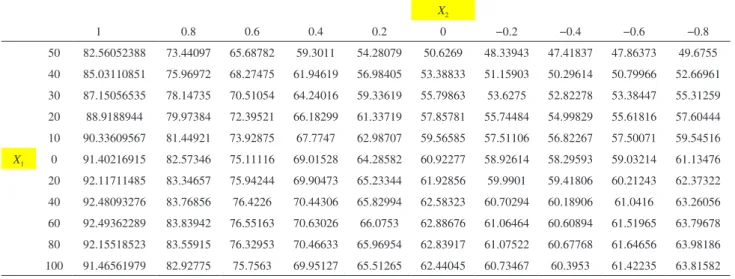
The regression significance test returned the value of Fcalculated (MSmodel / MSresidual) = 825.68, higher than Fcritical0.05,ν1=9,ν2=98 ca. 2.00, which indicates a significant regression within 95% confidence interval. On the other hand, the lack of fit test returned Fcalculated (MSlack of fit / MSpure error) = 7.76, higher than Fcritical0.05,v1=8,v2=90ca. 2.06, which indicates lack of it within 95% conidence interval. However, taking into account that the lack of it presented by the model is relatively small and probably represents a minor region in the surface; that the percentage of variation explained by regression and maximum percentage of variation explained are close; and the model residue presented normal behavior through Kolmogorov normality test for 95% conidence (p-value > 0.05) The response surface was built from the experiments (Figure 2 and S1) and indicated as higher response the region (% dissolution) between 40-80 rpm (Table S3), using 1% m/v SLS. This response surface was achieved ixing variable apparatus in “paddle” (level +1). This was made because both apparatuses lead to similar results in the dissolution experiments, thus the decision was made taking into account that the paddle has a more widespread utilization
than the basket. With respect to the stirring speed, once 40, 60 and 80 rpm led to very similar theoretical dissolution result, it was chosen to work with 80 rpm.
The optimal conditions (stirring speed set at 80 rpm) would theoretically lead to a percentage of dissolution of about 92.15%. Since these conditions provided by the response surface methodology had not been tested previously, the experiment was run again using the provided levels by the methodology, with six replicates. The average percentage dissolved for these conditions was 95.45%, higher than that found in the initial screening experiments and even higher than the predicted value obtained with the response surface methodology (in the whole optimized region for stirring speed, i.e. 40-80 rpm). Though it has presented a lower value compared to the real one, the model was able to predict which one were the best levels for each parameter of the test. So, it can be inferred that this methodology is highly relevant to the objectives proposed here. Therefore, the established conditions to validate the dissolution test were: X1 = 80 rpm, X2 = SLS 1% m/v aqueous solution
and X3 = paddle.
Method validation
The linearity of the method used was evaluated on a calibration curve of the absorbance vs. the analyte concentration (μg mL-1). The calibration curves, performed in genuine triplicate, returned the model y (± 0.0035) = 0.0096 (± 0.000015) x + 0.0029 (± 0.0027),
with r2 = 0.99996. To validate this model, it was performed the analysis of variance described in Table 3. The test of signiicance of regression returned the value of Fcalculated (MSmodel / MSresidual) = 391107.8, greater than Fcritical0.01,ν1=1,ν2=13 = 4.67, which conirms the existence of a signiicant linear relationship between the two variables, with 95% conidence. The test of lack of it value returned Fcalculated (MSlack of fit / MSpure error) = 5.06, smaller than
Table 2. Analysis of variance for itting the model of prediction for the
screening study
Source square (SS)Sum of degrees of freedomNumber of square (MS)Mean of
Model 23175.86 9 2675.09
Residual 305.64 98 3.12
Lack of it 124.77 8 15.57
Pure error 180.87 90 2.01
Total 23481.50 107
% variation explained = 98.70; % maximum of variation explained = 99.23.
Table 3. Analysis of variance for itting the model of prediction for the
validation study
Source Sum of square (SS)
Number of degrees of freedom
Mean of square (MS)
Model 4.80 1 4.80
Residual 1.59 × 10⁻⁴ 13 1.22 × 10⁻⁵
Lack of it 9.63 × 10⁻⁵ 3 3.20 × 10⁻⁵
Pure error 6.33 × 10⁻⁵ 10 6.33 × 10⁻⁶
Total 4.80 14
% variation explained by regression = 99.99; % maximum of variation explained = 99.99.
Figure 2. Response surface for the 32 × 2 mixed factorial design.
Fcritical 0.01,ν1=3,ν2=10 = 6.55, which indicates no lack of it, with 99% conidence.
The lowest concentration of an analyte in a sample that it is possible to detect, but not to quantify is considered the LOD. The LOQ has the same deinition, but determines the lowest concentration of an analyte in a sample that can be determined/quantiied with acceptable precision and accuracy.30,31 By calculations using equations 4 and 5, the LOD was determined as 0.84 μg mL-1 and the LOQ as 2.81 μg mL-1, which demonstrates the method is sensitive enough to the proposed objective. The calculation of the LOQ and LOD is useful, in the dissolution case, because some capsules do not dissolve adequate amounts of the active ingredient due to problems in the formulation, caused mainly by the choice of the excipients. Thus the method has to be sensitive enough to be applied to a wide range of possibilities found in the pharmaceutical industries.
The precision of the method (repeatability and intermediate precision) is a measure of the degree of repeatability of an analytical method under normal operation. Its evaluation is very important in order to assess the reliability of the dissolution test data.25 In the case of dissolution test (as previously informed, a “category III - performance test”), it is needed to verify the repeatability through a minimum of 6 determinations/experiments with the work concentration of the substance (100%, i.e. 166 μg mL-1). A coeficient of variation (CV) of less than 5% is considered appropriate.30,31 It was achieved repeatability values of 3.0% (n = 7).
For the intermediate precision, it is recommended to perform the test in two different days with two different analysts, aiming to assess the inherent variability of the method. For this test, it is also considered as satisfactory a CV value lower than 5%. The intermediate precision coeficient of variation achieved was 4.2% (n = 14).
Other parameters such as accuracy and speciicity were not performed because the legislation25 does not consider them as mandatory for dissolution tests. Since the emphasis of this study was not the validation, but the application of the mixed-level factorial design in dissolution tests development, the authors chose not to include these two igures of merit.
To sum up, this work opens a new perspective in the dissolution test development methodology, since it is the irst time that the mixed-level factorial design was used for this purpose. As it was successfully applied for the OCBZ capsules case, it can be inferred that it can be also applied for virtually any drug that needs a dissolution study. Using the fundamentals here presented, one can develop it for a variety of pharmaceutical dosage forms, composed by several different active ingredients.
Conclusions
On balance, this work provided a simple and validated procedure for dissolution test of oxcarbazepine capsules by UV-Vis spectrophotometric analysis. The 32 × 2 mixed factorial design carried out an optimized dissolution test for: apparatus 2 (paddle) at 80 rpm and sodium lauryl sulfate 1% m/v aqueous solution, as the dissolution medium. Data analysis demonstrates the method was validated with respect to linearity, precision and limits of detection and quantiication. The method is useful and adequate for oxcarbazepine capsules dissolution test, once there is no oficial monograph regarding it. Moreover, the mixed-level factorial design presented can be applied for the dissolution method development of virtually any drug substance candidate, or even the already marketed ones.
Supplementary Information
Supplementary information is available free of charge at http://jbcs.org.br as a PDF ile.
Acknowledgement
The authors would like to thank Conselho Nacional de Desenvolvimento Científico e Tecnológico (CNPq - 300593/2008-2), Fundação de Amparo à Pesquisa do Estado de Minas Gerais (FAPEMIG, CEX PPM 00326/09), Singularis Farmácia de Manipulação and Michele Campos, for her invaluable help.
References
1. Buggy, Y.; Layton, D.; Fogg, C.; Shakir, S. A. W.; Epilepsia
2010, 51, 818.
2. Novartis Pharmaceuticals; Trileptal (R), Summary of Product Characteristics, 2009.
3. Shorvon, S.; Seizure2000, 9, 75. 4. Tecoma, E. S.; Epilepsia1999, 40, S37.
5. Bill, P. A.; Vigonius, U.; Pohlmann, A.; Guerreiro, C. A.; Kochen, S.; Saffer, D.; Moore, A.; Epilepsy Res. 1997, 27, 195.
6. Dam, M.; Ekberg, R.; Løyning, Y.; Waltimo, O.; Jakobsen, K.;
Epilepsy Res. 1989, 3, 70.
7. Schmidt, D.; Elger, C. E.; Epilepsy Behav. 2004, 5, 627. 8. Agência Nacional de Vigilância Sanitária (ANVISA); Critérios
adicionais de Boas Práticas de Manipulação de Medicamentos em Farmácias, Resolução RDC n. 354, Brasil, 2003.
9. Cohen, J. L.; Hubert, B. B.; Leeson, L. J.; Rhodes, C. T.; Robinson, J. R.; Roseman, T. J.; Shefter, E.; Pharm. Res.1990,
10. The United States Pharmacopeial Convention, The United States Pharmacopeia, USP 33, Rockville, 2010.
11. The United States Food and Drug Administration (US-FDA), Guidance for Industry: Dissolution Testing of Immediate Release Solid Oral Dosage Forms, Food and Drug Administration, Rockville, 1997.
12. Frost, S. M. A.; Dissolution Technol.2004, 11, 19.
13. Davydova, N.; Stippler, E.; Jin, P.; Giancaspro, G.; J. Pharm. Biomed. 2010, 53, 295.
14. European Pharmacopoeia, 6th ed., Council of Europe: Strasbourg, 2008.
15. British Pharmacopoeia, Her Majesty’s Stationery Office:
London, 2010.
16. The Pharmaceutical Society of Japan, Japanese Pharmacopeia,
15th ed., Tokyo, 2006.
17. Farmacopéia Brasileira, 4a. ed., Atheneu Editora: São Paulo,
Brasil, 2005.
18. Corrigan, O. I.; Stanley, T.; J. Pharm. Pharmacol.1982, 34,
621.
19. ICH, International Conference on Harmonization of Technical Requirements for Registration of Pharmaceuticals for Human Use, Q2B(R1), Guideline on Validation of Analytical Procedure: Text and Methodology, Geneve, 2005.
20. Agência Nacional de Vigilância Sanitária (ANVISA); Estudos de Equivalência Farmacêutica e de Perfil de Dissolução Comparativo, Resolução RDC n. 31, Brasil, 2010.
21. Agência Nacional de Vigilância Sanitária (ANVISA); Guia para Ensaios de Dissolução para Formas Farmacêuticas Sólidas Orais de Liberação Imediata (FFSOLI), Resolução RDC n. 483, Brasil, 2010
22. Montgomery, D. C.; Design and Analysis of Experiments, 6th ed., Wiley: New York, 2004.
23. Barros Neto, B.; Scarminio, I. S.; Bruns, R. E.; Como fazer Experimentos: Pesquisa e Desenvolvimento na Ciência e na Indústria, 4a. ed., Bookman: Porto Alegre, Brasil, 2010. 24. Frick, A.; Moller, H.; Wirbitzki, E.; Eur. J. Pharm. Biopharm.
1998, 46, 305.
25. Agência Nacional de Vigilância Sanitária (ANVISA); Validação de Métodos Bioanalíticos, Resolução RE n. 899, Brasil, 2003. 26. Ansari, M.; Kazemipour, M.; Talebnia, J.; Dissolution Technol.
2004, 11, 16.
27. Mohd, A. A.; Dean, J. R.; Tomlinson, W. R.; Analyst1992, 117,
1743.
28. Furlanetto, S.; Maestrelli, F.; Orlandini, S.; Pinzauti, S.; Mura, P.; J. Pharm. Biomed. Anal.2003, 24, 159.
29. Shah, V. P.; Konecny, J. J.; Everett, R. L.; McCullough, B.; Noorizadeh, A. C.; Skelly, J. P.; Pharm. Res.1989, 6, 612. 30. Shabir, G. A.; J. Chromatogr. A2003, 987, 57.
31. Instituto Nacional de Metrologia (INMETRO); Normalização e Qualidade Industrial, Orientações sobre Validação de Métodos de Ensaios Químicos, Documento DOQ-CGCRE-008, Brasil, 2003.
Supplementary Information
S
I
J. Braz. Chem. Soc., Vol. 22, No. 7, S1-S2, 2011. Printed in Brazil - ©2011 Sociedade Brasileira de Química 0103 - 5053 $6.00+0.00
*e-mail: [email protected]
Optimization of a New Dissolution Test for Oxcarbazepine Capsules
using Mixed-Level Factorial Design
Hudson C. Polonini,a Marcone A. L. de Oliveira,b Anderson O. Ferreira,c
Nádia R. B. Raposo,a Lívia N. Grossic and Marcos A. F. Brandão*,a
aFaculty of Pharmacy and bDepartament of Chemistry, Federal University of Juiz de Fora,
36036-900 Juiz de Fora-MG, Brazil
cOrtofarma – Controle de Qualidade, 36120-000 Matias Barbosa-MG, Brazil
Table S1. “b” Coeficient calculation
Coeficients Signiicant intervals
Mean 60.03591 59.42733 60.64448999
X1 5.415861 5.082528 5.749194615
X2 13.55133 13.218 13.8846618
X
3 0.886864 0.614698 1.1590292
X12 −4.3891 -4.96645 −3.81174705
X22 17.08021 16.50286 17.65755911
X1X2 −2.25243 -2.66068 −1.84418205
X1X3 0.490914 0.157581 0.824247368
X2X3 −0.15214 -0.48547 0.181192138
X1X2X3 0.798203 0.389955 1.206451261
The coeficients were calculated using: (XtX)-1Xty; signiicant intervals
were calculated using: bi ± error × t0.05, ν=90.
Table S2. Standard error calculation of the “b” coeficients
0.30429 0 0 0 0 0 0 0 0 0
0 0.166667 0 0 0 0 0 0 0 0
0 0 0.166667 0 0 0 0 0 0 0
0 0 0 0.136083 0 0 0 0 0 0
0 0 0 0 0.288675 0 0 0 0 0
0 0 0 0 0 0.288675 0 0 0 0
0 0 0 0 0 0 0.204124 0 0 0
0 0 0 0 0 0 0 0.166667 0 0
0 0 0 0 0 0 0 0 0.166667 0
0 0 0 0 0 0 0 0 0 0.204124
Figure S1. Response surface for the 32 × 2 mixed factorial design. X1 = stirring speed (rpm); X2 = dissolution medium.
Table S3. Plotting of the response surface. The levels were substituted in the statistical model in order to ind the region of best response
X2
1 0.8 0.6 0.4 0.2 0 −0.2 −0.4 −0.6 −0.8
50 82.56052388 73.44097 65.68782 59.3011 54.28079 50.6269 48.33943 47.41837 47.86373 49.6755
40 85.03110851 75.96972 68.27475 61.94619 56.98405 53.38833 51.15903 50.29614 50.79966 52.66961
30 87.15056535 78.14735 70.51054 64.24016 59.33619 55.79863 53.6275 52.82278 53.38447 55.31259
20 88.9188944 79.97384 72.39521 66.18299 61.33719 57.85781 55.74484 54.99829 55.61816 57.60444
10 90.33609567 81.44921 73.92875 67.7747 62.98707 59.56585 57.51106 56.82267 57.50071 59.54516
X1 0 91.40216915 82.57346 75.11116 69.01528 64.28582 60.92277 58.92614 58.29593 59.03214 61.13476
20 92.11711485 83.34657 75.94244 69.90473 65.23344 61.92856 59.9901 59.41806 60.21243 62.37322
40 92.48093276 83.76856 76.4226 70.44306 65.82994 62.58323 60.70294 60.18906 61.0416 63.26056
60 92.49362289 83.83942 76.55163 70.63026 66.0753 62.88676 61.06464 60.60894 61.51965 63.79678
80 92.15518523 83.55915 76.32953 70.46633 65.96954 62.83917 61.07522 60.67768 61.64656 63.98186