http://dx.doi.org/10.1590/1516-635x160217-24
Author(s)
Araújo WAG deI
Albino LFTII
Rostagno HSII
Hannas MIII
Pessoa GBSIII
Messias RKGIII
Lelis GRIII
Ribeiro Jr VIII
I Professor IFNMG. E.mail: aziszoo@yahoo.
com.br
I Professor DZO/UFV III Ph.D, student, DZO/ UFV.
Part of the Ph.D. thesis presented to DZO/UFV by the first author. Project funded by FA-PEMIG.
Mail Adress
Corresponding author e-mail address E-mail: aziszoo@yahoo
Keywords
Sunflower meal, broilers, enzyme blend, and alternative feedstuffs.
Submitted: December/2013 Approved: March/2014
ABSTRACT
The objective of this study was to evaluate the performance of male broilers between 21 and 42 days of age fed diets supplemented with an enzyme blend (EB) and containing graded levels of sunflower meal (SFM). In total, 1920 male Cobb broilers were distributed according to a randomized block experimental design in a 4 x 3 factorial arrangement (four SFM dietary levels vs. three feed formulations) with eight replicates of 20 birds each. Dietary SFM inclusion levels were 0, 8, 16, and 24%. Feed formulation included one negative control diet (NC) formulated to supply broiler nutritional requirements, considering EB nutritional matrix values; a diet formulated as the first one, but with the addition of 0.5% EB (NC+EB); and the third diet (positive control – PC) was calculated to supply broiler requirements. Feed intake, weight gain, feed conversion ratio, and carcass parameters were evaluated. There was no effect of EB dietary supplementation on the evaluated performance or carcass parameters (p>0.05). Increasing dietary addition of SFM reduced weight gain and worsened feed conversion ratio (p>0.05). The best EEI was obtained with the NC+EB diet containing 8.0% SFM.
INTRODUCTION
Brazilian production of sunflower seeds account for only 0.003% of global production, but it is rapidly expanding. In 2009, total sunflower crop area was 87,800 ha, with a productivity of 1463 kg/ha, resulting a total production of 128,500 tons of sunflower (Rosa et al., 2009).
In Brazil, sunflower is mostly used for oil production. In addition of producing edible oil, sunflower is also a potential renewable energy source, as it can be used as a raw material for biodiesel (Porto et al., 2008). The global demand for sunflower oil has increased 1.8% per year, in average, whereas the domestic demand grows 13% per annum (Rosa et al., 2009), resulting in a gradual increase in sunflower crop area in Brazil.
Sunflower meal (SFM) is a by-product of the sunflower oil industry, and has been increasingly added to feeds, particularly in the south and mid-west of Brazil. The main challenge of including SFM in broiler feeds is its high fiber content (NRC 1994, FEDNA 2003, INRA 2004), which may negatively influence performance and carcass quality. Some exogenous enzyme may be added to broiler diets containing SFM to aid fiber digestion (carbohydrases) or to solubilize phytic phosphorus (phytase), thereby reducing their negatives effects on broiler production parameters.
Reports on the results of the inclusion of sunflower meal in broiler feeds are controversial. According to Furlan et al. (2001), sunflower
with no detrimental effects on performance. Senkoylu
et al. (2006) did not observe any effect on broiler
performance when up to 28% SFM was included in the feed. However, those authors used the residue SFM cold-pressing , which is more nutritious (32.3% CP and 18.78% EE) than sunflower meal. Tavernari
et al. (2009) did not find weight gain differences in broilers fed up to 20.0% SFM.
On the other hand, Pinheiro et al. (2002) found that
SFM levels higher than 12.0% reduced broiler weight gain, as well as feed intake, while obtaining the best feed intake when SFM was not added to the feed. Tavernari et al. (2009) also reported that broiler feed
intake was inversely proportional to SFM dietary level. Exogenous enzymes are frequently added to feeds to improve the nutritional value of feedstuffs, particularly of those containing high fiber levels (Kocher et al., 2000). Tavernari et al. obtained better dry matter digestibility and better coefficients of Ca and P metabolizability in broilers fed diets with SFM supplemented with enzymes. Kocher et al. (2000), on
the other hand, did not observe any effects of enzyme addition in feeds containing sunflower meal.
High sunflower meal levels in broiler diets require the addition of high oil levels in order to compensate the low energy content of SFM. Oil is one of the most expensive feedstuffs in broiler diets.
The objective of this study was to evaluate the performance, carcass traits and economics of the inclusion of different sunflower meal levels in diets supplemented or not with an enzyme complex fed to 21- to 42-d-old broilers.
MATERIAL AND METHODS
The experiment was carried out between May and June, 2010, at the facilities of the poultry sector of the Department of Animal Science of Universidade Federal de Viçosa, MG, Brazil.
In the study, 1920 male Cobb broilers, with 0.852 ± 0.012 kg average initial weight were evaluated in the period of 21 to 42 days of age. Birds were housed in a masonry broiler house, with open-sides with wire mesh, and clay tiles subdivided in 1.0 × 1.5 m pens covered with wood-shavings litter and equipped with nipple drinkers and tube feeders. House temperature was measured once daily (08:00 h) to determine maximum and minimum temperatures during the experimental period.
Broilers were distributed according to a randomized block experimental design in a 4 x 3 factorial arrange-ment (four SFM dietary levels vs. three feed
formula-tions) with eight replicates of 20 birds each. Pens were arranged in four longitudinal lines in the house, each with the same number of experimental units (pens), and considered as one block.
Sunflower meal was included at 0, 8, 16, and 24% of the diets with three different formulations (Table 1). The positive control (PC) diets were calculated to supply broilers’ nutritional requirements according to Rostagno et al. (2005; Table 2). The negative control (NC)
diets were calculated considering the nutritional matrix of the enzyme blend (EB) but were not supplemented with EB. The NC+EB diets were calculated as NC and supplemented with 0.005% EB. The enzyme blend, containing carbohydrases and phytase was added to improve the digestibility of the feed components that serve as substrate for these enzymes.
The chemical composition of sunflower meal (Table 3) was determined at the feedstuff analysis laboratory of the Department of Animal Science of the Federal University of Viçosa, and its digestible amino acids were taken from literature (NRC, 1994; FEDNA, 2003; INRA, 2004; Tavernari et al., 2010).
Mortality was recorded to allow performance data correction. Birds and feeds were weighed in the beginning and at the end of the experimental period (21 and 42 days) to calculate weight gain, feed intake, feed conversion ratio, livability, and production efficiency index (PEI) of 42-d-old birds, according to the equations: Livability = 100 – MO, and PEI = [(ABW * livability)/MA * FCR]*100, where MO = mortality, ABW =average body weight at slaughter; MA = market age, and FCR = feed conversion ratio.
In order to evaluate the economic viability of the inclusion of sunflower meal in the diet, diet cost was determined in Brazilian real (R$), per kg live weight produced (Yi). The following equation, adapted from Bellaver et al. (1985) was applied: Yi = (Pi * Qi) / Ei,
where Yi = cost of the kilogram of live weight in the i-th treatment (sunflower meal level); Pi = price per kilogram of the diet utilized in the i-th treatment; Qi, quantity of diet consumed in the i-th treatment; and Ei = kilogram of live weight produced. The economic efficiency index (EEI) was then calculated as: EEI = (LCe / CTei) * 100, in which LCe = lowest cost of diet per live weight produced observed among treatments; and CTEi = cost of the i-th treatment.
(R$ 1.18), L-lysine (R$ 4,84), L-threonine (R$ 8.15), corn (R$ 0.53), oil (R$ 2.57), salt (R$ 0.19), salinomycin (R$ 2.195), vitamin supplement (R$ 3.30) and mineral supplement (R$ 1.86).
Three birds per replicate were sacrificed at 42 days of age to determine carcass, breast, breast fillet, thighs and drumstick, and abdominal fat yields relative to cold carcass weight (after the chiller).
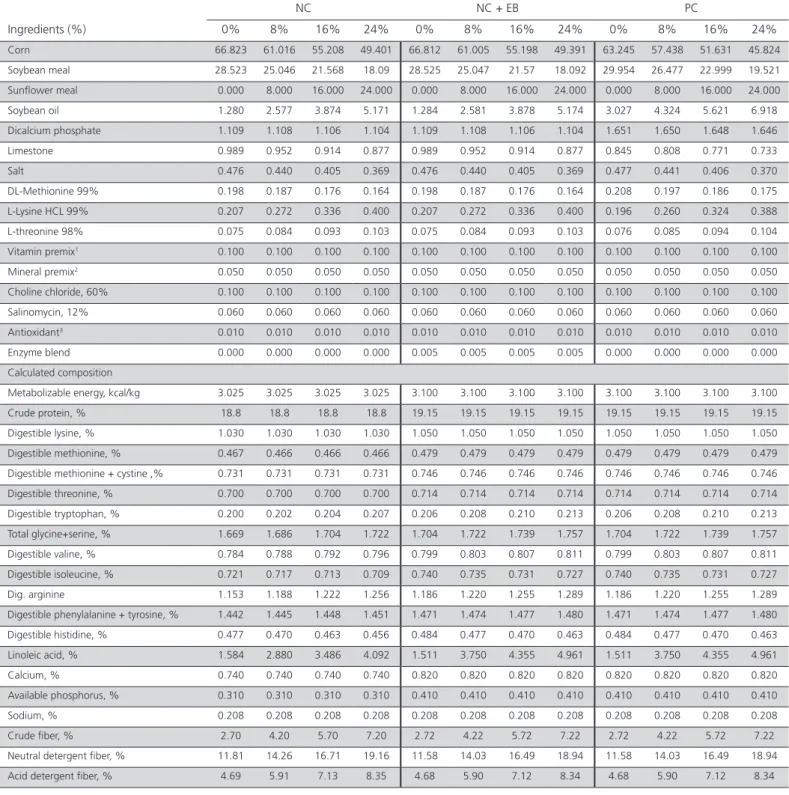
Table 1 – Ingredients and chemical composition of broiler feeds containing different sunflower meal levels and supplemented or not with an enzyme blend, on as-fed basis.
NC NC + EB PC
Ingredients (%) 0% 8% 16% 24% 0% 8% 16% 24% 0% 8% 16% 24%
Corn 66.823 61.016 55.208 49.401 66.812 61.005 55.198 49.391 63.245 57.438 51.631 45.824
Soybean meal 28.523 25.046 21.568 18.09 28.525 25.047 21.57 18.092 29.954 26.477 22.999 19.521
Sunflower meal 0.000 8.000 16.000 24.000 0.000 8.000 16.000 24.000 0.000 8.000 16.000 24.000
Soybean oil 1.280 2.577 3.874 5.171 1.284 2.581 3.878 5.174 3.027 4.324 5.621 6.918
Dicalcium phosphate 1.109 1.108 1.106 1.104 1.109 1.108 1.106 1.104 1.651 1.650 1.648 1.646
Limestone 0.989 0.952 0.914 0.877 0.989 0.952 0.914 0.877 0.845 0.808 0.771 0.733
Salt 0.476 0.440 0.405 0.369 0.476 0.440 0.405 0.369 0.477 0.441 0.406 0.370
DL-Methionine 99% 0.198 0.187 0.176 0.164 0.198 0.187 0.176 0.164 0.208 0.197 0.186 0.175
L-Lysine HCL 99% 0.207 0.272 0.336 0.400 0.207 0.272 0.336 0.400 0.196 0.260 0.324 0.388
L-threonine 98% 0.075 0.084 0.093 0.103 0.075 0.084 0.093 0.103 0.076 0.085 0.094 0.104
Vitamin premix1 0.100 0.100 0.100 0.100 0.100 0.100 0.100 0.100 0.100 0.100 0.100 0.100
Mineral premix2 0.050 0.050 0.050 0.050 0.050 0.050 0.050 0.050 0.050 0.050 0.050 0.050
Choline chloride, 60% 0.100 0.100 0.100 0.100 0.100 0.100 0.100 0.100 0.100 0.100 0.100 0.100
Salinomycin, 12% 0.060 0.060 0.060 0.060 0.060 0.060 0.060 0.060 0.060 0.060 0.060 0.060
Antioxidant3 0.010 0.010 0.010 0.010 0.010 0.010 0.010 0.010 0.010 0.010 0.010 0.010
Enzyme blend 0.000 0.000 0.000 0.000 0.005 0.005 0.005 0.005 0.000 0.000 0.000 0.000
Calculated composition
Metabolizable energy, kcal/kg 3.025 3.025 3.025 3.025 3.100 3.100 3.100 3.100 3.100 3.100 3.100 3.100
Crude protein, % 18.8 18.8 18.8 18.8 19.15 19.15 19.15 19.15 19.15 19.15 19.15 19.15
Digestible lysine, % 1.030 1.030 1.030 1.030 1.050 1.050 1.050 1.050 1.050 1.050 1.050 1.050
Digestible methionine, % 0.467 0.466 0.466 0.466 0.479 0.479 0.479 0.479 0.479 0.479 0.479 0.479
Digestible methionine + cystine ,% 0.731 0.731 0.731 0.731 0.746 0.746 0.746 0.746 0.746 0.746 0.746 0.746
Digestible threonine, % 0.700 0.700 0.700 0.700 0.714 0.714 0.714 0.714 0.714 0.714 0.714 0.714
Digestible tryptophan, % 0.200 0.202 0.204 0.207 0.206 0.208 0.210 0.213 0.206 0.208 0.210 0.213
Total glycine+serine, % 1.669 1.686 1.704 1.722 1.704 1.722 1.739 1.757 1.704 1.722 1.739 1.757
Digestible valine, % 0.784 0.788 0.792 0.796 0.799 0.803 0.807 0.811 0.799 0.803 0.807 0.811
Digestible isoleucine, % 0.721 0.717 0.713 0.709 0.740 0.735 0.731 0.727 0.740 0.735 0.731 0.727
Dig. arginine 1.153 1.188 1.222 1.256 1.186 1.220 1.255 1.289 1.186 1.220 1.255 1.289
Digestible phenylalanine + tyrosine, % 1.442 1.445 1.448 1.451 1.471 1.474 1.477 1.480 1.471 1.474 1.477 1.480
Digestible histidine, % 0.477 0.470 0.463 0.456 0.484 0.477 0.470 0.463 0.484 0.477 0.470 0.463
Linoleic acid, % 1.584 2.880 3.486 4.092 1.511 3.750 4.355 4.961 1.511 3.750 4.355 4.961
Calcium, % 0.740 0.740 0.740 0.740 0.820 0.820 0.820 0.820 0.820 0.820 0.820 0.820
Available phosphorus, % 0.310 0.310 0.310 0.310 0.410 0.410 0.410 0.410 0.410 0.410 0.410 0.410
Sodium, % 0.208 0.208 0.208 0.208 0.208 0.208 0.208 0.208 0.208 0.208 0.208 0.208
Crude fiber, % 2.70 4.20 5.70 7.20 2.72 4.22 5.72 7.22 2.72 4.22 5.72 7.22
Neutral detergent fiber, % 11.81 14.26 16.71 19.16 11.58 14.03 16.49 18.94 11.58 14.03 16.49 18.94
Acid detergent fiber, % 4.69 5.91 7.13 8.35 4.68 5.90 7.12 8.34 4.68 5.90 7.12 8.34
1 Vitamin premix (content/kg product): vit. A – 10,000,000 IU; vit. D3 – 2,000,000 IU; vit. E – 30,000 IU; vit. B1 - 2.0 g; vit. B2 - 6.0 g; vit. B6 - 4.0 g; vit. B12 - 0.015 g; pantothenic acid - 12.0 g; biotin - 0.1 g; vit. K3 - 3.0 g; folic acid - 1.0 g; nicotinic acid - 50.0 g; Se - 250.0 mg.
2 Mineral premix (content/kg product): Fe - 80 g; Cu - 10 g; Co - 2 g; Mn - 80 g; Zn - 50 g; I - 1 g.
Table 2 – Nutritional values attributed to the enzyme blend1
Nutritional matrix Per kg Added at
levels of Metabolizable energy, kcal/kg 1.500.000 75
Crude protein, % 7.000 0.350
Digestible lysine, % 180 0.009
Digestible methionine, % 80 0.004
Digestible methionine + cystine, % 140 0.007
Digestible threonine, % 120 0.006
Digestible tryptophan, % 40 0.002
Digestible valine, % 200 0.010
Digestible arginine, % 230 0.012
Composition of the enzyme blend (%)
Endo-1,3(4)-beta-glucanase 14.0
Xylanase 11.0
6-phytase 5.0
Inert material 70.0
1Rovabio Excel AP®
Table 3 – Chemical composition of sunflower meal
Sunflower meal
Dry matter1 91.37
Metabolizable energy, kcal/kg2 1.983
Crude protein, %1 25.00
Digestible lysine, %2 0.634
Digestible methionine, %2 0.504
Digestible methionine + cystine, % 0.858
Digestible threonine, % 0.765
Digestible tryptophan, % 0.315
Total glycine+serine, % 2.560
Digestible valine, % 1.140
Digestible isoleucine, % 0.970
Digestible arginine, % 2.080
Digestible phenylalanine + tyrosine, % 2.050
Digestible histidine, % 0.570
Linoleic acid, % 0.600
Ether extract, % 2.120
Ashes, % 4.730
Calcium, % 0.140
Total phosphorus, % 0.939
Available phosphorus, % 0.310
Sodium, % 0.200
Crude fiber, % 22.37
Neutral detergent fiber, % 45.19
Acid detergent fiber, % 21.35
1 Analyses performed at the animal nutrition laboratory, UFV.
2 Average values according to the NRC (1994), FEDNA (2003), INRA (2004) and Taver-nari et al. (2010).
Performance and carcass trait results were analyzed using the PROC GLM of SAS© statistical package according to a factorial arrangement at 5% significance level. Linear and quadratic functions were applied to determine the optimal level of sunflower meal, and the test of Student-Newmann-Keul to evaluate the inclusion of the enzyme blend.
RESULTS AND DISCUSSION
Average temperature recorded during the experiment was 21.5°C (16.0 and 27.0°C minimum and maximum temperatures, respectively), which was within the thermal comfort zone for broilers at the evaluated age.
Feed intake was influenced by the interaction between feed formulation and SFM levels (p<0.05, Table 4). Higher feed intake was obtained when feeds were calculated with nutritional deficiency and no inclusion of the enzyme blend (NC) than in the feeds calculated with adequate nutritional levels (PC) at the level of 8.0% inclusion of SFM. The influence of dietary energy content influences feed intake, which may explain this result. According to Nascimento et al.
(2005), feed intake is closely related to feed energy level, supporting the results obtained. The inclusion of the enzyme blend did not affect feed intake (p>0.05, Table 4). Abdelrahman & Saleh (2007) also did not find any influence of the inclusion of glucanase in SFM diets. On the other hand, Raza et al. (2009) verified higher
weight gain and better feed conversion ratio when adding carbohydrases to SFM diets fed to broilers.
There was a linear effect (p<0.05, Table 4) of sunflower meal levels on feed intake, which increased only in the PC diets (Table 5), differently from the reports of Furlan et al. (2001) and Tavernari et al.
(2009), who did not find any significant differences in that parameter up to the levels of 20 and 25% SFM inclusion, respectively. Abdelrahman & Saleh (2007) obtained higher feed intake with the inclusion of 10% sunflower meal.
Despite containing soluble fibers, sunflower meal also contains high insoluble fiber levels, which are represented by the approximate difference between NDF and ADF (45.19 and 21.35%, respectively). Insoluble fibers increase fecal volume and defecation frequency, reducing intestinal transit time (Mattos & Martins, 2000). Poultry have a short digestive tract, and therefore, high fiber levels that increase passage rate reduce nutrient absorption (Macari, 2008). We hypothesize that a lower nutrient absorption when broilers were fed higher sunflower meal levels could lead to compensatory feed intake.
in Table 5. The recommendations of sunflower meal dietary inclusion in the present study are different from those of other authors, who reported that inclusion of 12.04%, 12.0%, 10.0%, and up to 25% did not affect weight gain (Furlan et al., 2001; Pinheiro et al., 2002; Abdelrahman & Saleh, 2007; Tavernari et al., 2009, respectively).
Modern broiler strains present increasing nutritional requirements, and demand highly digestible diets with increasing nutritional values. Sunflower meal has high fiber content (NDF = 45.19%), which negatively affects nutrient absorption, resulting in worse performance.
The interaction of feed formulation with SFM levels also influenced (p<0.05, Table 4) feed conversion ratio, which was worse when broilers were fed the NC diets compared with the PC diets for the SFM level of 0.8%.
Table 5 – Regression equations of weight gain and feed conversion ratio of broilers fed diets with increasing sunflower meal levels and supplemented or not with an enzyme blend.
Feed formulationα Feed intake (g/bird)
NC Not significant (p>0.05)
NC +EB Not significant (p>0.05)
PC Feed intake = 3.878.3 + 6.725 SFM β (R2 0.97)
Weight gain (g/bird)
Weight gain = 2.165.9 – 5.1021 SFM (%) (R2 0.83)
Feed formulation Feed conversion ratio (g/g)
NC feed conversion ratio = 1.8696 + 0.0028SFM (R2 0.48)
NC +EB Feed conversion ratio = 1.8776 + 0.0034 SFM (R2 0.83)
PC Feed conversion ratio = 1.7974 + 0.0055 SFM (R2 0.92)
αNC = negative control; NC+EB = negative control + enzyme blend; PC = positive control.
βSFM = sunflower meal percentage in the feed.
Table 4 – Performance of 21- to 42-d-old broilers fed diets with increasing sunflower meal levels and supplemented or not with an enzyme blend.
Sunflower meal levels
0% 8% 16% 24%
Feed intake (g/bird) Mean
NC 4.068a 4.117a 3.943a 4.029a 4.039
NC +EB 4.008a 4.015ab 3935a 4.068a 4.007
PC 3.881b 3.920b 4.002a 3.601a 3.851
Mean 3.986 4.017 3.960 3.899
ANOVA FFα = 0.0094* SFMβ = 0.1235ns FF X SFMγ = 0.0163* CV(%) = 3.28
Probability - NS L
Weight gain (g/bird) Mean
NC 2.183 2.128 2.074 2.022 2.102
NC +EB 2.142 2.158 2.041 2.067 2.102
PC 2.167 2.124 2.081 2.063 2.109
Mean 2.164 2.137 2.065 2.051
ANOVA - SFM = <.0001* FF X SFM γ = 0.2617ns* CV(%) = 2.99
Probability - L NS
Feed conversion ratio (g/g) Mean
NC 1.863a 1.935a 1.901a 1.993a 1.923
NC +EB 1.871a 1.861ab 1.928a 1.968a 1.907
PC 1.791b 1.846b 1.923a 1.746a 1.826
Mean 1.842 1.880 1.917 1.902
ANOVA Trat = <0.0001* SFM = <0.0001* FF X SFM γ = 0.0026* CV(%) = 2.88
Probability - L L
αNC = negative control; NC+EB = negative control + enzyme blend; PC = positive control.
βSFM = sunflower meal percentage in the feed.
γInteraction between feed formulation andSFM.
a,b Means followed by different letters in the same column are statistically different by the SNK test (p<0.05)
ns Not significant by the F test (p>0.05).
* Significant by the F test (p>0.05).
Sunflower meal levels had a linear effect (p<0.05, Table 5) on feed conversion ratio. However, different equations were obtained for each feed formulation (NC, NC+ EB, and PC). The equations show that feed conversion ratio worsened as sunflower meal level increased. At a same SFM inclusion level, feed formulation worsened feed conversion ratio in the following order: NC, NC+EB, and PC. These results do not agree with the findings of several authors (Furlan et al., 2001; Pinheiro et al., 2002; Abdelrahman & Saleh, 2007; Tavernari et al., 2009).
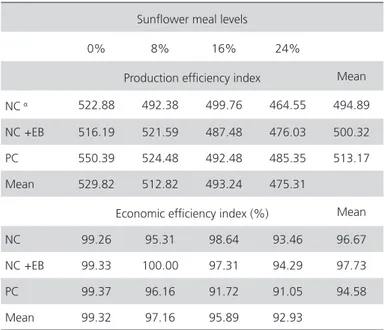
The best production efficiency index (PEI) was obtained in broilers fed the PC diet with not inclusion of sunflower meal (Table 6). However, the best economic efficiency index (EEI) was obtained in the broilers fed the NC+EB diet containing 8.0% sunflower meal (Table 6). Therefore, despite resulting in worse performance, the inclusion of 8.0% sunflower meal may be economically viable, as well as the addition of the enzyme blend to this feed. On the other hand, Furlan et al. (2001) and Tavernari et al. (2009) verified
better EEI when sunflower meal was not included in the feeds, but Pinheiro et al. (2002) reported that the
inclusion of 4.0% SFM promoted the best EEI.
Table 6 – Production efficiency index (PEI) and economic efficiency index (EEI) of broilers fed diets with increasing sunflower meal levels and supplemented or not with an enzyme blend.
Sunflower meal levels
0% 8% 16% 24%
Production efficiency index Mean
NCα 522.88 492.38 499.76 464.55 494.89
NC +EB 516.19 521.59 487.48 476.03 500.32
PC 550.39 524.48 492.48 485.35 513.17
Mean 529.82 512.82 493.24 475.31
Economic efficiency index (%) Mean
NC 99.26 95.31 98.64 93.46 96.67
NC +EB 99.33 100.00 97.31 94.29 97.73
PC 99.37 96.16 91.72 91.05 94.58
Mean 99.32 97.16 95.89 92.93
αNC = negative control; NC+EB = negative control + enzyme blend; PC = positive control.
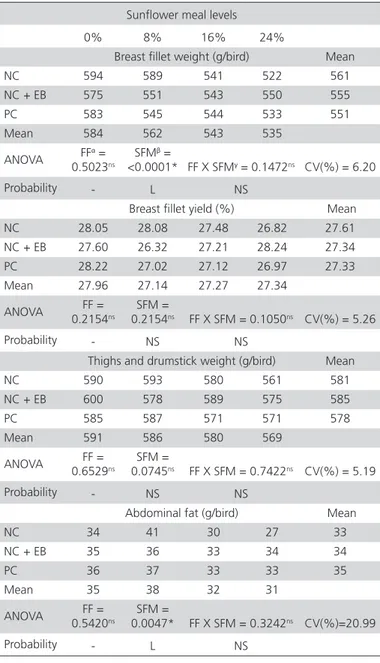
There was no effect of feed formulation (NC, NC+EB, or PC) or of the interaction between feed formulation and sunflower meal levels (p>0.05) on carcass traits (Tables 7 and 8). Sunflower meal levels
linearly affected carcass, breast, breast fillet, and abdominal fat weights (p<0.05, Tables 7 and 8). It was concluded the increasing sunflower meal levels reduce some carcass traits, as described by the equations in Table 9.
Table 7 – Carcass weight, breast weight, and breast yield of broilers fed diets with increasing sunflower meal levels and supplemented or not with an enzyme blend.
Sunflower meal levels
0% 8% 16% 24%
Carcass weight (g/bird) Mean
NC 2.116 2.098 1.972 1.943 2.032
NC + EB 2.084 2.097 1.994 1.947 2.030
PC 2.066 2.018 2.007 1.974 2.016
Mean 2.089 2.071 1.991 1.955
ANOVA FF
α =
0.6169ns
SFMβ =
<0.0001* FF X SFMγ = 0.1473ns
CV(%) = 3.45
Probability - L NS
Breast weight (g/bird) Mean
NC 769 747 700 679 724
NC + EB 743 736 706 711 724
PC 735 709 714 690 712
Mean 749 731 707 693
ANOVA FF =
0.3748ns
SFM =
<0.0001* FF X SFM γ = 0.2288ns
CV(%) = 5.47
Probability - L NS
Breast yield (%) Mean
NC 36.32 35.65 35.50 34.93 35.600
NC + EB 35.64 35.11 35.40 36.55 35.675
PC 35.55 35.12 35.55 34.90 35.280
Mean 35.837 35.293 35.483 35.460
ANOVA FF =
0.5145ns
SFM =
0.6112ns FF X SFM = 0.2753ns
CV(%) = 4.04
Probability - NS NS
αNC = negative control; NC+EB = negative control + enzyme blend; PC = positive control.
β SFM = sunflower meal percentage in the feed.
γInteraction between feed formulation and SFM.
ns Not significant by the F test (p>0.05).
* Significant by the F test (p>0.05).
Q – quadratic effect (p≤0.05) of sunflower meal. L – linear effect (p≤0.05) of sunflower meal. NS – not significant.
et al. (2003) and Tavernari et al. (2009), who did
not find any influence on carcass traits of SFM levels up to 25.0% and 30.0%, respectively, as well as no significant differences in weight gain, which explains carcass results.
Table 8 – Breast fillet weight, and breast fillet, thighs and drumstick, and abdominal fat yields of broilers fed diets with increasing sunflower meal levels and supplemented or not with an enzyme blend.
Sunflower meal levels
0% 8% 16% 24%
Breast fillet weight (g/bird) Mean
NC 594 589 541 522 561
NC + EB 575 551 543 550 555
PC 583 545 544 533 551
Mean 584 562 543 535
ANOVA FF
α =
0.5023ns
SFMβ =
<0.0001* FF X SFMγ = 0.1472ns CV(%) = 6.20
Probability - L NS
Breast fillet yield (%) Mean
NC 28.05 28.08 27.48 26.82 27.61
NC + EB 27.60 26.32 27.21 28.24 27.34
PC 28.22 27.02 27.12 26.97 27.33
Mean 27.96 27.14 27.27 27.34
ANOVA FF =
0.2154ns
SFM =
0.2154ns FF X SFM = 0.1050ns CV(%) = 5.26
Probability - NS NS
Thighs and drumstick weight (g/bird) Mean
NC 590 593 580 561 581
NC + EB 600 578 589 575 585
PC 585 587 571 571 578
Mean 591 586 580 569
ANOVA FF =
0.6529ns
SFM =
0.0745ns FF X SFM = 0.7422ns CV(%) = 5.19
Probability - NS NS
Abdominal fat (g/bird) Mean
NC 34 41 30 27 33
NC + EB 35 36 33 34 34
PC 36 37 33 33 35
Mean 35 38 32 31
ANOVA FF =
0.5420ns
SFM =
0.0047* FF X SFM = 0.3242ns CV(%)=20.99
Probability - L NS
αNC = negative control; NC+EB = negative control + enzyme blend; PC = positive control.
βSFM = sunflower meal percentage in the feed.
γInteraction between feed formulation and SFM.
ns Not significant by the F test (p>0.05).
* Significant by the F test (p>0.05).
Q – quadratic effect (p≤0.05) of sunflower meal. L – linear effect (p≤0.05) of sunflower meal. NS – not significant.
Table 9 – Regression equations of the parameters carcass weight, breast weight, breast fillet weight, and abdominal fat of broilers fed diets with increasing sunflower meal levels and supplemented or not with an enzyme blend.
Carcass weight (g/bird) = 2.098.6 – 6.0312 SFM1 (R2 0.94)
Breast weight (g/bird) = 748.6 – 2.3926 SFM (R2 0.99)
Breast fillet weight (g/bird) = 580.81 – 2.0846 SFM (R2 0.96)
Abdominal fat (g/bird) = 36.625 – 0.2161 SFM (R2 0.97)
1 SFM = sunflower meal percentage in the feed.
CONCLUSIONS
Increasing dietary addition of SFM reduced weight gain and worsened feed conversion ratio (P>0.05). The best EEI was obtained with the NC+EB diet containing 8.0% SFM. The inclusion of sunflower meal in broiler feeds negatively influenced performance and carcass parameters. The dietary inclusion of the enzyme blend did not improve the evaluated parameters. However, the inclusion of 8% SFM and EB addition to the diet improves EEI.
ACKNOWLEDGMENTS
The authors thank Fundação de Amparo à Pesquisa do Estado de Minas Gerais for their support.
REFERENCES
Abdelrahman MM, Saleh FH. Performance of Broiler Chickens Fed on Corn- Sunflower Meal Diets with ß- Glucanase Enzyme. Jordan Journal of Agricultural Sciences 2007;3(3):272-280.
Bellaver C, Fialho, ET, Protas JFS, et al. Radícula de malte na alimentação de
suínos em crescimento e terminação. Pesquisa Agropecuária Brasileira 1985;20(8):969-974.
Fundacíon Española para el Desarrollo de la Nutrición Animal. Tablas de composición y valor nutritivo de alimentos para la fabricación de piensos compuestos. 2ª ed. Madrid: Mundi-prensa; 2003. 423p.
Furlan AC, Mantovani C, Murakami AE, et al. Utilização do farelo de girassol
na alimentação de frangos de corte. Revista Brasileira de Zootecnia 2001;30(1):158-164.
Institute National de loa Recherche Agronomique. Tablas de composición y de valor nutritivo de las materias primas destinadas a los animales de interés ganadero: cerdos, aves, bovinos, ovinos, caprinos, conejos, caballos, peces. Madrid: Ediciones Mundi Prensa; 2004. p.194-197.
Kocher A, Choct M, Porter MD, et al. The effects of enzyme addition to broiler diets containing high concentrations of canola or sunflower meal. Poultry Science 2000;79: 1767–1774.
Macari M, Furlan, RL, Gonzales E. Fisiologia aviária aplicada a frangos de corte. Jaboticabal: FUNEP/UNESP; 2008. 375p.
Nascimento AH, Gomes PC, Rostagno HS. et al. Valores de energia
metabolizável de farinhas de penas e de vísceras determinados com diferentes níveis de inclusão e duas idades das aves. Revista Brasileira de Zootecnia 2005;34(3):877-881.
National Research Council. Nutrient requirements of poultry. 9th ed.
Washington, D.C.: National Academy of Sciences; 1994. 155p.
Oliveira MC, Martins FF, Almeida CV, et al. Efeito da inclusão de bagaço de girassol na ração sobre o desempenho e rendimento de carcaça de frangos de corte. Revista Portuguesa de Zootecnia 2003;10(2):107-116.
Pinheiro JW, Fonseca NAN, Silva CA, et al. Farelo de girassol na alimentação
de frangos de corte em diferentes fases de desenvolvimento. Revista Brasileira de Zootecnia 2002;31(supl 3):1418-1425.
Porto WS, Carvalho CGP, Pinto RJB, et al. Evaluation of sunflowers cultivars
for central Brazil. Scientia Agrícola 2008;65(2):139-144.
Raza S, Ashraf M, Pasha TN, et al. Effect of enzyme supplementation of broiler diets containing varying level of sunflower meal and crude fiber. Pakistan Journal of Botany 2009;41(5):2543-2550.
Rosa PM, Antoniassi R, , et al. Chemical composition of Brazilian sunflower
varieties. Helia 2009;32(50):145-155.
Rostagno HS, Albino LFT, Donzele JL, et al. Tabelas brasileiras para aves e suínos: composição de alimentos e exigências nutricionais. Viçosa, MG: Universidade Federal de Viçosa; 2005. 168 p.
SAS Program. User guide for personal computer. Cary: SAS Institute; 2002. 846 p.
Tavernari FC, Albino LFT, Morata RL, et al. Inclusion of sunflower meal, with
or without enzyme supplementation, in broiler diets. Brazilian Journal of Poultry Science 2008;10 (4):233–238.
Tavernari FC, Dutra Junior WM, Albino LFT, et al. Efeito da utilização de
farelo de girassol na ração sobre o desempenho de frangos de corte. Revista Brasileira de Zootecnia 2009;38(9):1745-1750.
Tavernari FC, Morata RL, Ribeiro Jr V, et al. Avaliação nutricional e energética