Received 25/2/2010 Accepted 9/7/2010 (004684)
1 Universidade Federal do Paraná - UFPA, Av. Lothário Meissner, 632, CEP 80210-170, Jd. Botânico, Curitiba, PR, Brasil, e-mail: [email protected] 2 Universidade Federal de Santa Catarina – UFSC, Rod. SC 401, CEP 88049-900, Itacorubi, Florianópolis, SC, Brasil
*Corresponding author
Evaluation of phenolic compounds content and in vitro antioxidant
activity of red wines produced from
Vitis labrusca
grapes
Avaliação da concentração de compostos fenólicos e atividade antioxidante
in vitro de vinhos tintos produzidos a partir de uvas Vitis labrusca
Daniel Braga de LIMA1, Bruna Carla AGUSTINI1, Eliz Guimarães da SILVA1,
Fernanda GAENSLY1, Rodrigo Becker CORDEIRO1, Maria Luiza Drechsel FÁVERO1,
Debora BRAND1, Marcelo MARASCHIN2, Tania Maria Bordin BONFIM1*
1 Introduction
Brazilian winemaking is characterized by small properties, familiar labor, and production of common wines. This kind of wine is produced from American grapes and accounts for approximately 80% of the wine production in Brazil (BARNABÉ et al., 2007). Bordô (Ives) is a grape variety of the species Vitis labrusca, and it is known by the following regional names: Terci in the state of Paraná and Folha de figo in Minas Gerais. This grape is not well adapted to tropical climate; hence its cultivation in Brazil is limited to Paraná, Santa Catarina, Rio Grande do Sul, and Minas Gerais states. It provides high
concentration of pigment, which is the reason for its large geographic spread (EMBRAPA, 2005).
Polyphenols comprise a major group of secondary metabolites produced by grape vines. From a physiological perspective, they are important compounds for plants and for human health. Regarding plants, polyphenols act as protective agents against fungi attack and UV irradiation; concerning human health, they provide anti-carcinogenic and antioxidative protection, which could contribute to reducing the incidence of Resumo
A produção de vinhos ao norte de Curitiba, Paraná, Brasil, especificamente nas cidades de Colombo e Almirante Tamandaré, está baseada principalmente no uso de uvas Vitis labrusca var. Bordô (Ives). Os parâmetros – açúcar total, teor alcoólico, pH e acidez total – foram analisados em amostras de vinhos tintos das safras 2007 e 2008 por metodologias oficiais. Além disso, também foram determinadas as concentrações de compostos fenólicos totais, flavonoides e taninos por métodos colorimétricos e a atividade antioxidante foi determinada pelo método do radical 2,2-difenil-1-picrilhidrazila (DPPH). Os compostos fenólicos foram identificados por Cromatografia Líquida de Alta Eficiência. A concentração de compostos fenólicos totais das amostras de vinho variou entre 1582,35 e 2896,08 mg de ácido gálico.L-1, com
a maior parte correspondendo à concentração de flavonoides. Na faixa de concentração destes compostos, não foi encontrada relação direta entre compostos fenólicos e atividade antioxidante. Entre os compostos fenólicos identificados, os ácidos clorogênico e cafeico foram os componentes majoritários. Com o uso de três componentes principais, foi possível explicar 81,36% da variância total das amostras estudadas. A diferenciação entre as safras não foi possível com o uso da análise de componentes principais.
Palavras chave: rural; cantina; quimiometria; vinhos de mesa; CLAE; vinicultura.
Abstract
Wine production in the northern Curitiba, Paraná, Brazil, specifically the communes of Colombo and Almirante Tamandaré, is based mainly on the utilization of Vitis labrusca grapes var. Bordô (Ives). Total sugar content, pH, and total acidity were analyzed in red wine samples from 2007 and 2008 vintages following official methods of analysis. Moreover, total phenolic, flavonoid, and tannin contents were analyzed by colorimetric methodologies and the antioxidant activity was determined using the 2,2-diphenyl-1-picrylhydrazyl (DPPH) radical methodology. Phenolic compounds were identified by high performance liquid chromatography. The total phenolic content of wine samples presented concentrations varying between 1582.35 and 2896.08 mg gallic acid.L-1 since the major part corresponds to flavonoid content. In
these compounds’ concentration range, a direct relationship between phenolic compounds content and levels of antioxidant activity was not observed. Among the identified phenolic compounds, chlorogenic, caffeic, and syringic acids were found to be the major components. Using three principal components, it was possible to explain 81.36% of total variance of the studied samples. Principal Components Analysis does not differentiate between vintages.
Keywords: rural; winery; chemometrics; common wine; HPLC; viniculture.
Millipore’s Milli-Q water purification system (Barueri, Brazil). The HPLC analyses were performed in a Shimadzu SPD-M10A chromatograph with a diode-array detector and a Shim-Pack C-18 column. The antioxidant activity and total phenolic compound analyses were performed in a Shimadzu UV-1601 PC spectrophotometer (São Paulo, Brazil).
2.3 Physicochemical analyses
Total sugar content, pH, and titratable acidity were analyzed. All parameters were determined following the methodology described by the Ministério da Agricultura, Pecuária e Abastecimento (BRASIL, 2005).
2.4 Determination of total phenolic compounds (TPC)
Total phenolic compounds were determined following the modification proposed by Kiralp and Toppare (2006) of the colorimetric method described by Singleton and Rossi (1965). Therefore, the wine samples were diluted 1:10 in water.
2.5 Determination of flavonoid content
The flavonoid determination was performed by the indirect method using formaldehyde to precipitate those compounds, as described by Ough and Amerine (1988).
Ten milliliters of the sample were added to 5 mL of aqueous solution of chloridric acid 1:4, and 5 mL of formaldehyde 37%. After a 24 hour standstill period, the sample was filtered through a 0.45 µm membrane and used for the determination of TPC. The flavonoid content was calculated as the difference of TPC and non-flavonoid compound contents. The results were expressed as gallic acid equivalents (mg.L-1).
2.6 Determination of tannin content
Tannins were quantified indirectly according to Valdés et al. (2000). Ten milliliters of the sample were added to 40 mL of distilled water and 25 mL of gelatin 25%. Subsequently, 50 mL of an acidified saturated solution of sodium chloride 1% and 5 g of hydrous aluminum silicate were added, followed by a 30 minutes agitation period. After filtration through a 0.45 µm membrane, the solution was used for the determination of TPC. The tannin content was calculated as the difference of TPC and non-tannin compounds contents. The results were expressed as gallic acid equivalents (mg.L-1).
2.7 Determination of phenolic compounds by High Performance Liquid Chromatography
The chromatographic analyses of phenolic compounds were performed as previously described (MARASCHIN et al., 2003). The preparation of the wine samples was performed as follows: 15 mL of ethyl acetate, 1 g% of sodium carbonate, and 5 mL of the wine sample were placed in test tubes flushed with N2. After 12 hours at a temperature of 4 °C and absence of light, the organic fraction was collected and the solvent was removed at 50 °C, followed by its solubilization in methanol: HCl 1%. The coronary heart disease. From a winemaking view, polyphenols
act as antioxidants too, but they also contribute to wine’s color, aroma, flavor, astringency, and bitterness (RODRÍGUEZ-DELGADO et al., 2002; NIKFARDJAM et al., 2006).
The polyphenolic content depends on the grape variety, vineyard location, cultivation system, climate, soil type, vine cultivation practices, harvesting type, production process, and aging (DI MAJO et al., 2008). In the grapes, these compounds are found mostly in the skin and seeds (RODRÍGUEZ-DELGADO et al., 2002). When compared to other fruits, grapes are one of the major sources of phenolic compounds, but the great diversity between the cultivars results in grapes with different characteristics, such as color and flavor. This variance is associated to phenolic content and profile (ABE et al., 2007). The profile of phenolic compounds is extensively studied in wines produced with Vitis vinifera grapes (GAMBELLI; SANTARONI, 2004; NIKFARDJAM et al., 2006; ALÉN-RUIZ et al., 2009; RASTIJA et al., 2009), contrary to what is observed in common wines made from Vitis labrusca grapes (ABE et al., 2007).
Phenolic compounds have been related to the antioxidant activity of red wines (ALÉN-RUIZ et al., 2009). Antioxidants protect against free radicals, and are important tools in obtaining and preserving good health. Therefore, the antioxidant profiles of numerous compounds are frequently compared in order to indentify the most potent ones (ARTS et al., 2004). However, some polyphenol classes have provided different results. According to Alén-Ruiz et al. (2009), Fernández-Pachón et al. (2004), and Ghiselli et al. (1998), the antioxidant activity is correlated to total phenolic compounds content. On the other hand, Katalinic et al. (2004), show a correlation between antioxidant activity and flavonoid compounds only.
The present study aimed to analyze physicochemical parameters such as pH, titratable acidity, and total sugar content of the wines. Tannins, flavonoids, and total phenolic compounds were also quantified. The latter were identified and quantified by high performance liquid chromatography and their antioxidant activity was measured.
2 Materials and methods
2.1 Wine samples
Seventeen red wines from eleven wineries from the vintage years 2007–2008, made of Bordô (Ives) grape variety (Vitis labrusca L.), were analyzed. All wineries are localized on the northern metropolitan region of Curitiba, PR – Brazil. The wine samples are, henceforth, identified with letters followed by a number corresponding to the winery and vintage year, respectively.
2.2 Chemicals and analytical instruments
who worked with Vitis labrusca wines from three vintages obtaining values significantly higher than the ones presented in this study. On the other hand, the results are similar to those described by Lopez-Velez et al.(2003) and Woraratphoka et al. (2007). Both authors worked with Vitis vinifera wines and obtained the following range of values, 1857 to 2315 mg.L-1
and 1458 to 2987 mg.L-1, respectively. The standard deviation
values were large, which could be explained by the differences in grape variety, vinification technique, and storage time (MINUSSI et al., 2003).
Observing the results presented in Table 2, chlorogenic, caffeic, and syringic acids are the major phenolic compounds found in the four analyzed samples. Likewise, caffeic acid was one of the major compounds in Vitis labrusca wines analyzed by Arsego (2004). On the other hand, Rastija et al. (2009) did not samples were centrifuged at 5000 rpm for 5 minutes and filtered
through a 0.22 µm membrane. The injection volume was 10 µl. The HPLC analysis utilized a mobile phase that consisted of water, acetic acid, and n-butanol (350:1:10) and a flow rate of 1.0 mL.min-1. All compounds were detected at 325 nm, with
exception to epicatechin, gallic acid, and tannic acid, which were detected at 280 nm. To the matter of compound quantification, calibration curves were constructed using 2.5, 5.0, 10, 25, 50, and 100 µg.mL-1 (r2 = 0.99) of standard (Sigma-Aldrich, USA)
phenolic acids (gallic acid, protocatechuic acid, chlorogenic acid, p- m-coumaric acids, syringic acid, caffeic acid, ferulic acid, t-cinnamic acid, and dicaffeoylquinic acid) and epicatechin (5.0, 10, 25, 50, and 100 µg.mL-1, r2 = 0.98).
2.8 Determination of antioxidant activity
The radical scavenging ability of the wines was determined using the method of Brand-Williams et al. (1995) based on the reduction of 2,2,-diphenyl-1-picryhydrazyl (DPPH) absorbance on λ = 515 nm.
In the absence of light, wine samples were diluted 1:40 with a solution of DPPH 0.06 mM. This procedure was repeated using a control solution (methanol 50% and acetone 70%, 1:1). Methanol was used as blank solution for the spectrophotometer calibration. The measurements were collected every minute until reaching absorbance stability. The results were compared to a calibration curve ranging from 10 to 60 µM DPPH and were expressed as percentage of oxidation inhibition and were calculated as shown by Equation 1.
( )
%A 100 Acontrol Asample
Acontrol
−
= × (1)
2.9 Data analysis
Data matrix were created and box plot charts were made using Origin 6.1. Matlab 7.0.1 was used to perform Principal Component Analysis (PCA).
3 Results and discussion
3.1 Physicochemical parameters
Concerning to total sugar content, the common wines analyzed were classified as demi-sec (BRASIL, 1988). This classification is confirmed observing Figure 1, in which all samples are situated between 5.0 and 20.0 g.L-1.
The Brazilian legislation also establishes the limits for titratable acidity between 50 and 130 mEq.L-1 for wines. Both
vintages, the 2007 and 2008, presented results that do not meet the limits specified by the legislation (Figure 2).
3.2 Phenolic compounds determination and identification by High Performance Liquid Chromatography
Total phenolic compounds content of the samples ranged between 1582.35 and 2896.08 mg.L-1 (Table 1), which are
not in accordance with the results showed by Arsego (2004),
Figure 1. Box Plot of total sugar concentration (g.L-1) in wines vintages
2007 and 2008.For each vintage, mean, standard deviation, maximum,
and minimum values are shown. Dotted lines show the limits to classify wines as demi-sec according to the Brazilian legislation (BRASIL, 1988). Sample distribution is represented by the rhombi.
Figure 2. Box Plot of titratable acidity (mEq.L-1) in wines of
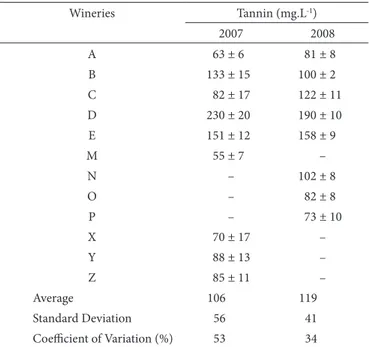
related similar tannin concentration in Spanish Vitis vinifera
wines ranging from 76.93 to 133.00 mg.L-1. However, Tecchio,
Miele and Rizzon (2007) showed different results for wines also produced from Vitis labrusca var. Bordô (Ives) ranging from 890 to 1950 mg.L-1. In addition, Rizzon et al.(2000) presented
slightly different results from those obtained in this study with wines produced from Vitis labrusca var. Isabel within 200 and 800 mg.L-1.
3.5 Determination of antioxidant activity
The antioxidant activity has been reported as highly related to the phenolic compounds content in wine (GHISELLI et al., found chlorogenic acid and found caffeic acid only in 25% of
the analyzed Vitis vinifera wines. Gallic, ferulic, and p-coumaric acids’ mean values were found to be lower than those reported in literature for Vitis vinifera wines (LANTE et al., 2004; KALLITHRAKA et al., 2006; RASTIJA et al., 2009). Croatian wines showed gallic and ferulic acids mean concentrations of 10.5 and 0.7 mg.L-1, respectively (RASTIJA et al., 2009). Ferulic
acid was present at the concentrations of 0.6 mg.L-1 in Greek red
wines (KALLITHRAKA et al., 2006), while p-coumaric acid was present at the concentration ranging from 0.23 to 7.07 mg.L-1
in Italian red wines (LANTE et al., 2004).
3.3 Flavonoids
The flavonoid content in the analyzed samples ranged between 947.03 and 2431.77 mg.L-1, in agreement with
Woraratphoka et al. (2007), who found values between 1184 and 2647 mg.L-1 in Vitis vinifera wines. Flavonoid contents were
slightly higher in the 2007 vintage with a mean concentration of 1780.01 mg.L-1 (Table 3). The values presented a large
variation probably due to differences in grape composition. Castillo-Sanchez et al.(2008) reported that different winemaking techniques can change the concentration of monomeric flavonoids by 20%, especially epicatechin.
3.4 Tannins
The tannin content in the analyzed wines ranged between 55.15 and 230.17 mg.L-1, corresponding to 2.51 to 12.02% of
total phenolic compounds. Tannin contents were slightly higher in the 2008 vintage with a mean concentration of 119.41 mg.L-1
(Table 4). The low levels of tannins in the analyzed wines show the minor presence of these compounds in the grape. Arsego (2004) also found similar percentages, 2.8 to 3.94%, when working with three vintages of Vitis labrusca wines. Monagas et al. (2003) also
Table 2. Phenolic compounds content (mg.L-1) in wines from 2007
and 2008 vintages determined by reversed phase-high performance liquid chromatography, with Uv-visible detection.
Phenolic compounds Concentration mg.L-1 Wine samples
B 07 C 07 D 07 B 08 Epicatechin 0.032 0.048 0.016 0.013 Gallic acid 0.072 0.251 0.155 0.055 Tannic acid 0.113 0.103 0.344 0.088
Protocatecuic acid 0.037 – – 0.041
Chlorogenic acid 0.258 0.296 0.169 0.266
p-coumaric acid 0.033 0.026 0.064 0.054 Syringic acid 0.190 0.329 0.189 0.185 Caffeic acid 0.267 0.259 0.141 0.383
t-cinnamic acid 0.004 0.007 0.002 0.001 Ferulic acid 0.056 0.024 0.205 0.061
m-coumaric acid 0.0006 – – 0.0002
Dicaffeoylquinic acid 0.005 0.006 0.004 1.22
Results are expressed as mg.L-1 ± SD. Missed results are due to the absence of sample
from the respective vintage.
Table 1. Total phenolic compounds content (mg gallic acid.L-1) in wines
from 2007 and 2008 vintages.
Wineries Total phenolic compounds (mg.L-1)
2007 2008
A 2263 ± 155 2229 ± 61
B 2662 ± 87 2652 ± 34
C 2117 ± 106 2187 ± 15
D 2321 ± 80 1582 ± 14
E 1855 ± 66 1725 ± 8
M 1665 ± 8 –
N – 2414 ± 151
O – 1588 ± 88
P – 2896 ± 55
X 2417 ± 83 –
Y 2059 ± 77 –
Z 1676 ± 88 –
Average 2115 2159
Standard Deviation 339 493
Coefficient of Variation (%) 16 23
Results are expressed as mg.L-1 ± SD. Missed results are due to the absence of sample
from the respective vintage.
Table 3. Flavonoid content (mg gallic acid.L-1) in wines from 2007
and 2008 vintages.
Wineries Flavonoids (mg.L-1)
2007 2008
A 1947 ± 52 1480 ± 25
B 2432 ± 15 2111 ± 40
C 1767 ± 17 1581 ± 54
D 1879 ± 81 947 ± 79
E 1542 ± 20 1050 ± 48
M 1335 ± 42 –
N – 1893 ± 104
O – 1018 ± 65
P – 2078 ± 50
X 1993 ± 77 –
Y 1777 ± 17 –
Z 1349 ± 44 –
Average 1780 1520
Standard Deviation 344 479
Coefficient of Variation (%) 19 32
Results are expressed as mg.L-1 ± SD.Missed results are due to the absence of sample
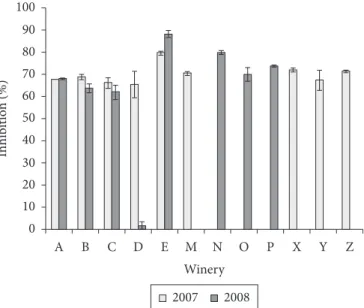
1998; ARNOUS et al., 2002; KATALINIC et al., 2004) although a number of authors observed no relationship between them (FERNÁNDEZ-PACHÓN et al., 2004; DI MAJO et al., 2008; ALÉN-RUIZ et al., 2009). Therefore, this study focused on finding a relationship between these parameters. The antioxidant activity concerning to the 2007 and 2008 vintages showed percentages of inhibition within 1.74 and 88.37% (Figure 3). Neither a pattern of antioxidant activity between the vintages nor a direct correlation between the antioxidant activity and phenolic compounds content could be observed. This could be seen in the results of the samples C08 and E08, for example. Sample C08 has a total phenolic compound content of 2187.30 mg.L-1 and provided an antioxidant activity a little higher
than 60% of inhibition. In contrast, sample E08, which had lower total phenolic compounds content of 1725.21 mg.L-1, showed a
much higher antioxidant activity of almost 90% of inhibition.
3.6 Data analysis
The use of chemometrics is an interesting tool regarding the application of mathematical and statistical methods to chemical data (COZZOLINO et al., 2009). Multivariate analysis was used to classify the wine samples according to the results they showed to antioxidant activity, titratable acidity, contents of total sugar, phenolic compounds, flavonoids, and tannins. In this context, the best known and most widely used variable-reduction method is the principal component analysis
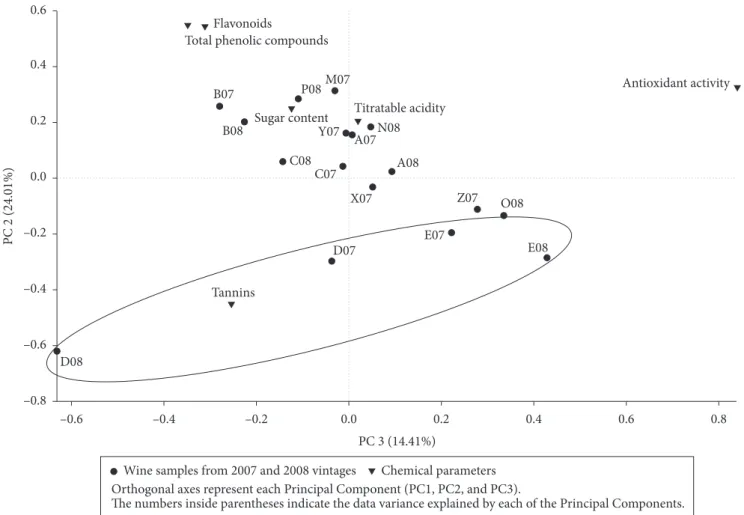
(PCA). Using this analytical tool, it was possible to explain 81.36% of total variance between the 17 wine samples studied. This was done through three principal components, PC1 explaining 42.94%, PC2 22.01%, and PC3 14.41% (Figure 4).
As observed in the fore mentioned results, the analyzed parameters are similar, regardless of the vintage. All of these
Figure 4. Biplot representation of samples according to PC1, PC2 and PC3.
parameters influence somehow the sample distribution on the PCA plot (Figure 4). In this plot, phenolic compounds content and antioxidant activity are disposed far from each other, corroborating the lack of relationship between them.
Except for the tannin content, the selected parameters were not capable to differentiate the samples. This occurs, in part, due to the difficulty to visualize the position of the samples in a 3D plot. When looking through a bidimensional plot, PC2 as function of PC3 (Figure 5), two minor groups are suggested. The first one contains the samples C08, D07, M07, and O08, which present the highest values for sugar content and titratable acidity. The latter is formed by the samples B07, B08, and P08, which show the highest values for total phenolic compounds and flavonoid contents.
In the bidimensional plot, PC1 as function of PC3 (Figure 6), it is possible to visualize that the tannin content parameter dislocates the samples D07 and D08 away from the others, which is justified by the fact that these samples present the highest tannin content. It can be noted that both samples are originated from the same winery suggesting that the grapes had a great tannin content or the winemaking process improved the extraction of this compound (PÉREZ-SERRADILLA; CASTRO, 2008).
Figure 5. Bidimensional biplot representation of samples according to principal components PC2 and PC3.Dotted lines indicate PC2 and PC3 limits.
Table 4. Tannin content (mg gallic acid.L-1) in wines from 2007 and
2008 vintages.
Wineries Tannin (mg.L-1)
2007 2008
A 63 ± 6 81 ± 8
B 133 ± 15 100 ± 2
C 82 ± 17 122 ± 11
D 230 ± 20 190 ± 10
E 151 ± 12 158 ± 9
M 55 ± 7 –
N – 102 ± 8
O – 82 ± 8
P – 73 ± 10
X 70 ± 17 –
Y 88 ± 13 –
Z 85 ± 11 –
Average 106 119
Standard Deviation 56 41
Coefficient of Variation (%) 53 34
Results are expressed as mg.L-1 ± SD. Missed results are due to the absence of sample
ALÉN-RUIZ, F. et al. Influence of major polyphenols on antioxidant
activity in Mencía and Brancellao red wines. Food Chemistry,
v. 113, n. 1, p. 53-60, 2009.
ARNOUS, A. et al. Correlation of pigment and flavanol content wine antioxidant properties in selected aged regional wines from Greece.
Journal of Food Composition and Analysis, v. 15, p. 655-665, 2002. http://dx.doi.org/10.1006/jfca.2002.1070
ARSEGO, J. L. Composição polifenólica de vinhos Bordô, Isabel,
Seyve Villard e Niágara branca produzidos no Alto Vale do Rio do Peixe - SC. 2004. 88 f. Dissertação (Mestrado em Recursos Genéticos Vegetais)-Universidade Federal de Santa Catarina, Florianópolis, 2004.
ARTS, M. J. T. J. et al. Antioxidant capacity of reactrion products limits the applicabiliy of the Trolox Equivalent Antioxidant Capacity
(TEAC) assay. Food and Chemical Toxicology, v. 42, p. 45-49,
2004. http://dx.doi.org/10.1016/j.fct.2003.08.004
BARNABÉ, D. et al. Análise Descritiva Quantitativa de Vinhos
Produzidos com Uvas Niágara Rosada e Bordô. Brazilian Journal
of Food Technology, v. 10, n. 2, p. 122-129, 2007.
BRAND-WILLIAMS, W. et al. Use of free radical method to evaluate antioxidant activity. Lebensmittel-Wissenschaft und Technologie - LWT, v. 28, p. 25-30, 1995.
BRASIL. Portaria nº 229, de 25 de outubro de 1988. Normas referentes à “Complementação dos padrões de identidade e qualidade do
4 Conclusions
Total phenolic compounds values in the wine samples ranged from 1582.35 to 2896.08 mg gallic acid.L-1, and were
composed mostly of flavonoid compounds. Within the studied concentration range, no direct relationship between phenolic compounds and antioxidant activity was observed. Chlorogenic and caffeic acids were the major phenolic compounds found in the wine samples. Three principal components were capable of explaining 81.36% of the total variance. Among the studied parameters, emphasis is given to the influence of tannin content to differentiate the analyzed samples.
Acknowledgements
The authors thank professors Dr. Patrício Guillermo Peralta Zamora and Dr. Noemi Nagata for their suggestions on the manuscript and are grateful to the financial support provided by CAPES.
References
ABE, L. T. et al. Compostos fenólicos e capacidade antioxidante de cultivares de uvas Vitis labrusca L. e Vitis vinifera L. Ciência e Tecnologia de Alimentos, v. 27, n. 2, p. 394-400, 2007.
and Nutrition, v. 43, n. 3, p. 233-244, 2003. http://dx.doi. org/10.1080/727072831
MARASCHIN, R. P. et al. Solid-phase extraction and 1H-NMR analysis of brazilian Cabernet Sauvignon wines - A chemical
composition correlation study. Proceedings of the Royal Society
A: Mathematical, Physical and Engineering Sciences, v. 1, n. 1,
p. 255-260, 2003.
MINUSSI, R. C. et al. Phenolic compounds and total antioxidant potential of commercial wines. Food Chemistry, v. 82, p. 409-416, 2003. http://dx.doi.org/10.1016/S0308-8146(02)00590-3
MONAGAS, M. et al. Monomeric, oligomeric and polymeric flavan-3-ol composition of wines and grapes from Vitis vinifera L. Cv.
Graciano, Tempranillo, and Cabernet Sauvignon. Journal of
Agricultural and Food Chemistry, v. 51, p. 6475-6481, 2003. http:// dx.doi.org/10.1021/jf030325+
NIKFARDJAM, M. S. P. et al. Polyphenols, anthocyanins, and trans-resveratrol in red wines from the Hungarian Villány region. Food Chemistry, v. 98, n. 3, p. 453-462, 2006. http://dx.doi.org/10.1016/j. foodchem.2005.06.014
OUGH, C. S.; AMERINE, M. A. Methods for analysis of must and
wines. 2th ed. New York: John Wiley & Sons, 1988.
PÉREZ-SERRADILLA, J. A.; CASTRO, M. D. L. D. Role of lees in wine production: a review. Food Chemistry, v. 111, p. 447-456, 2008. RASTIJA, V. et al. Polyphenolic composition of Croatian wines with
different geographical origins. Food Chemistry, v. 115, n. 1,
p. 54-60, 2009. http://dx.doi.org/10.1016/j.foodchem.2008.11.071 RIZZON, L. A. et al. Avaliação da uva cv. Isabel para a elaboração
de vinho tinto. Ciência e Tecnologia de Alimentos, v. 20, n.1,
p. 115-121, 2000.
RODRÍGUEZ-DELGADO, M-Á. et al. Principal component analysis
of the polyphenol content in young red wines. Food Chemistry,
v. 78, n. 4, p. 523-532, 2002.
SINGLETON, U. L.; ROSSI, J. Colorimetry of total phenolic with
phosphomolybdic-phosphotungustic acid reagent. American
Journal of Enology and Viticulture, v. 16, p. 144, 1965.
TECCHIO, F. M.; MIELE, A.; RIZZON, L. A. Composição físico-química do vinho Bordô de Flores da Cunha, RS, elaborado com uvas maturadas em condições de baixa precipitação. Ciência Rural, v. 37, n. 5, p. 1480-1483, 2007. http://dx.doi.org/10.1590/S0103-84782007000500044
VALDÉS, H. L. et al. Método analítico para la cuantificación de taninos en el extracto acuoso de romerillo. Revista Cubana Plantas Medicinales, v. 5, n. 1, p. 17-22, 2000.
WORARATPHOKA, J. et al. Phenolic compunds and antioxidative properties of selected wines from the northeast of Thailand. Food Chemistry, v. 104, p. 1485-1490, 2007. http://dx.doi.org/10.1016/j. foodchem.2007.02.020
vinho”. Diário Oficial da República Federativa do Brasil, Brasília, DF, maio 1988.
BRASIL. Instrução Normativa nº 24, de 08 de setembro de 2005.
Manual operacional de bebidas e vinagres. Diário Oficial da
República Federativa do Brasil, Brasília, DF, 20 set. 2005. CASTILLO-SANCHEZ, J. X. et al. Phenolic compounds and colour
stability of Vinhão wines: influence of wine-making protocol and fining agents. Food Chemistry, v. 106, p. 18-26, 2008. http://dx.doi. org/10.1016/j.foodchem.2007.04.069
COZZOLINO, D. et al. Mid infrared spectroscopy and multivariate analysis: A tool to discriminate between organic and non-organic wines grown in Australia. Food Chemistry, v. 116, p. 761-765, 2009. http://dx.doi.org/10.1016/j.foodchem.2009.03.022
DI MAJO, D. et al. The antioxidant capacity of red wine in relationship with its polyphenolic constituents. Food Chemistry, v. 111, n. 1, p. 45-49, 2008. http://dx.doi.org/10.1016/j.foodchem.2008.03.037
EMBRAPA. Cultivares. Sistema de Produção, n. 9, 2005. Disponível
em: <http://sistemasdeproducao.cnptia.embrapa.br/FontesHTML/ Uva/UvasRusticasParaProcessamento/cultivares.htm>. Acesso em: out. 2007.
FERNÁNDEZ-PACHÓN, M. S. et al. Anioxidant activity of wines and
relation with their polihenolic composition. Analytica Chimica
Acta, v. 513, p. 113-118, 2004.
GAMBELLI, L.; SANTARONI, G. P. Polyphenols content in some Italian red wines of different geographical origins. Journal of Food Composition and Analysis, v. 17, n. 5, p. 613-618, 2004. http:// dx.doi.org/10.1016/j.jfca.2003.09.010
GHISELLI, A. et al. Antioxidant activity of different phenolic fractions separated from an Italian red wine. Journal of Agricultural and Food Chemistry, v. 46, n. 2, p. 361-367, 1998. http://dx.doi. org/10.1021/jf970486b
KALLITHRAKA, S. et al. Principal phenolic compounds in Greek red wine. Food Chemistry, v. 99, p. 784-793, 2006. http://dx.doi. org/10.1016/j.foodchem.2005.07.059
KATALINIC, V. et al. Antioxidant effectiveness of selected wines in comparison with (+)-catechin. Food Chemistry, v. 86, p. 593-600, 2004. http://dx.doi.org/10.1016/j.foodchem.2003.10.007
KIRALP, S.; TOPPARE, L. Polyphenol content in selected Turkish wines, an alternative method of detection of phenolics. Process Biochemistry, v. 41, n. 1, p. 236-239, 2006.
LANTE, A. et al. Chemical parameters, biologically active polyphenols and sensory caracteristics of some Italian organic wines. Journal of Wine Research, v. 15, p. 203-209, 2004. http://dx.doi. org/10.1080/09571260500142054
LOPEZ-VELEZ, M. et al. The study of phenolic compounds as