Original
Received 25/2/2010 Accepted 20/7/2010 (004678)
1 Laboratório de Química de Alimentos, Departamento de Ciência e Tecnologia de Alimentos, Centro de Ciências Agrárias, Universidade Federal de Santa Catarina – UFSC, Rod. Admar Gonzaga, 1346, Itacorubi, CEP 88034-001, Florianópolis, SC, Brasil, e-mail: eliquimica2007@gmail.com
2 Instituto de Ciência e Tecnologia de Alimentos, Universidade Federal do Rio Grande do Sul – UFRGS, Av. Bento Gonçalves, 9500, Agronomia, CEP 91501-970, Porto Alegre, RS, Brasil * Corresponding author
Phenolic compounds and antioxidant activity of blueberry cultivars grown in Brazil
Compostos fenólicos e atividade antioxidante de cultivares de mirtilo produzidas no Brasil
Eliseu RODRIGUES1*, Naira POERNER2, Ismael Ivan ROCKENBACH1, Luciano Valdemir GONZAGA1, Camila Ribas MENDES1, Roseane FETT1
Resumo
O objetivo deste trabalho foi avaliar a concentração de compostos fenólicos totais, antocianinas monoméricas totais e a atividade antioxidante
in vitro das principais cultivares de mirtilo (Vaccinium sp.) produzidas no Brasil. O método Folin-Ciocalteau foi aplicado para quantificar
os compostos fenólicos totais e os métodos ABTS, DPPH, FRAPe β-caroteno/ácido linoleico para avaliar a atividade antioxidante. O teor
de compostos fenólicos totais encontrado variou de 274,48 a 694,60 mg de equivalente a ácido gálico (EAG).100 g-1 em peso fresco (PF). A
concentração de antocianinas monoméricas variou da cultivar Bluecrop até a Tifblue, com valores de, respectivamente, 40,62 a 378,31 mg.100 g-1
PF. A atividade antioxidante medida pelos métodos ABTS, DPPH e FRAP mostrou grande amplitude entre as cultivares estudadas, com valores
variando de, respectivamente, 1238,48 a 2445,96, 1014,24 a 2055,06 e 699,78 a 1740,25 μmol TEAC.100 g-1 PF. Os resultados confirmam o mirtilo
como fonte de compostos fenólicos com elevada atividade antioxidante. Demonstram ainda que existem diferentes níveis de concentrações de compostos fenólicos e atividade antioxidante de acordo com a cultivar e o local de produção desta fruta.
Palavras-chave: mirtilo; cultivares; atividade antioxidante; compostos fenólicos.
Abstract
The aim of this study was to evaluate the content of the phenolic compounds and anthocyanins and the antioxidant activity of blueberry (Vaccinium sp.) cultivars grown in Brazil. The Folin-Ciocalteau method was applied in order to quantify the phenolic compounds and ABTS, DPPH, FRAP, and β-carotene/linoleic acid methods were applied in order to evaluated antioxidant activity. The phenolic compounds content
ranged from 274.48 to 694.60 mg GAE.100 g–1 of fresh weight (FW). Anthocyanins content ranged from 40.62 to 378.31 mg.100 g–1 FW
for Bluecrop and Tifblue cultivars, respectively. Antioxidant activities assessed by ABTS, DPPH and FRAP methods presented significant
differences among the studied cultivars ranging from 1238.48 to 2445.96, 1014.24 to 2055.06 and 699.78 to 1740.25 µmol TEAC.100 g–1 FW,
respectively. The results confirm the blueberry as a source of phenolic compounds with high antioxidant activity and also show that there are different levels of concentrations of phenolic compounds and antioxidant activity according to the cultivar and production location.
Keywords: blueberry; cultivars; antioxidant activity; phenolic compounds.
1 Introduction
Free radicals and other reactive species can cause oxidation and biomolecular damage when the oxidative species exceed the anti-oxidative defenses of the organism resulting in oxidative stress. This is associated to aging and to the development of pathologies such as cancer, cardiovascular disease, neurodegenerative disorders, diabetes, and inflammation (DUFFY et al., 2007; MATEOS; BRAVO, 2007; LU; FINKEL, 2008). However, evidence has shown the relationship between a diet rich in fruit and vegetables and a decrease of cardiovascular disease and certain types of cancer, which, hypothetically, is due to the antioxidant contents (GERMAN; WALZEM, 2000; KAUR; KAPOOR, 2001; YANG et al., 2001; GARCIA-ALONSO et al., 2004). This relationship has stimulated research on the antioxidant capacity of fruit and vegetables.
Among the compounds with antioxidant properties found in fruits and vegetables, phenol compounds stand out. They
was stored in an amber flask. This extract was used to determine the total phenolic compounds (TP) and for the antioxidant activity (AA) analysis.
Samples of ground blueberry (1.500 g) were extracted with acidified (HCl 0.1%) methanol (15 mL × 3) in an ultrasonic water bath (USC-1400 Unique) for 30 minutes at room temperature (20 °C). The extract was centrifuged at 2000 g for 10 minutes, and the supernatant was used to assess the total anthocyanin contents (TA).
2.4 Determination of total phenolic compounds (TP)
The total phenolic content of each extract was determined spectrophotometrically (Hewlett-Packard 8452 A Spectrophotometer) according to the Folin-Ciocalteau method (SINGLETON; ROSSI, 1965). Absorbance was read at 765 nm and results were expressed, in fresh weight, as mg.100 g–1 gallic acid equivalent (GAE).
2.5 Determination of total anthocyanins (TA)
Total anthocyanins content was determined by the pH-differential method (GIUSTI; WROLSTAD, 2001). Absorbance was read at 700 nm and at the wavelength of maximum absorption. Results, in fresh weight, were expressed as the concentration of anthocyanins in mg.100 g–1 cyanidin-3-glucoside equivalent (ε = 26900, MW = 449.2).
2.6 Antioxidant activity
ABTS method
The ABTS method (2,2’-azino-bis(3-ethylbenzthiazoline-6-sulphonic acid) is based on the deactivation of the antioxidant radical cation ABTS•+, which is measured by the decrease in absorbance at 734 nm. The ABTS method was performed as described by Re et al. (1999). Absorbance was read at 734 nm, 7 minutes after the extract addition. The total antioxidant activity of the blueberry, in fresh weight, was expressed in µMol.100 g-1 of TEAC (Trolox-equivalent antioxidant capacity).
DPPH method
2.2-diphenyl-1-picrylhydrazyl (DPPH•) radical is one of the few stable and commercially available organic nitrogen compounds. The method is based on the deactivation of the DPPH• radical by compounds with antioxidant properties present in fruit extracts, and this deactivation is monitored at 515 nm. The DPPH method was carried out as described by Kim et al. (2002). The decrease in the absorbance of 100 µM DPPH• radical (2.9 mL) dissolved in 80% methanol was evaluated at 515 nm, 30 minutes after the addition of each extract. The total antioxidant activity of blueberry, in fresh weight, was also expressed in µMol.100 g–1 of TEAC.
FRAP method
As described by Benzie and Strain (1996), with modifications by Arnous, Makris and Kefalas (2002), the FRAP method Blueberry production is concentrated mainly in the United
States and Canada, and the former is responsible for 66% and the latter for 33% of world production (STRIK, 2005). Brazil has recently become a blueberry producer with a small production concentrated in the south and southeastern regions of the country, in the municipalities of Vacaria and Caxias do Sul (Rio Grande do Sul, RS), Barbacena (Minas Gerais, MG), and Campos do Jordão (São Paulo, SP) (SANTOS, 2004). Considering the lack of information on the phenolic compounds content and antioxidant activity of the blueberries produced in Brazil, the objective of this study was to assess the phenolic compounds content, anthocyanins content, and in vitro antioxidant activity of the main blueberry (Vaccinium sp.) cultivars grown in Brazil using the ABTS, DPPH, FRAP and β-carotene/linoleic acid methods.
2 Materials and methods
2.1 Chemicals
2,2’-azino-bis(3-ethylbenzthiazoline-6-sulphonic acid) (ABTS), 2,2-diphenyl-1-picrylhydrazyl (DPPH), β-carotene, linoleic acid, BHT (2,6-di-tert-butyl-4-methylphenol), Trolox (6-hydroxy-2,5,7,8-tetramethylchroman-2-carboxylic acid), and gallic acid were purchased from Sigma-Aldrich Chemie (Steinheim, Germany). Folin-Ciocalteau reagent, 2,4,6-Tris(2-pyridyl)-1,3,5-triazine (TPTZ), and Tween 40 were purchased from Fluka Chemie AG (Buchs, Switzerland). Methanol, chloroform, ferric chloride, sodium carbonate, chloridric, acid and potassium persulphate were purchased from Vetec (São Paulo, Brazil).
2.2 Samples
The blueberry samples were collected directly from the producers (2008 harvest) in Rio Grande do Sul state - RS (southern region), in the municipalities of Pelotas (31° 45’ S, 52° 22’ W), Caxias do Sul (31° 45’ S, 52° 20’ W), and Vacaria (28° 29’ S, 50° 57’ W); in São Paulo state - SP (southeastern region), municipality of Campos do Jordão (22° 44’ S, 45° 35’ W); and Minas Gerais state - MG (southeastern region), municipality of Barbacena (21° 18’ S, 43° 48’ W). The following cultivars were used: Bluecrop (Vaccinium corymbosum); Delite, woodard, clímax, bluegem, flórida M, powderblue, briteblue, bluebelle, and Tifblue (Vaccinium ashei Reade). The samples were collected randomly resulting in 3 (three) samples of 500 g for each cultivar. The samples were transported to the laboratory at 5.0 ± 1.0 °C, where they were separated into plastic packages of 100 g portions. These packages were de-oxygenized with nitrogen for five minutes, frozen, and stored at –18.0 ± 0.5 °C until analysis. Special care was taken while selecting to avoid damaged, unripe, or very ripe fruits.
2.3 Preparation of extracts
FW, for the Brightblue cultivar. The same authors reported a minimum concentration of 261.95 mg.100 g–1 FW, a value close to that found for the Bluecrop cultivar in the present study, 274.48 mg.100 g–1 FW. This concentration was higher than that reported by Prior et al. (1998), which was 189.90 mg.100 g–1 FW, for the Bluecrop cultivar produced in North Carolina (USA), but which was lower than those reported by Kalt et al. (1999), 386.17 mg.100 g–1 FW, and Giovanelli and Buratti (2009), 299.00 mg.100 g–1 FW, assessing the same cultivar produced in Canada and Italy, respectively.
Samples of the Powderblue, Clímax, Bluebelle, and Bluegem cultivars collected in different production locations in Brazil (Table 1) showed significant difference (p < 0.05) for TP concentration. These results confirmed the effect of the production location on the phenolic compounds concentration. Similarly, Connor, Luby and Tong (2002) observed a significant influence (p < 0.05) in two harvests of the cultivation location on the TP content present in 16 blueberry cultivars.
Table 1 shows that, in general, the cultivars representative of the Vaccinium ashei Reade species presented greater richness in phenolic compounds than the Bluecrop cultivar, the only representatives of the Vaccinium corymbosum species assessed. This greater richness in phenolic compounds was also observed in other studies that assessed cultivars representing the two species (PRIOR et al., 1998; MOYER et al., 2002).
Table 1 shows the TA content in the blueberry cultivars. The concentration of Bluecrop and Tifblue cultivars ranged from 40.62 to 378.31 mg.100 g–1 FW, respectively. There was is based on the direct measurement of the antioxidant
(reducing) ability through the reduction of the complex Fe3+/ tripyridyltriazine (TPTZ) to Fe2+ at acidic pH (3.6). Absorbance was read at 620 nm and the reducing power, in fresh weight, was expressed in µMol.100 g–1 of TEAC.
Co-oxidation of β-carotene/linoleic acid method
Oxidation inhibition power was evaluated by the discoloration of the β-carotene/linoleic acid system as described by Marco (1968) and modified by Miller (1971). A 20 µL aliquot of β-carotene solution (20 mg.mL–1 in chloroform) was placed in a 250 mL erlenmeyer flask with 40 µL of linoleic acid, 1 mL chloroform, and 20 mg of Tween 40. After homogenization, the chloroform was completely evaporated with nitrogen. Deionised water (previously submitted to oxygen atmosphere for 30 minutes) was then added until formation of a clear emulsion with absorbance ranging from 0.6 to 0.7 at 470 nm. Aliquots of the extracts (100 µL) and 100 mg.L–1 of BHT were added to 5 mL of linoleic acid emulsion in glass cuvettes (optical path of 10 mm). After the initial reading, the absorbance was monitored every 15 minutes for 2 hours. During this period, the cuvettes were kept at 50 °C in a water bath. The decrease in absorbance was compared to the control (without antioxidant). The antioxidant activity was expressed as percent inhibition, in relation to the control, according to the following Equation 1:
inhibition % = 100 - - 100
-i f
i f
A A
C C
×
(1)
Ai = extract initial absorbance
Af = extract final absorbance
Ci = control initial absorbance
Cf = control final absorbance
2.7 Statistical analysis
The descriptive analyses, linear regression (R2), linear correlation (R), analysis of variance (ANOVA), and the Tukey test were performed using Statistica® software (2004), 7.0 version. The data are presented as mean ± standard deviation (SD). Three samples (n = 3) of each cultivar were analyzed, and all assays were performed in triplicate. Differences at p < 0.05 were considered significant.
3 Results and discussion
3.1 Total phenolic compounds (TP) and total anthocyanins (TA)
Table 1 shows the phenolic compounds concentration in the blueberry cultivars studied. The phenolic compounds concentration ranged from 274.48 to 694.60 mg GAE.100 g–1 FW. The Clímax, cultivar, from Barbacena (MG), presented the highest TP concentration. Sellappan, Akoh and Krewer (2002) studied different blueberry cultivars in the state of Georgia (USA) and reported a maximum TP concentration 34% higher than that found in this study, 929.62 mg.100 g–1
Table 1. Total phenolic compounds (TP) and total anthocyanins (TA)
of blueberry cultivars (Vaccinium sp.) grown in Brazil.
Cultivar tp
(mg.100 g–1)1
ta (mg.100 g–1)2
TA/TP
Vaccinium corymbosum L.
Bluecropb 274.48 ± 15.83g 40.62 ± 3.17g 0.15
Vaccinium ashei Reade
Delited 418.67 ± 5.63d 231.47 ± 5.92c 0.55 Powderbluea 675.57 ± 10.25a 245.48 ± 19.71c 0.36 Bluegema 336.57 ± 1.92f 265.99 ± 23.95b 0.79 Clímaxa 288.03 ± 8.10g 240.50 ± 37.51c 0.83 Flórida Ma 332.96 ± 24.67f 278.76 ± 19.92b 0.84 Woodarda 378.55 ± 26.91e 254.89 ± 18.39b 0.67 Bluebelled 339.39 ± 18.28f 238.85 ± 15.56c 0.70 Powderbluec 436.69 ± 13.91d 220.29 ± 18.19d 0.50 Britebluec 482.64 ± 14.36c 258.17 ± 30.38b 0.53 Flórida Mc 340.41 ± 6.98f 69.97 ± 4.82f 0.21 Bluebellec 557.33 ± 18.58b 162.85 ± 14.56e 0.29 Bluegemc 542.45 ± 21.36b 186.66 ± 9.61e 0.34 Clímaxe 694.60 ± 47.39a 234.08 ± 19.69c 0.34 Tifbluee 450.62 ± 6.63d 378.31 ± 16.23a 0.84
Mean ± SD 436.60 ± 131.82 220.46 ± 81.99 0.54
Values are expressed in fresh weight of blueberry and as mean ± standard deviation (SD), n = 3. Different letters in the same column indicate significant difference (p < 0.05).
1Expressed as GAE (gallic acid equivalent). 2Expressed as equivalent to
cyanidin-3-glucoside. aCaxias do Sul (RS), bVacaria (RS), cPelotas (RS), dCampos do Jordão (SP),
no great variability in the TA content among the cultivars studied, except for the Flórida M (Pelotas, RS) and Bluecrop cultivars that presented a much lower concentration and the Tifblue cultivar that presented a much higher concentration than the others. The TA values detected for the blueberries (Vaccinium sp.) produced in Brazil were greater than those reported by Sellappan, Akoh and Krewer (2002) for blueberry cultivars (Vaccinium corymbosum and Vaccinium ashei Reade) and blackberry cultivars (Rubus L.) produced in Georgia (USA).
The Flórida M, Bluegem, Powderblue, and Bluebelle cultivars, grown in different locations, presented significant difference (p < 0.05) in TA concentration. The Flórida M cultivar from Caxias do Sul (RS) was stood out because it had a concentration approximately 4 times greater than that presented by the same cultivar produced in Pelotas (RS).
Table 1 shows the TA/TP ratio as an estimate of the representativeness of the TA in relation to the phenolic compound concentration present in the fruit. As can be observed, on average, the anthocyanins represented 54% of the TP concentration present in the cultivars assessed. Thus, data found in the present study corroborated the results obtained by other authors (MOYER et al., 2002; TARUSCIO; BARNEY; EXON, 2004; GIOVANELLI; BURATTI, 2009), who reported the anthocyanins as accounting for a large proportion of the phenolic compounds present in blueberries. These flavonoids are responsible for a large part of the AA presented by blueberries, as shown in the study of Zheng and Wang (2003), in which the anthocyanins represented 55.4% of the TP and contributed to 56.3% of the antioxidant activity presented by the fruit.
The blueberries (Vaccinium sp.) produced in Brazil, in spite of the differences observed among cultivars, are rich in phenolic compounds. This statement was confirmed by the higher concentration of TP compared to other fruits such as apple, avocado, plum, raspberry, strawberry, banana, blackberry, grape, cherry, mango, lemon, orange, nectarine, peach, pear, and pineapple (WU et al., 2004; WOLFE et al., 2008).
3.2 Antioxidant activity (AA) – ABTS, DPPH, and FRAP methods
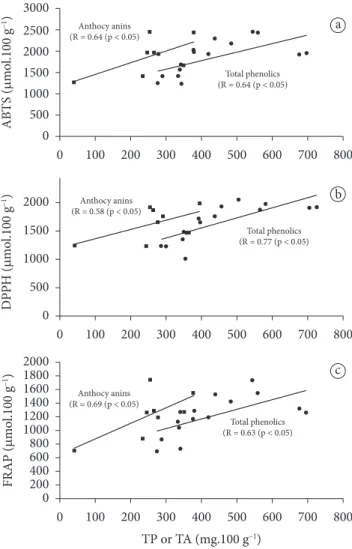
Table 2 presents the results of AA assessment in the blueberry cultivars using the ABTS, DPPH, and FRAP methods. These methods presented high positive correlation (p < 0.05) of ABTS/FRAP (R = 0.94), DPPH/FRAP (R = 0.86), and ABTS/ DPPH (R = 0.92). This means that the analytical methods used presented a very similar response and can be used without distinction to quantify AA in this fruit.
Moderate correlation (p < 0.05) was detected between the mean AA by the ABTS, DPPH, and FRAP methods and the TP and TA concentration in the cultivars studied (Figure 1). This moderate correlation may be the result of the presence of compounds that present AA but are not phenolic compounds or the presence of phenolic compounds with greater efficiency than others (LIEN et al., 1999; NATELLA et al., 1999; GIOVANELLI; BURATTI, 2009). Furthermore, this may be the result of antagonistic or synergistic effects among the phenolic compounds present in the matrix. Thus the TP concentration
Figure 1. Correlation between total phenolic compounds (TP), total anthocyanins (TA), and antioxidant activity (ABTS, DPPH, and FRAP)
of blueberry cultivars (Vaccinium sp.) grown in Brazil.
a
b
c
Table 2. Antioxidant activity (ABTS, DPPH, and FRAP) of blueberry cultivars (Vaccinium sp.) grown in Brazil.
Cultivar ABTS 1 (µmol.100 g–1)
DPPH 1 (µmol.100 g–1)
FRAP 1 (µmol.100 g–1)
Vaccinium corymbosum L.
Bluecropb 1253.90 ± 87.55g 1244.13 ± 12.49f 699.78 ± 16.47e
Vaccinium ashei Reade
Delited 1931.90 ± 60.30c 1756.11 ± 60.11b 1194.15 ± 30.67d Powderbluea 1929.20 ± 150.15c 1907.97 ± 154.77a 1318.41 ± 2.16c Bluegema 1571.69 ± 35.10e 1473.58 ± 31.71d 1044.20 ± 37.62d Clímaxa 1419.66 ± 27.70f 1227.88 ± 15. 53f 868.36 ± 10.09e Flórida Ma 1420.42 ± 84.63f 1348.76 ± 144.05e 1126.72 ± 82.68d Woodarda 1975.60 ± 109.73c 1653.50 ± 94.22c 1285.94 ± 42.93c Bluebelled 1678.12 ± 94.27d 1478.40 ± 128.47d 1271.48 ± 106.67c Powderbluec 2293.20 ± 150.46ab 1935.84 ± 47.91a 1530.77 ± 149.59b Britebluec 2185.00 ± 97.93b 2055.06 ± 134.12a 1429.67 ± 42.61b Flórida Mc 1238.50 ± 48.45g 1014.20 ± 81.56g 732.79 ± 40.63e Bluebellec 2438.90 ± 133.90a 1983.00 ± 121.40a 1544.64 ± 126.38b Bluegemc 2445.96 ± 227.75a 1873.19 ± 55.8b 1740.25 ± 161.66a Clímaxe 1951.61 ± 22.11c 1917.02 ± 61.91a 1262.03 ± 22.20c Tifbluee 2028.80 ± 128.01c 1727.95 ± 69.12b 1163.95 ± 35.62d
Mean ± SD 1850.83 ± 404.23 1639.77 ± 322.78 1214.20 ± 293,94
Values are expressed in fresh weight of blueberry and as mean ± standard deviation (SD), n = 3. Different letters in the same column indicate significant difference (p < 0.05).
1Expressed as TEAC (Trolox equivalent antioxidant capacity). aCaxias do Sul. bVacaria.
1740.25 µmol TEAC.100 g–1 FW, respectively. The Briteblue, Powderblue, Clímax and Bluebelle cultivars (Pelotas, RS) and the Clímax cultivar (Barbacena, MG) presented the highest AA values by the DPPH method, and they did not differ significantly (p < 0.05). The Bluegem cultivar (Pelotas, RS) presented the highest AA by the FRAP method. Therefore, like in the ABTS method, some cultivars produced in different locations in Brazil presented significant difference (p < 0.05).
As shown in Table 2, similarly to TP and TA, the cultivars representative of the Vaccinium ashei Reade species presented higher AA than that of the representatives of the Vaccinium corymbosum species, the Bluecrop cultivar. Moyer et al. (2002) assessed the Bluegem cultivar as the only representative of the Vaccinium ashei Reade species and reported AA values approximately twice as great as those found in the samples (n = 7) of the Vaccinium corymbosum species. Prior et al. (1998) detected AA equivalent to the representative cultivars of the two species.
In general, the AA values in this study were similar to those presented by other authors for blueberry (Vaccinium sp.) cultivars and species produced in Spain(GARCIA-ALONSO et al., 2004), and they were slightly lower than those from Italy (GIOVANELLI; BURATTI, 2009) and the USA (MOYER et al., 2002; SELLAPPAN; AKOH; KREWER, 2002; TARUSCIO; BARNEY; EXON, 2004).
3.3 Antioxidant activity (AA) – β-carotene/linoleic acid method
Figure 2 shows the AA of the blueberry cultivars in the β-carotene/linoleic acid method. All cultivars presented much lower AA than that presented by BHT, which was used as alone does not permit a precise indication of the blueberry AA.
Similarly, Srivastava et al. (2007) found a moderate correlation between the TP and TA concentration and the AA presented by blueberries. At the same time, these data do not agree with the studies by Prior et al. (1998), Kalt et al.(1999), Moyer et al. (2002), Taruscio, Barney and Exon (2004) and Giovanelli and Buratti (2009) who reported high positive correlation between TP and TA and the AA presented by blueberries.
The AA measured by applying the ABTS method showed great amplitude among the blueberry cultivars studied, with variation of 1238.48 to 2445.96 µmol TEAC.100 g–1 FW, respectively, presented for the Flórida M and Bluebelle cultivars, both from Pelotas (RS). Sellappan, Akoh and Krewer (2002) assessed AA using the same analytical method and reported even wider amplitude with values ranging from 811 to 3829 µmol TEAC.100 g–1 FW for the blueberry. These wide amplitudes were also observed by Prior et al. (1998) and Moyer et al. (2002) who assessed AA by the ORAC (oxygen radical absorbance capacity) method. The AA measured by the ABTS method for the Powderblue, Clímax, Bluegem, Flórida M and Bluebelle cultivars, produced in two different locations, presented significant difference (p < 0.05). Therefore, similarly to the TP content, the differences observed in these values confirmed the effect of production location on AA and were in agreement with the studies conducted by Connor, Luby and Tong (2002) that assessed 16 blueberry cultivars in three regions in the USA (Michigan, Minnesota and Oregon).
The AA assessment by the DPPH and FRAP methods also presented great amplitude among the cultivars studied with values ranging from 1014.20 to 2055.06 and 699.78 to
Figure 2. Oxidation inhibition (%) of blueberry cultivars (Vaccinium sp.) and BHT at 100 mg.L–1 in β-carotene/linoleic acid system. Values are
expressed in fresh weight of blueberry and as mean ± standard deviation (SD), n = 3. aCaxias do Sul, bVacaria, cPelotas, dCampos do Jordao,
BENZIE, I. F. F.; STRAIN, J. J. The ferric reducing ability of plasma (FRAP) as a measure of antioxidant power: The FRAP assay.
Analytical Biochemistry,v. 239, p. 70-76, 1996. PMid:8660627. http://dx.doi.org/10.1006/abio.1996.0292
CONNOR, A. M.; LUBY, J. J.; TONG, C. B. S. Genotype and environmental variation in antioxidant activity, total phenolic content, and anthocyanin content among blueberry cultivars.
Journal of the American Society for Horticultural Science, v.127, p. 89-97, 2002.
DUARTE-ALMEIDA, J. M. et al. avaliação da atividade antioxidante utilizando sistema β-caroteno/ácido linoléico e método de seqüestro de radicais DPPH•. Ciência e Tecnologia de Alimentos, v. 26, p. 446-452, 2006. http://dx.doi.org/10.1590/S0101-20612006000200031 DUFFY, K. B. et al. A blueberry-enriched diet provides cellular
protection against oxidative stress and reduces a kainate-induced
learning impairment in rats. Neurobiology of Aging, v. 29,
p. 1680-1689, 2007. PMid:17524525. http://dx.doi.org/10.1016/j. neurobiolaging.2007.04.002
DUTHIE, G.; CROZIER, A. plant-derived phenolic antioxidants.
Current Opinion in Lipidology, v. 3, p. 447-451, 2000.
GARCÍA-ALONSO, M. et al. evaluation of the antioxidant properties of fruits. Food Chemistry, v. 84, p. 13-18, 2004. http://dx.doi. org/10.1016/S0308-8146(03)00160-2
GERMAN, J. B.; WALZEM, R. L. the health benefits of wine. Annual
Review of Nutrition, v. 20, p. 561-593, 2000.
GIOVANELLI, G.; BURATTI, S. Comparison of polyphenolic composition and antioxidant activity of wild Italian blueberries and some cultivated varieties. Food Chemistry, v. 112, p. 903-908, 2009. http://dx.doi.org/10.1016/j.foodchem.2008.06.066
GIUSTI, M. M.; WROLSTAD, R. E. Characterization and measurement of anthocyanins by UV-visible spectroscopy. In: WROLSTAD, R. E. Current Protocols in Food Analytical Chemistry. New York: John Wiley & Sons, 2001. unit F1.3, p. 1-13.
KALT, W. et al. Antioxidant capacity, vitamin C, phenolics, and
anthocyanins after fresh storage of small fruits. Journal of
Agricultural and Food Chemistry, v. 47, p. 4638-4644, 1999. PMid:10552863. http://dx.doi.org/10.1021/jf990266t
KAUR, C.; KAPOOR, H. C. Antioxidants in fruits and vegetables -
the millennium’s health. International Journal of Food Science
& Technology,v. 36, p. 703-725, 2001. http://dx.doi.org/10.1046/ j.1365-2621.2001.00513.x
KIM, D. O. et al. Vitamin C equivalent antioxidant capacity ( VC E AC ) of p h e n o l i c p hy t o c h e m i c a l s . Jo u r n a l o f Agricultural and Food Chemistry, v. 50, p. 3713-3717, 2002. PMid:12059148. http://dx.doi.org/10.1021/jf020071c LIEN, E. J. et al. quantitative structure-activity relationship analysis of phenolics antioxidants. Free Radical Biology & Medicine, v. 26, p. 285-294, 1999. http://dx.doi.org/10.1016/S0891-5849(98)00190-7
LU, T.; FINKEL, T. Free radicals and senescence. Experimental
Cell Research, v. 314, p. 1918-1922, 2008. PMid:18282568. PMCid:2486428. http://dx.doi.org/10.1016/j.yexcr.2008.01.011
MARCO, G. J. A rapid method for evaluation of antioxidants. Journal
of the American Oil Chemists Society, v. 45, p. 594-598, 1968. MATEOS, R.; BRAVO, L. Chromatographic and electrophoretic
methods for the analysis of biomarkers of oxidative damage to
macromolecules (DNA, lipids, and proteins). Journal of the Serbian
Chemical Society, v. 30, p. 175-191, 2007.
MELO, E. A. et al. Capacidade antioxidante de frutas. Revista
Brasileira de Ciências Farmacêuticas, v. 44, p. 193-201, 2008. http://dx.doi.org/10.1590/S1516-93322008000200005
positive control. The Bluecrop cultivar, representative of the Vaccinium corymbosum species, presented the greatest AA in this emulsified system with a value of 19.49% oxidation inhibition. It was followed by the Flórida M and Bluebelle cultivars, both from Pelotas (RS), with values of 18.32 and 18.96% oxidation inhibition, respectively. These two cultivars were not significantly different (p > 0.05). The AA values were similar to those reported by Melo et al. (2008) for pineapple, cashew, tangerine, orange, pear, papaya, Hawaian papaya, mango, watermelon, and melon and were lower than those of guava and pine seeds. In the same study, the fruits were classified as possessing moderate and weak antioxidant activity when they presented oxidation inhibition greater or lower than 50%, respectively. Considering this criterion, all blueberry cultivars presented low antioxidant activity in this emulsified system, similarly to the majority of the fruits mentioned above.
The AA presented by the blueberry extracts in the β-carotene/linoleic acid method was quite different from that measured by the ABTS, DPPH, and FRAP methods. In these three methods, the Bluecrop cultivar was shown as one of the cultivars with smallest AA, but also as the cultivar that presented the greatest capacity to inhibit oxidation in the β-carotene/ linoleic acid method. Similarly, Melo et al. (2008) observed that the fruit that presented the highest AA in the DPPH method presented the smallest AA by the β-carotene/linoleic acid method. A possible explanation for these differences is the fact that the ABTS, DPPH, and FRAP methods are not influenced by pro-oxidative substances, unlike the β-carotene/linoleic acid method (DUARTE-ALMEIDA et al., 2006). These differences in the response of these methods show the relevance of applying more than one analytical method, with different principles, when the objective is to assess AA in a food matrix or even of the pure compound.
4 Conclusion
The results confirmed the blueberry (Vaccinium sp.) produced in Brazil as a source of phenolic compounds with high antioxidant activity. They also showed that there are different levels of phenolic compounds and antioxidant activity according to the blueberry cultivar and the production location.
Overall, the results of this study show the great potential of blueberries for the development of foods rich in compounds with antioxidant properties.
Acknowledgements
The authors are grateful for the financial support provided by CNPq/Capes and to Italbraz®, Probst and Fazenda Saint Clair for supplying samples.
References
ARNOUS, A.; MAKRIS, D.; KEFALAS, P. Correlation of pigment and flavanol content with antioxidant properties in selected aged
regional wines from Greece. Journal of Food Composition
SINGLETON, V. L.; ROSSI, J. A. Colorimetry of total phenolics
with phosphomolybdic-phosphotungstic acid reagents. American
Journal of Enology and Viticulture, v. 16, p. 144-158, 1965. SRIVASTAVA, A. et al. Effect of storage conditions on the biological
activity of phenolic compounds of blueberry extract packed in glass bottles. Journal of Agricultural of Food Chemistry, v. 55, p. 2705-2713, 2007. PMid:17348670. http://dx.doi.org/10.1021/jf062914w
STRIK, B. Blueberry: An expanding world berry crop. Horticultural
Science Focus, v. 45, p. 7-12, 2005.
TARUSCIO, T. G.; BARNEY, D. L.; EXON, J. Content and profile of flavanoid and phenolic acid compounds in conjunction with the antioxidant capacity for a variety of northwest Vaccinium berries.
Journal of Agricultural of Food Chemistry, v. 52, p. 3169-3176, 2004. PMid:15137871. http://dx.doi.org/10.1021/jf0307595 WOLFE, K. L. et al. Cellular antioxidant activity of common fruits.
Journal of Agricultural of Food Chemistry, v. 56, p. 8418-8426, 2008. PMid:18759450. http://dx.doi.org/10.1021/jf801381y WU, X. et al. Lipophilic and hydrophilic antioxidant capacities of
common foods in the united states. Journal of Agricultural of
Food Chemistry, v. 52, p. 4026-4037, 2004. PMid:15186133. http:// dx.doi.org/10.1021/jf049696w
YANG, C. S. et al. Inhibition of carcinogenesis by dietary polyphenolic
compounds. Annual Review of Nutrition, v. 21, p. 381-406, 2001.
PMid:11375442. http://dx.doi.org/10.1146/annurev.nutr.21.1.381 ZHENG, W.; WANG, S. Y. Oxygen radical absorbing capacity
of phenolics in blueberries, cranberries, chokeberries, and
lingonberries. Journal of Agricultural of Food Chemistry, v. 51,
p. 502-509, 2003. PMid:12517117. http://dx.doi.org/10.1021/ jf020728u
MILLER, H. E. A simplified method for the evaluation of antioxidants.
Journal of the American Oil Chemists Society, v. 48, p. 91, 1971. MOYER, R. A. et al. Anthocyanins, Phenolics, and Antioxidant
Capacity in Diverse Small Fruits: Vaccinium, Rubus, and Ribes.
Journal of Agricultural of Food Chemistry, v. 50, p. 519-525, 2002. PMid:11804523. http://dx.doi.org/10.1021/jf011062r
NATELLA, F. et al. Benzoic and cinnamic acid derivatives as
antioxidants: structure-activity relation. Journal of Agricultural
of Food Chemistry, v. 47, p. 1453-1459, 1999. PMid:10563998. http://dx.doi.org/10.1021/jf980737w
POTTER, R. M. et al. Characteristics of wild Blueberry-Soy Beverages.
LWT-Food Science and Technology, v. 40, p. 807-814, 2007. http:// dx.doi.org/10.1016/j.lwt.2006.04.006
PRIOR, R. L. et al. Antioxidant capacity as influenced by total phenolic
and anthocyanin content, maturity, and variety of Vaccinium
species. Journal of Agricultural of Food Chemistry, v. 46, p. 2686-2693, 1998. http://dx.doi.org/10.1021/jf980145d
RE, R. et al. Antioxidant activity applying an improved ABTS radical
cation decolorization assay. Free Radical Biology & Medicine,
v. 26, p. 1231-1237, 1999.
http://dx.doi.org/10.1016/S0891-5849(98)00315-3
SANTOS, A. M. Situação e perspectiva do mirtilo no Brasil. Embrapa
Clima Temperado Pelotas, RS. Série Documentos, v. 134,
p. 282-285. 2004.
SEERAM, N. P. Berry fruits: Compositional Elements, Biochemical Activities, and the Impact of Their Intake on Human Health,
Performance, and Disease. Journal of Agricultural of Food
Chemistry, v. 56, p. 627-629, 2008. PMid:18211023. http://dx.doi. org/10.1021/jf071988k
SELLAPPAN, S.; AKOH, C. C.; KREWER, G. Phenolic compounds and antioxidant capacity of georgia-grown blueberries and blackberries.