C
elery is a highly appreciated vegetable for its fibber content and nutritional value. The plant has approximately 20 leaves attached to the crown, were the stem is. Each leaf is formed by a large and fully solidpetiole and several leaflets. The petiole
is the most commonly used part for consumption.
High quality celery consists of stalks which are well formed, have thick petioles, are compact, have minimal
petiole twisting, and have a light green and fresh appearance. Additional quality indexes are stalk and midrib length, absence of defects such as blackheart, pithy petioles, seed stalks, cracks or splits, and absence of insect damage
evaluation of celery harvested from early to late maturity. Horticultura Brasileira 31: 236-241.
Morphological, physicochemical and sensory evaluation of celery
harvested from early to late maturity
Alejandra Karina Yommi1; Natalia Marcela Di Gerónimo1; Liliana Esther Carrozzi1; Victoria Quillehauquy1; María Gabriela Goñi2,3; Sara Inés Roura2,3
1UIB (Unidad Integrada Balcarce), Postcosecha y Calidad de Frutas y Hortalizas, CC 276, 7620 Balcarce, Argentina; ayommi@balcarce. inta.gov.ar; [email protected]; [email protected]; [email protected] 2CONICET, Buenos Aires, Argentina; 3FIA-UNMdP, Grupo de Investigación en Ingeniería en Alimentos, Juan B Justo 4302, 7600 Mar del Plata, Argentina; ggoni@
fi.mdp.edu.ar; [email protected]
ABSTRACT
The aim of this study was to determine quality changes in petioles of self-blanching celery (Apium graveolens), cv. Golden Boy, harvested at 80, 87, 94, 101, 108, 115, 122 and 129 days after-transplanting (DAT). Total weight (TW), total length (TL), number of leaves per plant (LN) and by plant zone (external, LNZE; middle, LNZM; internal, LNZI), and petiole length (PL) were evaluated at each harvest time. Petioles quality of each zone in the plant were analyzed in terms of: color (hue angle), texture (cutting force), total soluble solids content (TSS) and titratable acidity (TA). The petioles also were sensorially evaluated by descriptive analysis considering
visual characteristics (flexibility, hollowness), flavor (typical flavor
and odor) and texture attributes (hardness, crunchiness, juiciness and
fibrousness). From 80 to 129 DAT, TW and TL increased 33 g/DAT and 0.62 cm/DAT, respectively. Leaves development was detected
until the 122 DAT; LNZI grew to a greater extent. The PL increased during plant development, mainly in middle and internal leaves; being the middle leaves the longest. Hue angle and cutting force were similar in external and middle petioles and both resulted higher than internal ones until the 122 and 115 DAT, respectively. The juiciness
increased and flexibility decreased during maturation, resulting 108 DAT maturity stage less flexible and juicier than 80 DAT. No significant differences between harvesting dates were observed in the other sensory properties evaluated. Inflorescence differentiation
was detected at 115 DAT, causing an increase in texture, TSS and TA. Optimum yield and quality balance were achieved at 122 DAT. Delayed harvest is associated with higher plants but also with lower petioles quality, mainly due to an undesirable change in texture.
Keywords: Apium graveolens, bolting, growth, maturity, senescence,
texture.
RESUMO
Avaliação morfológica, físico-química e sensorial de aipo colhido precocemente até a maturidade
O objetivo deste estudo foi determinar variações na qualidade dos pecíolos de aipo (Apium graveolens), cv. Golden Boy, em plantas coletadas aos 80, 87, 94, 101, 108, 115, 122 e 129 dias pós-transplante (DAT). O peso total (TW), comprimento total (TL), número de folhas por planta (LN) e em diferentes zonas na planta (externo, LNZE, central, LNZM; interno LNZI) e comprimento do pecíolo (PL) foram avaliadas a cada data de colheita. A qualidade dos pecíolos de cada zona foi analisada em termos de: cor (ângulo hue), textura (dureza de corte), teor de sólidos solúveis totais (SST) e acidez titulável (TA). Os pecíolos também foram avaliados por meio de análise sensorial pela análise descritiva das características visuais (flexibilidade, com -pacidade), sabor (sabor e odor característico) e atributos de textura (dureza, crocância, suculência e fibrosidade). Dos 80 aos 129 DAT, TW e TL aumentaram 33 g/DAT e 0,62 cm/DAT, respectivamente. O desenvolvimento das folhas foi detectado até 122 TPD; LNZI foi o que mais aumentou. PL aumentou durante o desenvolvimento da planta, em especial nas folhas centrais e mais internas, sendo as folhas centrais as mais longas. Ângulo Hue e dureza de corte foram semelhantes nos pecíolos externos e centrais e ambos tiveram valores maiores do que os internos até o 122 e 115 DAT, respectivamente. A suculência aumentou e a flexibilidade diminuiu durante a maturação, sendo que aos 108 DAT foram menos flexíveis e mais suculentos do que aos 80 DAT. Não foram observadas diferenças significativas entre as épocas de colheita nas outras propriedades sensoriais avaliadas. Diferenciação da inflorescência foi detectada aos 115 DAT, causando um aumento na textura, TSS e TA. Rendimento ótimo e equilíbrio de qualidade foram obtidos em 122 DAT. Colheita tardia está associada a plantas maiores, mas também com qualidade inferior de pecíolos, principalmente devido a uma mudança indesejável na textura.
Palavras-chave: Apium graveolens, florescimento precoce,
crescimento, maturidade, senescência, textura.
and decay (Suslow & Cantwell, 2011). Maturity of a fresh horticultural commodity is a continuum along the development process. Although a period of time scale is associated with the vegetable development, the exact process length is variable and unique for each commodity. The term mature implies a stage where the plant is ready to be processed, stored or eaten as a fresh produce. For the marketing process, maturity means suitability for storage, followed by sufficient shelf
life to assure profitable supply to retail
stores. However, the retail consumer may value other vegetable indexes such
as color, texture and flavor attributes.
For celery, maturity stages are not easily distinguished along the crop growth (Strandberg, 1985). Yield in celery is
defined by vegetative growth (Pressman, 1997). Plant height is strongly related to weight and considered as a growing index(Cannel et al., 1963), however, leaf number could be more valuable as a harvest index because it is not affected by cultivation conditions (Strandberg, 1985). In general, it has been recommended to harvest celery when the stalk measures at least 15 cm
to the first leaf and before the petioles become pithy, hard and fibrous.
Q u a l i t y s t a n d a r d s f o r c e l e r y generally are based only on external criteria as stalks and petioles shape, external appearance, absence of defects or decay(Raffo et al., 2006). It is accepted that high quality celery must be compact and tight without excessive open space in the center of the stalk. Minimally twisted petioles, and also light green and fresh appearance are desirable in self-blanching celery. Moreover, flavor and texture play a key role in determining consumer acceptability (Raffo et al., 2006).
There is little information available regarding the effect of physiological stage at harvest on celery quality. The crop should be ready for harvest at 85 to 120 days after transplanting, depending on the variety. Celery must be harvested within a few days after reaching marketable size to prevent a significant quality loss. Growers schedule transplanting date in order to have a uniform quantity of celery
reaching marketable size each week. However, it is a common practice to start harvesting once the plant reaches its commercial size. According to supply and demand, if demand is poor, plants are not harvested. This delay can negatively impact celery quality.
Analyzing only two harvesting dates (93 and 124 DAT), we reported that delayed harvest improved the nutraceutical value of ‘Golden Clause’ celery, although it also caused pithiness
and increased fibber content (Guerra et al., 2010). Such changes are not
beneficial for the sensory quality (Sams,
1999). Previous research provided basic information about the physical, chemical and nutritional quality of celery associated with harvest maturity stages and the leaf position within the plant (external, middle and internal) (Guerraet al., 2010). However, it is necessary to include more sampling dates before and after celery plants reach marketable size in order to elucidate the
main changes associated with maturity.
These findings would allow determining
the maturity range with an acceptable quality and the optimum maturity stage at harvest to achieve the highest quality.
The aim of this study was to characterize celery plants at eight harvesting dates, from morphological and physicochemical criteria and also through sensory testing. Three zones of the plant (external, middle and internal) were analyzed to determine the optimal harvest time. These results would be useful for the industry, if the celery is intended for fresh-cut product preparation.
MATERIAL AND METHODS
Self-blanching celery (Apium graveolens), cv. Golden Boy was
obtained from a commercial field in
Mar del Plata, Buenos Aires, Argentina. Celery was cultivated in soil covered with plastic mulch, under greenhouse
0 500 1000 1500 2000 2500
T
ot
al
w
ei
ght
(
g)
0 10 20 30 40 50 60 70 80 90
70 80 90 100 110 120 130 140
T
ot
al
lengt
h (
c
m
)
-T
ot
al
num
ber
of
leav
es
Days after transplanting
Total length (TL)
Total number of leaves (LN)
a
b
Figure 1. Total weight (a), total length and total number of leaves (b) of celery plants harvested
conditions, during the autumn and winter (between May and September). Plants were harvested at 80, 87, 94, 101, 108, 115, 122 and 129 DAT. At each sampling date, total weight (TW, g) and total length of the plant (TL, cm) were registered (n= 30). TL was measured from the plant base to the distal end
of the last leaflet. Twelve plants were
defoliated and the total number of leaves (LN) was recorded. Each leaf was marked as external, middle or internal considering its position within the plant, according to its length, the degree of development and level of association.
The first 4 to 6 leaves were considered
external; these are longer, greener, and alternated leaves. The internal leaves are linked with each other, usually more yellowish and are not fully expanded.
The rest of the leaves, with less defined features, were classified as middle. The number of leaves by zone (external, LNZE; middle, LNZM; internal, LNZI) and their respective petiole length (PL, cm) were recorded.
For quality evaluation, a petiole section of 15 cm (measured from the node towards the bottom) of each leaf was taken. Five plants of each physiological stage were evaluated. Color was determined in the middle portion of the petiole with a chromameter (MINOLTA model CR-300, Konica Minolta Sensing Americas Inc., NJ, USA) and analyzed in terms of hue angle (CIELab* color space). Total soluble solids (TSS) and titratable acidity (TA) were measured in the juice obtained from the pool of all petioles belonging to each zone plant position with a juicer machine (Philips Cucina, Shanghai, China). TSS were determined by a digital refractometer (ATAGO
model Palette α Series, ATAGO Co.
Ltd., Tokyo, Japan) and expressed as percentage. TA was analyzed with an automatic titrator (TITRALAB model 901, Radiometer Medical APS, Brønshøj, Denmark) calculating the titratable acidity as citric acid (%). Texture was determined in each petiole of 3 plants as the maximum force necessary to cut the 15 cm petiole section (cutting force, kg), using a texture analyzer (QUANTROLTM
model 500N BFG, Dillon / Quality
Plus Inc., Kansas, USA) equipped with a Warner-Bratzler shear blade (GR Manufacturing Co, Manhattan, USA), with a speed of 0.4 mm s-1.
Sensory evaluation was performed at each harvest date by a trained panel of ten people with expertise on vegetables. The panel received four hours per day of training during one week. Celery samples were held at room temperature before evaluation and served in plastic trays by duplicate. The Quantitative Descriptive Analysis method (Stone & Sidel, 1993) was applied using 100 mm long unstructured intensity scale, anchored at the ends with descriptive terms (0= low, 10= high, except from hollowness: 0= null, 10= strong and hardness: 0= tender, 10= hard). Panelists evaluated some visual attributes related
to texture (flexibility and hollowness), to flavor (characteristic flavor and odor)
and to texture (hardness, crunchiness, j u i c i n e s s a n d f i b r o u s n e s s ). F o r sensorial analysis we considered the same descriptors and their definitions reported by Raffo et al. (2006). Two sets were assessed in one session (day), with ten minutes break between the sets. No reference samples were provided to the assessors. The order of presentation was randomized among panelists within each set. Individual portions for evaluation consisted of two petioles freshly cut after removal of the external and internal petioles of the
plant; leaflets were removed and clipped
to get standard length petioles (15 cm).
For flavor and texture evaluation, the
second petiole was cut in pieces of
0 2 4 6 8 10 12
N
um
ber
of
l
eav
es
Externals Middles Internals
0 10 20 30 40
70 80 90 100 110 120 130 140
Days after transplanting
P
et
iol
e l
enght
(
c
m
)
Externals Middles Internals
a
b
Figure 2. Number of leaves (a) and petiole length (b) by zone of the celery plants harvested
20 mm length. All assessments were conducted in individual booths at the Sensory Evaluation Laboratory at INTA.
Results showed in this study are expressed as least square mean values (LSMEAN values) with their standard deviations. A completely randomized design was considered for total weight and total length of celery plant (with 30 replications), total number of leaves (with 20 replications) and sensorial attributes (with 2 replications and 10 panelists). A factorial of 8 (harvesting dates) x 3 (zones in the plant) in a completely randomized design with
five replications was considered for the
number of leaves and petiole length by zone of the plant. Data were analyzed by means of ANOVA procedures, using the PROC GLM (general linear model procedure) of SAS version 8.0 (SAS Institute, Cary, NC, USA). Tukey-Kramer multiple comparison test was
used when significant differences were found with α= 0.05. A linear model
was proposed for TW and TL data, and
analyzed by simple regression.
RESULTS AND DISCUSSION
The data obtained from the evolution of plant weight (TW) and total length (TL), and differentiation of leaves, through the variables number of leaves (LN), leaf number (LNzone) and petiole length (PL) in each zone of the plant (external, middle and internal) allowed to determine the morphological changes of celery during development. TW
and TL were significantly affected by
the harvesting dates (p<0.0001). TW increased from 309 g to 2094 g whereas TL changed from 47.6 cm to 81.9 cm between 80 and 129 DAT period (Figure 1, a and b). Both parameters followed a linear trend with a daily biomass growth rate of 33.0 g and 0.62 cm (n= 30, p<0.0001 for both, TW and TL). The leaf number and height increase, petioles
thickening and floral stem elongation
could explain the raise of TW.
LN was significantly affected by the
harvesting dates (p<0.0001). Although, the changes in LN were not similar to those observed for fresh weight increments. The increase in the total leaves number ceased at 122 DAT stage (Figure 1b). Approximately 8 leaves were developed during the period
between the first and last harvesting
date (49 days). The LNz data revealed
a significant interaction between the
factors in study (p<0.001). Plants harvested at an early maturity stage (80 DAT) showed similar leaf number in each plant zone (3.3 leaves) (Figure 2a). However, between 87 and 101 DAT, LN by zone increased in a centripetal direction. LNZI significantly rose during early to late harvest while a lesser increase was observed for LNZM and LNZE (Fig. 2a). No significant changes in LNZI were detected from 108 to 129 DAT (with a leaf number mean of 7.3). For the last two harvesting dates (122 and 129 DAT), external and middle zones had a similar value (5 leaves). Therefore, the increase in the
Figure 3. Quality evaluation in terms of color (a), total soluble solids (b), titratable acidity (c) and texture (d) of external, middle and internal
petioles of celery plants harvested at different days after-transplanting (avaliação de qualidade em termos de cor (a), sólidos solúveis totais
(b), acidez titulável (c) e textura (d) dos pecíolos das zonas externa, média e interna de plantas de aipo colhidas em dias diferentes após o transplante). Balcarce, UIB, 2010.
0 1 2 3 4 5 6
70 80 90 100 110 120 130 140
Days after transplanting
T
ex
tur
e (
k
g)
Externals Middles Internals
90 100 110 120 130
C
ol
or
(
hue)
Externals Middles Internals
0 1 2 3 4 5
70 80 90 100 110 120 130 140
Days after transplanting
T
ot
al
s
ol
ubl
e s
ol
ids
(
%
)
Externals Middles Internals
0.00 0.01 0.02 0.03 0.04 0.05 0.06 0.07 0.08 0.09 0.10
T
it
rat
abl
e ac
idi
ty
(
%
)
Externals Middles Internals
A
D C
total LN during the analyzed period of harvest was due mainly to a greater differentiation of internal leaves.
Statistical analysis of PL data shows
a significant interaction between factors
(p<0.002). The PL increased during plant development, mainly in middle
and internal leaves (Figure 2b). With
the exception of the first harvesting date
(80 DAT), the PL was longer in middle leaves, in agreement with results found for celery ‘Golden Clause’ (Guerraet al., 2010). About 50% of the leaf length corresponded to petiole, which did not
change during celery development in all zones of the plant (data not shown), indicating that elongation of the whole leaf and its petiole followed a similar dynamic. This was an interesting result because the petiole is the main part of the celery plant consumed, either for household or commercial uses.
Analysis of variance showed that interaction effects for all measured characteristics of quality (colour, TSS,
TA, texture) were significant (p<0.002).
During the assessment period, hue angle did not change in the petioles of the middle leaves, and decreased in the external zone at the last physiological stage, probably as a sign of senescence (Figure 3a). In the internal leaves, hue did not show any changes or diminished during 80 and 108 DAT. In this period,
internal leaves had a significant lower
hue angle (more white-yellowish tone) than the middle and external ones. Thereafter, hue value increased in petioles of internal zone. As a result of this increase in hue, the internal zone showed a similar color to those obtained for middle ones in the last two developmental stages. This is interesting, because it indicates that the physiological stage 122 DAT and eventually, 129 DAT, are very suitable raw material to prepare a fresh-cut produce homogeneous in color.
In general, TSS were higher in the internal petioles compared to the middle ones (Figure 3b). TSS in the external leaves resulted similar to the other two zones. Middle petioles had, in general, lower TA than the external and internal ones (Figure 3c). At the last physiological stage, internal and middle petioles had similar TA but it was higher than those for external petioles. TSS and TA changes in the internal leaves occurred mainly at the beginning (between 80 and 94 DAT) or towards to the end of the study (after 115 DAT).
In the first period of growing, TSS and TA significantly decreased in internal
and external petioles, respectively, remaining stable in the other zone (Figure 3b and 3c). TSS decreases in young plants may be due to the high consumption of sugars during their rapid growth phase. In the second period,
TSS and TA increased significantly in
0 1 2 3 4 5 6 7 8 9 10
V
is
ual
at
tr
ibut
es
r
el
at
ed w
it
h t
ex
tur
e Flexibility Hollowness
0 1 2 3 4 5 6 7 8 9 10
Days after transplanting
A
tt
ri
but
es
r
el
at
ed w
it
h s
ens
or
ial
t
ex
tur
e
Hardness Crunchiness Juiciness Fibrousness
a
b
0 1 2 3 4 5 6 7 8 9 10
70 80 90 100 110 120 130 140
Days after transplanting
A
tt
ri
but
es
r
el
at
ed w
it
h f
lav
our
Characteristic flavour Odour
c
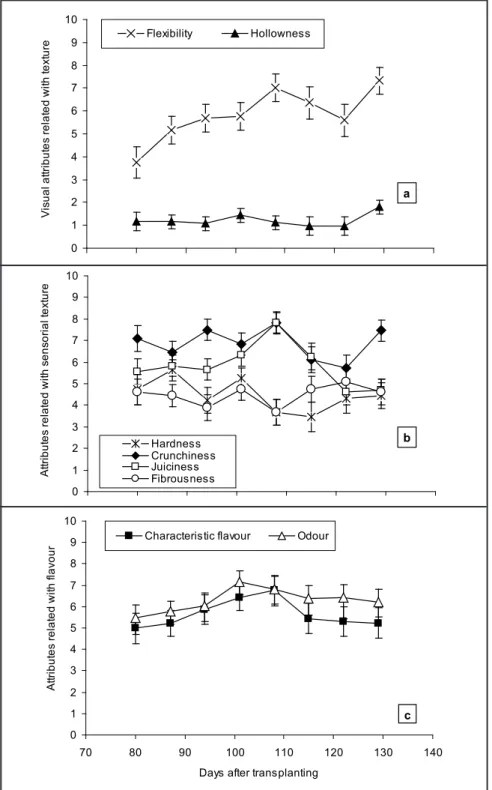
Figure 4. Sensory evaluation of petioles of celery plants harvested at different harvesting
dates: visual attributes related with texture (a), attributes related with texture (b) and with
flavor (c) (avaliação sensorial de pecíolos de plantas de aipo colhidas em épocas de colheita
all zones of the plant. As inflorescence
differentiation was detected at 115 DAT, TSS and TA changes could be associated
with flowering onset and aging (Gómez & Artés, 2004).
Petioles of external and middle zones required a higher cutting force than the internal ones during the 80 to 115 DAT (Figure 3d). Little changes in texture during plant development were detected in petioles of external leaves. Middle leaves were not affected by harvesting dates. In the internal zone, the hardness of the petioles increased at the last physiological stage, being the cutting force at this sampling date similar to petioles from middle zone
but both were significantly lower than
the external leaves texture. Textural attributes of fruits and vegetables are related to the structural, physiological, and biochemical characteristics of the living cells. Changes that occur in the cell wall during the ripening of fruit, storage of produce, and cooking
are critical for the texture of the final
product. During the growth of some vegetative parts, especially stems and petioles, cell walls become lignified (Price & Floros, 1993). Also, changes in the collenchyma tissue during celery maturation could be responsible for the described changes of measured texture.
Results of sensorial panel are shown in Figure 4. The data revealed that
harvesting dates significantly affected sensorial attributes, but only flexibility
(p<0.01) and juiciness (p<0.01) (Fig.
4a and 4b). The flexibility decreased
significantly from 80 to 108 DAT stage (from 6.4 to 3.0, respectively), thereafter remaining stable until the last harvesting date (Fig. 4a). The juiciness increased during plant development,
reaching the highest value at 108 DAT (from 5.3 to 7.8, between 80 and 108 DAT) (Fig. 4b). Both changes could
be related to the onset of flowering as
well as aging of tissues. Consequently, the 108 DAT could be associated with a pre-reproductive stage.
Bolting and flowering process observed at 115 DAT stage affected the petiole quality, essentially its texture, as was detected as the maximum force necessary to cut in the last physiological stage (129 DAT). Considering the obtained yield in terms of plant weight and length, ‘Golden Boy’ celery should not be harvested until 115 DAT, maximizing both indexes at 129 DAT stage. In order to achieve an optimal balance between yield and quality of celery, plants should be harvest between 115 and 122 DAT. This implies 74 cm-high and 1.5 kg-weigh plants. Petioles of ‘Golden Boy’ cultivar showed an adequate quality in a wide range of physiological stages, allowing the growers to decide the harvest date, looking forward the best moment based on demand and prices. If celery petioles are intended for fresh-cut and related to textural differences, the three zones seem to be appropriate, as quality characteristics were not strongly affected by the leaf position in the plant.
ACKNOWLEDGEMENTS
The authors wish to thank to Prof. Viviana Innocentini and Ana Forte from the Facultad de Ciencias Agrarias, Universidad de Mar del Plata (UNMDP, Mar del Plata, Argentina) by the translation and edition of this article.
This work has been financially
supported by Instituto Nacional de Tecnología Agropecuaria (INTA), Proyecto Nacional PNHFA-062332, Consejo Nacional de Investigaciones Científicas y Técnicas (CONICET), Agencia Nacional de Promoción
Científica y Tecnológica/FONCyT and
Universidad Nacional de Mar del Plata (UNMDP), Argentina.
REFERENCES
CANNEL GH; TYLER KB; TAKATORI FH. 1963. Growth measurement of celery in relation to yield. Proceeding of American Society for Horticultural Science 83: 511-518. GÓMEZ P; ARTÉS F. 2004. Keeping quality
of green celery as affected by modified atmosphere packaging. European Journal of Horticultural Science 69: 215-219.
GUERRA N; CARROZZI L; GOÑI MG; ROURA S; YOMMI A. 2010. Quality characterization of celery (Apium graveolens L.) by zones of plant and two harvest dates. Journal of Food Science 75: 327-332.
PRESSMAN E. 1997. Celery. In: WIEN HC (ed). The Physiology of Vegetable Crops. CAB International, Cambridge, UK. p. 387-407. PRICE JL; FLOROS JD. 1993. Quality decline
in minimally processed fruits and vegetables. Developments in Food Science 32: 405-427. RAFFO A; SINESIO F; MONETA E; NARDO N;
PEPARAIO M; PAOLETTI F. 2006. Internal quality of fresh and cold stored celery petioles
described by sensory profile, chemical and
instrumental measurements. European Food Research and Technology 222: 590-599. SAMS CE. 1999. Preharvest factors affecting
postharvest texture. Postharvest Biology and Technology 15: 249-254.
STONE H; SIDEL J. 1993. Sensory Evaluation Practices. 2a ed. Academic Press, p.338.
STRANDBERG JO. 1985. Field appraisal of celery growth. Proceedings of the Florida State Horticultural Society 98: 294-299. SUSLOW T; CANTWELL M. 2011. Celery:
recommendations for maintaining postharvest quality. Available on http://postharvest.
ucdavis.edu/Produce/ProduceFacts/Veg/