Hepcidin is regulated by promoter-associated
histone acetylation and HDAC3
Sant-Rayn Pasricha
1,2
, Pei Jin Lim
1
, Tiago L. Duarte
3
, Carla Casu
4
, Dorenda Oosterhuis
5
,
Katarzyna Mleczko-Sanecka
6,7
, Maria Suciu
8
, Ana Rita Da Silva
6
, Kinda Al-Hourani
1
, João Arezes
1
,
Kirsty McHugh
9
, Sarah Gooding
1
, Joe N. Frost
1
, Katherine Wray
1
, Ana Santos
3
, Graça Porto
3,10
,
Emmanouela Repapi
11
, Nicki Gray
11
, Simon J. Draper
9
, Neil Ashley
8
, Elizabeth Soilleux
12,13
, Peter Olinga
5
,
Martina U. Muckenthaler
6
, Jim R. Hughes
8
, Stefano Rivella
4
, Thomas A. Milne
8
, Andrew E. Armitage
1
& Hal Drakesmith
1
Hepcidin regulates systemic iron homeostasis. Suppression of hepcidin expression occurs
physiologically in iron de
ficiency and increased erythropoiesis but is pathologic in thalassemia
and hemochromatosis. Here we show that epigenetic events govern hepcidin expression.
Erythropoiesis and iron de
ficiency suppress hepcidin via erythroferrone-dependent and
-independent mechanisms, respectively, in vivo, but both involve reversible loss of H3K9ac
and H3K4me3 at the hepcidin locus. In vitro, pan-histone deacetylase inhibition elevates
hepcidin expression, and in vivo maintains H3K9ac at hepcidin-associated chromatin
and abrogates hepcidin suppression by erythropoietin, iron de
ficiency, thalassemia, and
hemochromatosis. Histone deacetylase 3 and its cofactor NCOR1 regulate hepcidin; histone
deacetylase 3 binds chromatin at the hepcidin locus, and histone deacetylase 3 knockdown
counteracts hepcidin suppression induced either by erythroferrone or by inhibiting bone
morphogenetic protein signaling. In iron deficient mice, the histone deacetylase 3 inhibitor
RGFP966 increases hepcidin, and RNA sequencing con
firms hepcidin is one of the genes
most differentially regulated by this drug in vivo. We conclude that suppression of hepcidin
expression involves epigenetic regulation by histone deacetylase 3.
DOI: 10.1038/s41467-017-00500-z
OPEN
1MRC Human Immunology Unit, MRC Weatherall Institute of Molecular Medicine, University of Oxford, Oxford OX3 9DS, UK.2Department of Medicine,
The Royal Melbourne Hospital, Faculty of Medicine, Dentistry and Health Sciences, University of Melbourne, Melbourne, Victoria 3010, Australia.3Instituto de Investigação e Inovação em Saúde and IBMC—Instituto de Biologia Molecular e Celular, University of Porto, 4200-135 Porto, Portugal.4Division of Hematology, Department of Pediatrics, Children’s Hospital of Philadelphia, Philadelphia, Pennsylvania 19104, USA.5Pharmaceutical Technology and Biopharmacy, Department of Pharmacy, University of Groningen, 9700-AD Groningen, The Netherlands.6Department of Pediatric Hematology, Oncology and Immunology, University of Heidelberg; and Molecular Medicine Partnership Unit, Heidelberg 69117, Germany.7International Institute of Molecular and Cell Biology, 02-109, Warsaw, Poland.8MRC Molecular Haematology Unit, MRC Weatherall Institute of Molecular Medicine, University of Oxford, Oxford OX3 9DS, UK.9Jenner Institute, University of Oxford, Old Road Campus Research Building, Oxford OX3 7DQ, UK.10ICBAS—Instituto de Ciências Biomédicas Abel Salazar, University of Porto Portugal, 4050-313 Porto, Portugal.11Computational Biology Research Group, Weatherall Institute of Molecular Medicine, University of Oxford, John Radcliffe Hospital, Oxford OX3 9DS, UK.12Nuffield Division of Clinical Laboratory Sciences, Radcliffe Department of
Medicine, Oxford University, Oxford OX3 9DU, UK.13Division of Cellular and Molecular Pathology, Department of Pathology, Cambridge University,
Cambridge CB2 0QQ, UK. Correspondence and requests for materials should be addressed to S.-R.P. (email:[email protected]) or to [email protected])
T
he liver-expressed peptide hormone hepcidin, encoded by
HAMP in humans (Hamp1 in mice), controls systemic iron
levels by inhibiting intestinal iron absorption and
iron recycling
1. Expression of hepcidin is regulated by iron
status,
erythropoietic
drive,
hypoxia,
and
inflammation
2.
Iron accumulation in the liver stimulates bone morphogenetic
protein-6 (BMP6) signaling, which enables homeostatic responses
to iron loading by inducing hepcidin expression via SMAD
transcription
factors
3–5.
Inflammatory cytokines such as
interleukin-6 elevate hepcidin levels through activation of
STAT3
6.
Hepcidin levels are suppressed in patients with iron deficiency
(ID) and in patients with increased erythropoiesis (e.g.,
with thalassemia). Increased erythropoietic drive suppresses
hepcidin
7at
least
partly
via
the
erythroblast-secreted
hormone erythroferrone (encoded by the gene Fam132b)
8,
which is considered to largely account for hepcidin suppression in
stress erythropoiesis and thalassemia
8,9. Suppression of hepcidin
in
ID
is
thought
to
occur
due
to
diminished
BMP
signaling, achieved both through decreased iron-dependent
BMP6 expression
10, and following cleavage of the BMP6
co-receptor hemojuvelin via TMPRSS6
11. However, a role for
erythroferrone in suppression of hepcidin in ID has also been
proposed
12although not confirmed. Hypoxia may also mediate
hepcidin suppression, either indirectly via erythropoiesis
13or via
secreted factors such as PDGF-BB
14. Defects in the pathways that
regulate hepcidin produce disease: relative reductions in hepcidin
underlie most forms of hereditary hemochromatosis
15, ineffective
erythropoiesis suppresses hepcidin contributing to iron loading
in thalassemia
16,17and inflammation elevates hepcidin leading
to anemia of inflammation
18. Restoring hepcidin levels in
hemochromatosis or thalassemia
19,20or reducing it in anemia of
inflammation
21are major therapeutic ambitions.
Plasma
hepcidin
levels
appear
chiefly regulated by
transcriptional changes in hepatic hepcidin gene expression.
Although progress has been made in understanding hepatic
1000 **** **** * Liver Hamp1 mRNA (vs Hprt ) Liver Hamp1 mRNA (vs Hprt ) 100 10 1 0.1 0.01 0.4 0.4 0.3 0.2 0.1 0.0 0.3 0.2 0.1 0.0 Spleen weight (g) Spleen weight (g)
**** NS NS 1000 20 NS NS NS 15 10 5 0 100 10 Hb (g/dL) 20 15 10 5 0 Hb (g/dL) 1 0.1 0.01 Control 2w Control 3w Control 2w ID 3w ID 2w Control 3w Control 2w ID 3w ID 2w Control 3w Control 2w ID 3w ID Control 2w ID Epo Control Epo
a
b
**** NS NS BM Erfe mRNA (vs Hprt ) BM Fam132b mRNA (vs Hprt ) 10 1 1 0.1 0.01 10 0.1 0.01 2w Control 3w Control 2w ID 3w ID Control Epoc
BM GlyC mRNA (vs Hprt ) BM GlyC mRNA (vs Hprt ) 1 10 * 10 NS NS 0.1 1 0.1 2w Control 3w Control 2w ID 3w ID Control Epod
e
Liver Id1 mRNA (vs Hprt ) Liver Id1 mRNA (vs Hprt ) 0.01 0.001 0.1 1 0.01 0.001 0.1 1 3w Control 3w Control 2w ID 3w ID NS NS **** ** * Control Epof
Liver Smad7 mRNA (vs Hprt ) Liver Smad7 mRNA (vs Hprt ) 0.01 0.1 1 0.01 0.1 1 2w Control 3w Control 2w ID 3w ID NS NS NS ** * Control Epog
0.1 NS NS 50 * 40 30 20 10 0Serum iron ug/dL
0.01 0.001 Kidney Epo mRNA (vs Hprt ) 2w Control 3w Control 2w ID Control 2w ID 3w ID
h
i
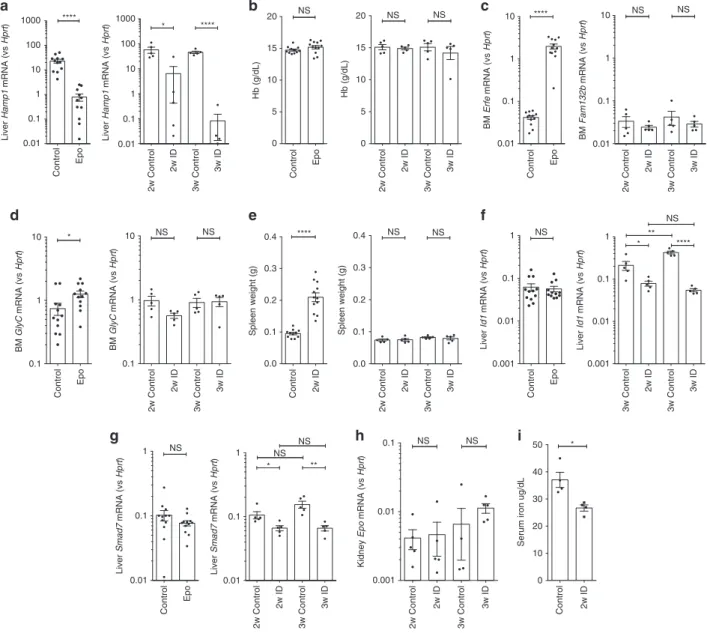
Fig. 1 Effects of erythropoietin and iron deficiency in vivo. Effects of (1) 3 days erythropoietin (Epo) 200 IU i.p. administration and (2) 2 or 3 –weeks of iron-deficient (2–6 ppm) diet in C57Bl/6 mice, on a hepatic Hamp1 gene expression, b hemoglobin concentration, c bone marrow Fam132b gene expression, d bone marrow glycophorin C,e spleen weight, f hepatic Id1 gene expression, g hepatic Smad7 gene expression. Effects of 2 weeks iron-deficient diet on h renal Epo gene expression, andi serum iron. (Epo experiment n = 13 per group, 6-week-old males; iron deficiency (ID) experiments n = 5 per group, 4-week-old males at commencement of experimental diet). Student’s t-test. Data are means ± s.e.m. *P ≤ 0.05; **P ≤ 0.01; ***P ≤ 0.001; ****P ≤ 0.0001; NS, P > 0.05
hepcidin regulation, critical events at the hepcidin gene locus that
control changes in expression remain poorly defined. In general,
post-translational
histone
modifications (e.g., acetylation
and methylation) associate with, and may directly mediate,
transcriptional status
22. Histone deacetylase (HDAC) inhibitors
are compounds which inhibit HDACs, thus generally increasing
histone acetylation. Treatment of hepatic cells in vitro
with HDAC inhibitors has been observed to raise hepcidin
expression
23–25, and SMAD4 (the canonical hepcidin regulatory
transcription factor) overexpression and BMP treatment raised
H3K4me3 and H3K9ac at the hepcidin promoter in vitro
26.
We
sought
to extend
these
insights
to discover
how
histone modifications at the hepcidin locus mediate regulation of
hepcidin expression in response to physiologic stimuli in vivo,
and to identify specific epigenetic regulators of hepcidin. Here,
we report that histone activation marks are removed from the
hepcidin locus when hepcidin is physiologically suppressed,
that hepcidin expression can be rescued from physiologic
inhibition by HDAC inhibition, and that HDAC3 and its
cofactors regulate hepcidin expression.
Results
Erythropoiesis and ID suppress hepcidin via distinct paths. We
recapitulated scenarios of stress erythropoiesis and ID using two
experimental mouse models of hepcidin suppression—stimulated
erythropoiesis with recombinant human erythropoietin (Epo),
and induction of ID via a low-iron diet. Three days of Epo
treatment reduced liver Hamp1 ~30–fold, while 2 weeks low-iron
diet induced ~9-fold suppression of Hamp1 (Fig.
1
a), although
these treatments have no effect on hemoglobin (Hb)
concentra-tions (Fig.
1
b) or liver iron (Supplementary Fig.
1
a). Indicative
of stimulated erythropoiesis, Epo increased bone marrow
Fam132b (~50-fold, Fig.
1
c), Glyc (~1.7-fold, Fig.
1
d), and
Tfrc (Supplementary Fig.
1
b) expression, and spleen weights
approximately doubled (Fig.
1
e). The disproportionate increase
in Fam132b compared with Glyc expression perhaps reflects the
direct effect of Epo receptor-mediated Jak-Stat signaling on the
erythroferrone locus
8. In contrast, ID did not increase bone
marrow Fam132b expression, bone marrow Glyc, or spleen size
(Fig.
1
c–e). ID mice had reduced liver expression of Bmp target
genes Id1 and Smad7, and after 3 weeks low-iron diet, Atoh8 and
Bmp6, consistent with sensing of lower iron levels
10and the
homeostatic response of hepcidin suppression occurring via
reduced Bmp signaling (Fig.
1
f, g; Supplementary Fig.
1
c, d); these
changes were not seen in mice administered Epo. ID in these
experiments was not associated with a significant increase in
kidney Epo messenger RNA (mRNA) (Fig.
1
h). ID (Fig.
1
i) but
not Epo treatment (Supplementary Fig.
4
h) reduced serum iron.
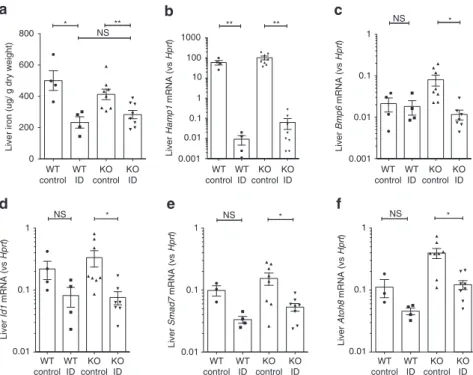
Suppression of hepcidin by ID is erythroferrone-independent.
These
findings indicate that our Epo treatment regime induced
hepatic hepcidin suppression but did not strongly perturb BMP
signaling, while ID induced hepcidin suppression but did not
affect erythroferrone expression. To establish whether hepcidin
suppression in ID was erythroferrone-independent, we induced
ID in Fam132b knockout mice using a low-iron diet for 3 weeks,
which decreased liver iron (Fig.
2
a). Iron-deficient Fam132b
knockout mice had a similar degree of hepcidin suppression to
control mice (gene expression data Fig.
2
b, fold change data
Supplementary Fig.
2
a), associated with reduced Bmp6 expression
and BMP signaling (lower expression of Id1, Smad7, and Atoh8)
(raw expression data Fig.
2
c–f, fold changes shown in
Supplementary Fig.
2
a). These data indicate that suppression of
hepcidin by ID does not require erythroferrone. In contrast, and
as previously shown
8, Fam132b knockout mice do not suppress
hepcidin following administration of Epo, showing the critical
role of this gene in suppression of hepcidin by erythropoiesis
(Supplementary Fig.
2
b).
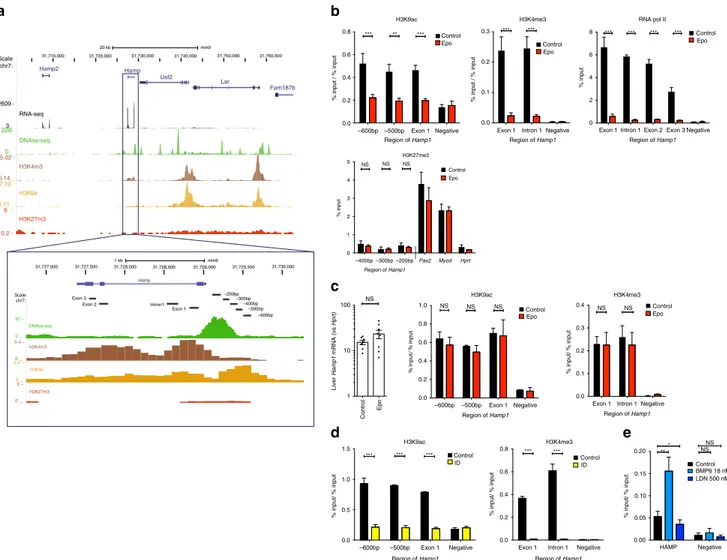
Epo and ID cause loss of Hamp1-associated H3K9ac and
H3K4me3. We next investigated whether hepcidin suppression
NS * NS * NS * Liver Id1 mRNA (vs Hprt ) Liver Smad7 mRNA (vs Hprt ) Liver Atoh8 mRNA (vs Hprt ) 1 0.1 0.01 1 0.1 0.01 1 0.1 0.01 WT control KO control WT ID KO ID WT control KO control WT ID KO ID WT control KO control WT ID KO ID WT control KO control WT ID KO ID WT control KO control WT ID KO ID WT control KO control WT ID KO ID 800 * ** NS 600
Liver iron (ug/ g dry weight)
400 200 0
a
1000 100 10 1 0.1 0.01 0.001 ** ** Liver Hamp1 mRNA (vs Hprt )b
1 0.1 0.01 0.001 * NS Liver Bmp6 mRNA (vs Hprt )c
d
e
f
Fig. 2 Effects of ID in Fam132b knockout mice. Effects of 3-week iron-deficient diet compared with control diet in 5-week-old wild-type and Fam132b knockout mice, ona liver iron content, b hepatic Hamp1 mRNA expression, c hepatic Bmp6 mRNA expression, d hepatic Id1 mRNA expression, e hepatic Smad7 mRNA expression, and f hepatic Atoh8 mRNA expression (WT mice, N = 4 per group. KO mice, N = 8 per group). Student’s t-test. Data are means ± s.e.m. *P ≤ 0.05; **P ≤ 0.01; ***P ≤ 0.001; ****P ≤ 0.0001; NS, P > 0.05
was associated with epigenetic modifications at the Hamp1 locus.
In the basal state in wild-type mice subsisting on standard chow,
when Hamp1 is highly expressed, chromatin is open at the
hepcidin locus (characterized by a DNase hypersensitive peak at
the promoter) and activation-associated histone marks (H3K9ac,
H3K4me3) are present; in contrast, the repressive mark
H3K27me3 is absent (Fig.
3
a). Chromatin immunoprecipitation
(ChIP)–quantitative PCR (qPCR) assays demonstrated erasure of
H3K9ac and H3K4me3 at the hepcidin locus after 3 days of Epo
treatment (Fig.
3
b). Loss of RNA Polymerase II binding to the
hepcidin promoter and gene body was also observed (Fig.
3
b),
confirming that hepcidin suppression is mediated by loss
of transcription initiation, rather than through inhibition
of transcription elongation or post-transcriptional mechanisms
(e.g., via mRNA stability or translational regulation). The lost
activation marks were not replaced by repressive marks
(H3K27me3) (Fig.
3
b), suggesting that Polycomb repressive
complex 2 is not involved in repression of Hamp1; indeed,
6 weeks following 3 days of Epo treatment, Hamp1 expression
had returned to normal levels, accompanied by restoration of
H3K9ac and H3K4me3 at the Hamp1 promoter (Fig.
3
c). In mice
receiving iron-deficient diets, hepcidin suppression was likewise
accompanied
by
erasure
of
activation-associated
histone
marks (H3K9ac and H3K4me3) (Fig.
3
d). In the human
hepatoma Huh7 cell line, upregulation of hepcidin expression
through the canonical BMP pathway increased H3K9ac at
the HAMP promoter, while suppression of HAMP mRNA
expression using a BMP receptor inhibitor (LDN193189) reduced
enrichment for this mark (Fig.
3
e; Supplementary Fig.
2
c).
These data indicate that loss of activation-associated histone
marks at the Hamp1 promoter is a common feature of hepcidin
transcriptional suppression caused by both erythropoiesis and
Scale chr7: 31,710,000 31,727,000 Scale chr7: Exon 3 Exon 2 Intron1 Exon 1 97 0 5.4 H3K4m3 DNAse-seq 0 2.5 0 3 0 H3K9a H3K27m3 31,727,500 31,728,000 1 kb Hamp mm9 31,728,500 31,729,000 31,729,500 –200bp –300bp –400bp –500bp –600bp 31,730,000 20 kb 31,720,000 31,730,000 mm9 0.8 *** ** *** *** *** *** *** *** ***H3K9ac H3K4me3 RNA pol II
Control Epo Control Epo Control Epo Control Epo Control Epo Control Epo Control 0.8 0.6 0.20 0.15 0.10 0.05 0.00 0.4 0.2 0.0 ID ControlID Control BMP6 18 nM LDN 500 nM 0.6
% input / % input % input / % input
% input/ % input
% input/ % input % input/ % input % input/ % input
% input/ % input % input 0.4 0.2 0.2 0.1 0.0
Exon 1 Intron 1Negative Exon 1Intron 1Exon 2 Exon 3Negative
0.3 8 6 4 2 0 0.0 –600bp –400bp –300bp –200bp Region of Hamp1
Region of Hamp1 Region of Hamp1
Region of Hamp1 Region of Hamp1
H3K9ac H3K9ac H3K4me3 H3K4me3 NS 1.0 0.8 0.6 0.4 0.4 0.3 0.2 0.1 0.0 0.2 0.0 NS NS NS NS Pax2 Myod Hprt –500bp Exon 1 Negative Region of Hamp1 H3K27me3 NS NS NS 5 4 3 % input 2 1 0 100 NS Liver Hamp1 mRNA (vs Hprt) 10 1 Control 1.5 1.0 0.5 0.0 –600bp *** *** *** *** ** * NS NS HAMP Negative ***
Epo –600bp –500bp Exon 1 Negative Exon 1 Negative
–500bp Exon 1 Negative Exon 1 Intron 1
Intron 1
Negative
Region of Hamp1 Region of Hamp1
31,740,000 31,750,000 31,760,000 Hamp2 Hamp Usf2 Lsr Fam187b 2609 RNA-seq 3 35.02 0.14 27.19 0.11 6 H3K27m3 0.2 H3K9a H3K4m3 226 0 DNAse-seq
a
b
c
d
e
Fig. 3 Chromatin modifications at the hepcidin locus. a Diagram of hepcidin gene from UCSC genome browser, demonstrating ENCODE tracks for hepatic histone marks, DNase hypersensitivity (DNase-seq), and RNA expression (RNA-seq) in context and at the Hamp1 gene and promoter, and demonstrating location of amplified regions (−600 bp, −500 bp, −400 bp, −300 bp, −200 bp, exon1, intron1, exon2, exon3) used for subsequent qPCR analysis of ChIP experiments.b Six-to-eight-week-old C57Bl/6 male mice were administered Epo daily for 3 days 200 IU i.p. ChIP for regions of the Hamp1 gene promoter and body with analysis using qPCR for enrichment compared with input, for H3K9ac and H3K4me3 normalized to the % input detected at the promoter of Hprt1 (%input/ %input) and RNA pol II, and H3K27me3, n = 3 per condition. c Effects of four doses 200 IU Epo administration on expression of Hamp1 6 weeks post administration (n = 8 per condition). ChIP-qPCR demonstrating effects on histone activation marks H3k9ac (n = 3) or H3k4me3 (n = 4) at the hepcidin promoter 6 weeks following four doses 200 IU Epo administration to mice.d Six-week-old C57BL/6 male mice were given an iron-deficient diet for 2 weeks or a matched control diet. ChIP for H3K9ac and H3K4me3, normalized to Hprt. e Huh7 cells treated with either 24 h 18 nM BMP6, 500 nM LDN153189, or control. ChIP for H3K9ac at the HAMP locus, normalized to GAPDH locus. N = 3 biologic replicates. Epo erythropoietin, ID iron-deficient diet. Student unpaired t-test (mouse data), paired t-test (Huh7 cell data), bars are mean ± s.e.m. Data are means ± s.e.m. *P ≤ 0.05; **P ≤ 0.01; ***P ≤ 0.001; ****P ≤ 0.0001; NS, P > 0.05
mild ID, but importantly for a hormone mediating systemic iron
homeostasis, this suppression is reversible and does not result in
long-term gene
“silencing”.
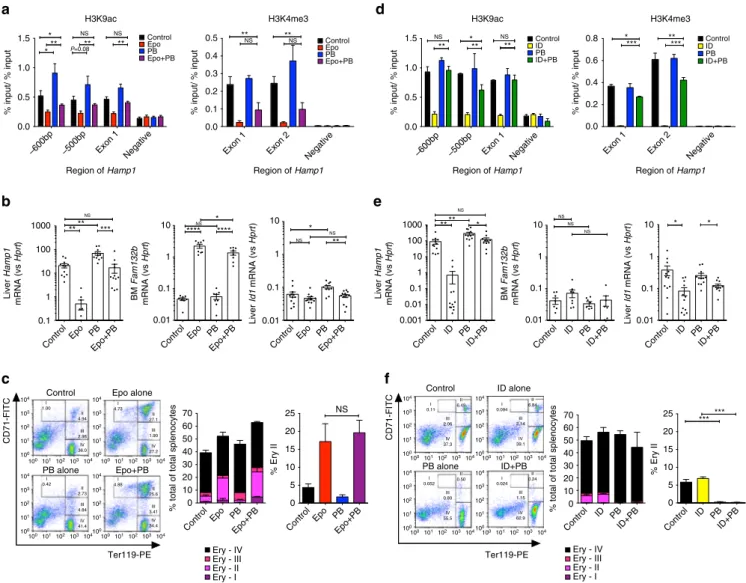
Histone deacetylase inhibition prevents Hamp1 suppression.
A gene’s histone acetylation profile results from the balance
between histone acetyl transferases (HATs) and HDACs
27. We
next sought to examine whether histone deacetylation in the
context of hepcidin suppression could be prevented by
co-administration of an HDAC inhibitor, and whether this would
affect hepcidin gene expression. The pan-HDAC inhibitor
Panobinostat (PB) has an IC50 in the nM range for most
HDACs
28. Mice co-administered 3 days each of Epo and PB 20
mg/kg/d was rescued from loss of H3K9ac at the Hamp1 locus,
while mice receiving PB alone displayed hyperacetylation
(Fig.
4
a). Partial rescue of H3K4me3 was also observed, consistent
with a degree of co-dependence of these marks, perhaps mediated
by effects of p300-dependent histone acetylation on
SET-mediated H3K4 trimethylation
29.
Rescue of histone deacetylation in mice co-treated with Epo
by PB was associated with increased hepcidin expression to
levels similar to control mice (Fig.
4
b). Hyperacetylation of the
hepcidin promoter in mice treated with PB alone (compared with
control) was associated with an increase in Hamp1 expression
over control and Epo + PB-treated mice, indicating some residual
suppression of hepcidin caused by Epo in this latter group.
Inhibition of hepcidin suppression occurred even though bone
marrow Fam132b was still upregulated by Epo in the presence of
PB. Although PB reduced spleen weight in non-Epo-treated mice
0.01 0.1 1 10 NS NS NS Control Epo+PB 0.1 1 10 100 1000 **** NS *** –600bp –500bp Exon 1 Negative 0.0 0.5 1.0 1.5 % input/ % input * ** ** NS ** NS H3K9ac Epo Control PB Epo+PB * P=0.08 Exon 1 Exon 2
Negative –600bp –500bp Exon 1 Negative Exon 1 Exon 2 Negative
0.0 0.1 0.2 0.3 0.4 0.5 % input/ % input Control Epo PB Epo+PB NS ** NS ** H3K4me3 0.001 0.01 0.1 1 10 100 1000 **** NS * 0.0 0.5 1.0 1.5 % input/ % input ** NS ** NS ** * H3K9ac Control ID PB ID+PB 0.0 0.2 0.4 0.6 0.8 % input/ % input Control ID PB ID+PB *** ** *** * H3K4me3 0.01 0.1 1 10 NS * **** **** 0 5 10 15 20 25 % Ery II NS 0 5 10 15 20 25 % Ery II *** *** Control Epo PB Epo+PB Control Epo PB Epo+PB Control ID PB ID+PB Control ID PB ID+PB 0 10 20 30 40 50 60 70
% total of total splenocytes 0
10 20 30 40 50 60 70
% total of total splenocytes
Ery - II Ery - III Ery - IV 0.01 0.1 1 10 * * 0.01 0.1 1 10 * NS NS ** I 1.00 II 4.94 III 2.98 IV 36.0 100 100101102103 104 100101102103 104 100101 102 103104 100101 102 103104 101 102 103 104 100 101 102 103 104 100 101 102 103 104 100 101 102 103 104 I 0.42 II 2.73 III 4.84 IV 41.4 I 4.73 II 27.1 III 1.90 IV 27.2 I 4.88 II 25.6 III 3.41 IV 34.4 I 0.11 II 6.49 III 2.06 IV 37.3 I 0.052 II 0.50 III 0.80 IV 55.5 I 0.024 II 0.24 III 1.15 IV 62.9 I 0.094 II 6.84 III 2.14 IV 39.1 CD71-FITC CD71-FITC
Control Epo alone
PB alone Epo+PB Control ID alone PB alone ID+PB Liver Hamp1 mRNA (vs Hprt ) Liver Hamp1 mRNA (vs Hprt ) BM Fam132b mRNA (vs Hprt ) Liver Id1 mRNA (vs Hprt ) Epo PB Control Epo+PB Epo PB Control Epo+PB Epo PB Control ID+PB ID PB Control ID+PB ID PB Control ID+PB ID PB BM Fam132b mRNA (vs Hprt ) Liver Id1 mRNA (vs Hprt )
Region of Hamp1 Region of Hamp1 Region of Hamp1 Region of Hamp1
Ery - I Ery - II Ery - III Ery - IV Ery - I Ter119-PE Ter119-PE 100101102 103104 100 101 102 103 104 100101102 103104 100 101 102 103 104 100101102 103104 100 101 102 103 104 100101102 103104 100 101 102 103 104
a
d
b
e
c
f
Fig. 4 Effects of Epo treatment or ID with PB co-administration. six- to eight-week-old C57Bl/6 male mice were treated with 200 IU Epo per day for 3 days with or without Panobinostat 0.4 mg (20 mg/kg) (a–c). a ChIP-qPCR data for hepatic H3K9ac and H3K4me3 at the Hamp1 locus, and b hepatic Hamp1 mRNA expression, bone marrow Fam132b mRNA expression, and hepatic Id1 mRNA expression. For a, N = 3–4 per group. For b N = 12 per group. (Three identical experiments comprising four mice per group were performed, and are presented here as combined data.)c Effects of Epo and PB on erythropoiesis. Examples offlow scatterplots of CD71 vs Ter119 from cells isolated from spleens from mice treated with each condition (Control, Epo, PB, Epo + PB) are shown, together with a summary of the effects of each condition on erythroblast maturation, with specific comparison of intermediate erythroblasts between groups (n = 4 per group). d–f Six-week-old C57Bl/6 male mice were given an iron-deficient diet for 2 weeks with or without Panobinostat 0.4 mg (20 mg/kg) for the last 7 days. Effects onc H3K9ac (N = 3 per group) and H3K4me3 (N = 2 per group), d hepatic Hamp1 mRNA expression, bone marrow Fam132b mRNA expression, and hepatic Id1 mRNA expression. (For d, N = 3–4 per group. For e N = 12 per group—three identical experiments comprising four mice per group were performed, and presented as combined data.)f Effects of ID and PB on erythropoiesis. Student’s t-test. Animals in this experiment are partially included in the Epo vs control data presented in Fig.1. Epo erythropoietin, ID iron-deficient diet, PB panobinostat. Data are means± s.e.m. *P ≤ 0.05; **P ≤ 0.01; ***P ≤ 0.001; ****P ≤ 0.0001; NS, P > 0.05
and ameliorated Epo-induced increases in spleen weight
(Supplementary Fig.
3
a), the increased intermediate erythroblast
population (Ery II) seen in mice treated with Epo was
similar between PB-treated and untreated populations (Fig.
4
c).
Intermediate erythroblasts strongly express Fam132b, and
Epo-mediated increased splenic Fam132b expression was not
affected by PB treatment (Supplementary Fig.
3
b). PB was
characteristically
associated
with
reduced
platelets
(Supplementary Fig.
3
c)
30, but did not affect Hb or mouse
weight (Supplementary Fig.
3
d, e). Although liver iron and Bmp6
expression were marginally increased in mice receiving Epo + PB
compared to Epo (Supplementary Fig.
3
f, g), serum iron, which
influences liver Bmp signaling
31, and expression of the Bmp
target genes Id1, Smad7, and Atoh8, was not increased (Fig.
3
b;
Supplementary Fig.
3
g, h).
When mice receiving a 2-week low-iron diet were co-treated
with PB 20 mg/kg for the
final 7 days, they likewise experienced
preservation of H3K9ac and partial restoration of H3K4me3 at
the hepcidin promoter (Fig.
4
d), and increased Hamp1 mRNA
expression to levels similar to mice receiving control diets
(Fig.
4
e). In these experiments, we again observed that mice
receiving PB alone experienced an increase in Hamp1 gene
expression compared with untreated controls and ID + PB mice,
indicating some residual suppression caused by ID in this group.
In ID mice, PB rescued Hamp1 expression but did not
significantly alter bone marrow Fam132b (Fig.
4
e). Bmp6 and
Id1 expression were unchanged between ID and ID + PB
conditions, while Smad7 expression was suppressed between
control and ID mice receiving either vehicle or PB (Fig.
4
e;
Supplementary Fig.
3
i). PB given for this longer time course
caused marginal weight loss in mice (Supplementary Fig.
3
j),
perhaps reflecting limited tolerability of this pan-HDAC inhibitor
at high doses
32. This course of PB decreased platelets and
marginally decreased Hb (Supplementary Fig.
3
k, l), and was
also associated with diminished numbers of intermediate
erythroblasts compared with PB untreated mice (although ID
itself had no effect on erythroblast populations) (Fig.
4
f).
However,
as
presented
above,
Fam132b
(produced
by
intermediate erythroblasts) is unnecessary for ID-mediated
hepcidin suppression. Although PB reduced spleen size in control
and ID mice (Supplementary Fig.
4
m), splenic Fam132b
expression was not significantly increased in iron-deficient mice
nor was it affected by PB treatment (Supplementary Fig.
3
n).
Mice receiving PB on ID diets have lower liver iron than mice
receiving PB alone (Supplementary Fig.
3
o). Spleen iron
content was reduced in ID mice, and raised in PB + ID mice
compared with ID alone (Supplementary Fig.
3
o), suggesting a
physiologic effect from increased hepcidin; this effect was not
seen when comparing Epo + PB vs Epo alone (Supplementary
Fig.
3
h). Together the data indicate that rescue of Epo-mediated
or ID-mediated suppression of hepcidin by PB is unlikely to be
due to effects of PB on either erythroferrone expression or the
liver Bmp pathway, respectively.
HDAC inhibition raises hepcidin in disease models. Next, we
evaluated the ability of PB to raise hepcidin in two disease models
of iron overload—HFE hemochromatosis and β-thalassemia.
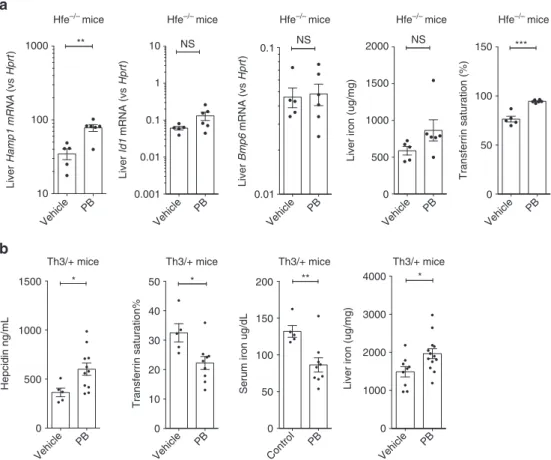
0 10 20 30 40 50 Transferrin saturation% * Vehicle PB Vehicle PB Vehicle PB Vehicle PB Vehicle PB Vehicle PB Vehicle PB Control PB Vehicle PB 0 500 1000 1500 Hepcidin ng/mL * 0 1000 2000 3000 4000
Liver iron (ug/mg)
* 10 100 1000 ** 0 500 1000 1500 2000
Liver iron (ug/mg)
NS 0.01 0.1 NS 0.001 0.01 0.1 1 10 NS 0 50 100 150 Transferrin saturation (%) *** 0 50 100 150 200
Serum iron ug/dL
** Liver Hamp1 mRNA (vs Hprt ) Liver Id1 mRNA (vs Hprt ) Liver Bmp6 mRNA (vs Hprt )
Hfe–/– mice Hfe–/– mice Hfe–/– mice Hfe–/– mice Hfe–/– mice
Th3/+ mice Th3/+ mice Th3/+ mice Th3/+ mice
a
b
Fig. 5 Effects of Panobinostat on hepcidin in disease models of iron overload. a Effects of 3 days 20 mg/kg/d i.p. PB vs control on 15-week-old HFE−/−on liver Hamp1 mRNA, Id1 mRNA, and Bmp6 mRNA expression; liver non-heme iron content, and transferrin saturation. b Effects of Panobinostat 5 mg/kg/d for 7 days on 8–24-week-old HbbTh3/+(Th3/+) mice on serum hepcidin levels, transferrin saturation, serum iron, and liver non-heme iron concentrations. Student’s t-test. Data are means ± s.e.m. *P ≤ 0.05; **P ≤ 0.01; ***P ≤ 0.001; ****P ≤ 0.0001; NS, P > 0.05
HFE-linked
hemochromatosis
is
an
autosomal
recessive
condition mediated by inappropriate hepcidin suppression
leading to excess iron absorption in the absence of increased
erythropoietic demand. The Hfe−/− mouse model recapitulates
the human phenotype of hepatic iron overload with relatively low
hepcidin levels
33. Treatment of Hfe−/− mice with PB (20 mg/kg
for 3 days) increased hepatic Hamp1 mRNA levels without
changing Bmp6 or Id1 mRNA (Fig.
5
a), although PB raised
transferrin saturation, perhaps reflecting PB-induced suppression
of erythropoiesis and decreased uptake of iron by the bone
marrow.
The Hbb
Th3+/−(Th3/+) mouse model of
β-thalassemia
intermedia exhibits ineffective erythropoiesis with anemia,
elevated Epo, splenomegaly, iron loading, and relative hepcidin
suppression
16,34. Th3/+ mice receiving PB 5 mg/kg/d for 7 days
had higher serum hepcidin compared with vehicle, and produced
a reduction in serum iron and transferrin saturation (Fig.
5
b),
indicating increased hepcidin levels were exerting a physiologic
effect on iron homeostasis. However, in these experiments PB
increased liver iron in Th3/+ mice, which might be explained by
suppression of erythropoiesis and hence increased hepatocyte
iron uptake. PB treatment was accompanied by a reduction in
mean Hb concentration from 8.6 to 7.5 g/dl and reduced
splenomegaly, and at this dose did not induce weight
loss (Supplementary Fig.
4
a–c). Flow cytometry of spleens from
Th3/+ mice treated with PB compared with vehicle showed
similar proportions of intermediate erythroblasts potentially
producing erythroferrone (gate III in analysis in Supplementary
Fig.
4
d), although proportions in other gates are altered
35.
Histone deacetylase inhibition raises HAMP mRNA in vitro.
The above data suggest that HDAC inhibition affects hepcidin
expression at least in part via direct effects on histone acetylation
at the Hamp1 locus, rather than through indirect effects on iron
and/or erythroferrone. To test this idea, we assayed for a direct
effect of HDAC inhibition on hepatic hepcidin expression in
isolated liver cells. We took advantage of BMPs as ligands for
the canonical signaling pathway that regulates homeostatic
hepcidin expression. In the
first model, we deployed precision cut
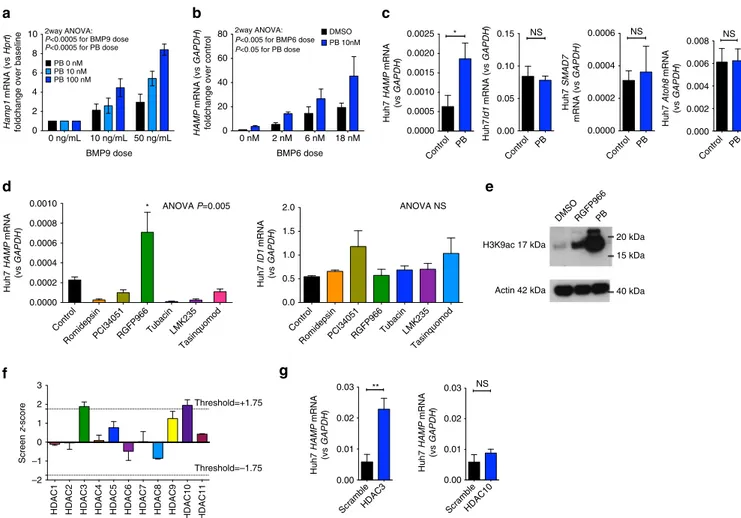
DMSORGFP966PB 20 kDa 15 kDa 40 kDa Actin 42 kDa H3K9ac 17 kDa 0 nM 2 nM 6 nM 18 nM 0 20 40 60 80 BMP6 dose DMSO PB 10nM P<0.005 for BMP6 dose P<0.05 for PB dose 0 ng/mL 10 ng/mL 50 ng/mL 0 2 4 6 8 10 BMP9 dose PB 0 nM PB 10 nM PB 100 nM P<0.0005 for BMP9 dose P<0.0005 for PB dose
HDAC1 HDAC2 HDAC3 HDAC4 HDAC5 HDAC6 HDAC7 HDAC8 HDAC9 HDAC10 HDAC11 –2 –1 0 1 2 3 Screen z -score Threshold=+1.75 Threshold=–1.75 0.00 0.05 0.10 0.15 NS 0.0000 0.0002 0.0004 0.0006 NS Control RomidepsinPCI34051RGFP966 TubacinLMK235 Tasinquomod 0.0000 0.0002 0.0004 0.0006 0.0008 0.0010 * 0.000 0.002 0.004 0.006 0.008 NS Control PB Control PB Control PB Control PB 0.0000 0.0005 0.0010 0.0015 0.0020 0.0025 *
ScrambleHDAC3 ScrambleHDAC10
0.00 0.01 0.02 0.03 ** 0.00 0.01 0.02 0.03 NS Control RomidepsinPCI34051RGFP966 TubacinLMK235 Tasinquomod 0.0 0.5 1.0 1.5 2.0 Hamp1 mRNA (vs Hprt )
foldchange over baseline HAMP
mRNA (vs
GAPDH
)
foldchange over control Huh7
HAMP mRNA (vs GAPDH ) Huh7 Id1 mRNA (vs GAPDH ) Huh7 SMAD7 mRNA (vs GAPDH) Huh7 Atoh8 mRNA (vs GAPDH ) 2way ANOVA: 2way ANOVA: Huh7 HAMP mRNA (vs GAPDH ) Huh7 ID1 mRNA (vs GAPDH ) ANOVA P=0.005 ANOVA NS Huh7 HAMP mRNA (vs GAPDH ) Huh7 HAMP mRNA (vs GAPDH )
a
b
c
d
e
f
g
Fig. 6 In vitro effects of PB on HAMP expression in liver-derived cells. a Effect of Panobinostat 10 and 100 nM on BMP9- (0, 10, and 50 ng/ml) induced Hamp1 expression (relative to Hprt) in mouse precision cut liver slices. Data are normalized to baseline (untreated cells). N = 3 separate experiments. Two-way ANOVA by BMP9 dose and PB treatment.b Effect of Panobinostat 10 nM and BMP6 (0, 6, and 18 nM) on HAMP expression (relative to GAPDH) in HuH7 human hepatoma cells. Data are normalized to baseline for each condition. N = 3 separate experiments. Two-way ANOVA by BMP6 dose and PB treatment.c Effects of PB treatment vs DMSO on HAMP, ID1, SMAD7, and ATOH8 mRNA expression in Huh7 cells, n = 3 separate experiments (same experiment as BMP6 0 nM condition fromb. d Effect on HAMP and ID1 mRNA of treatment with isoform-specific HDAC inhibitors in Huh7 cells. HDAC(s) targeted by each inhibitor presented in the text. N = 3 separate experiments. One-way ANOVA, t-test for comparison between RGFP966 and control.e Whole-cell H3K9ac in Huh7 cells treated with RGFP966 and PB. f Depiction of HAMP promoter luciferase activity from knockdown of each HDAC isoform in a previously published RNAi screen (two replicates per HDAC).g Validation of HDAC3 and HDAC10
knockdown effects on HAMP mRNA expression in Huh7 cells (n = 3 separate experiments, paired t-test). Data are means ± s.e.m. *P ≤ 0.05; **P ≤ 0.01; ***P ≤ 0.001; ****P ≤ 0.0001; NS, P > 0.05
mouse liver slices (PCLS) in vitro, in which liver cellular
architecture is preserved
36but effects of systemic iron status and
erythropoiesis are eliminated. PCLSs were treated with increasing
doses of PB and human BMP9, which we found to best increase
Hamp1 and Id1 mRNA expression in this model (Supplementary
Fig.
5
a). BMP9 increased Hamp1 mRNA and PB enhanced this
effect on Hamp1 expression (Fig.
6
a). Next, we used the Huh7
human hepatoma-derived cell line to evaluate the effects of PB on
hepatocytes alone in culture. PB treatment of hepatocyte-derived
Huh7 hepatoma cells increased HAMP expression at baseline and
also potentiated the increase of HAMP produced by exogenous
recombinant BMP6 (Fig.
6
b, c; Supplementary Fig.
5
b). These
effects of PB on HAMP expression were likely independent of
changes in BMP signaling, because PB did not alter baseline
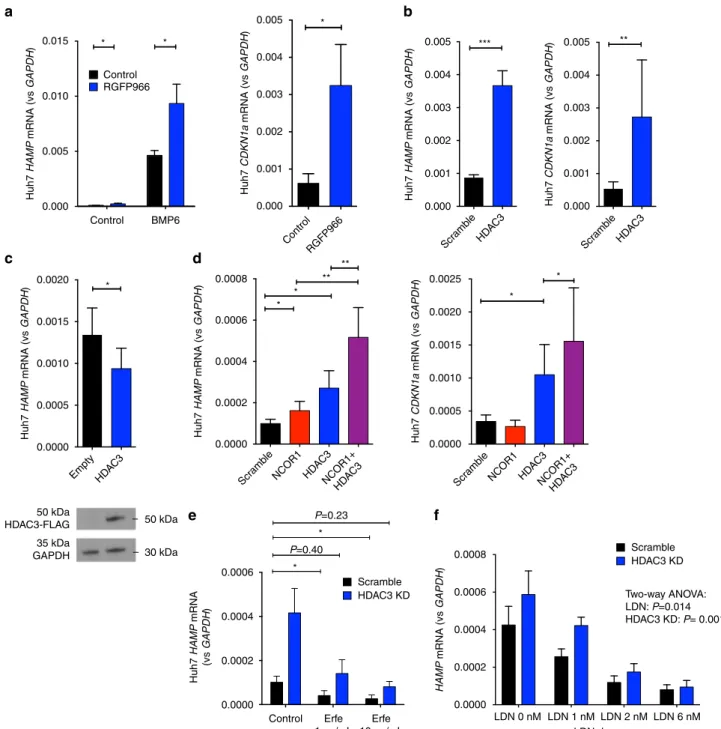
0.015 0.005 0.004 0.003 0.002 0.001 0.000 0.005 0.004 0.003 0.002 0.001 0.000 0.005 0.004 0.003 0.002 0.001 0.000 0.010 0.005 Huh7 HAMP mRNA (vs GAPDH ) Huh7 HAMP mRNA (vs GAPDH ) Huh7 HAMP mRNA (vs GAPDH ) Huh7 HAMP mRNA (vs GAPDH ) HAMP mRNA (vs GAPDH ) Huh7 HAMP mRNA (vs GAPDH ) Huh7 CDKN1a mRNA (vs GAPDH ) Huh7 CDKN1a mRNA (vs GAPDH ) Huh7 CDKN1a mRNA (vs GAPDH ) 0.000 0.0020 0.0008 0.0025 0.0010 0.0005 0.0000 0.0015 0.0020 * * * * ** ** 0.0006 0.0004 0.0002 0.0000 0.0006 0.0008 0.0006 0.0004 0.0002 0.0000 LDN 0 nM LDN 1 nM LDN 2 nM LDN 6 nM LDN dose 0.0004 0.0002 0.0000 Control Erfe 1 ug/mL Erfe 10 ug/mL * 0.0015 0.0010 0.0005 0.0000 50 kDa HDAC3-FLAG 35 kDa GAPDH 50 kDa 30 kDa Empty HDAC 3 Control Control Scr amb le Scramble NCOR1 HD AC 3 HDAC3 KD Scramble HDAC3 KD Two-way ANOVA: LDN: P=0.014 HDAC3 KD: P= 0.001 P=0.23 P=0.40 * NCOR1+ HD AC3 Scr amb le NCOR1 HD AC3 NCOR1+ HDAC 3 BMP6 Control RGFP966 RGFP966 Scr amb le HDAC 3 Scr amb le HD AC3 * * ** *** * *a
b
c
d
e
f
Fig. 7 Effects of HDAC3 inhibition on hepcidin expression. Effects of treatment of Huh7 cells with RGFP966 10µM on a HAMP (n = 6 separate experiments, paired t-test) and CDKN1A mRNA expression (n = 6 separate experiments, paired t-test). b Effect of knockdown of HDAC3 (using 100 nM siRNA) on HAMP and CDKN1A mRNA expression (n = 6 separate experiments, paired t-test). c Effects of overexpression of HDAC3 on HAMP mRNA expression (n = 5 separate experiments, paired t-test). Western blot for FLAG at 50 kDA (molecular weight of HDAC3). d Effects of single knockdown of HDAC3 and NCOR1 (using 50 nM siRNA) or double knockdown of HDAC3 + NCOR1 (50 nM each) on HAMP1 and CDKN1A mRNA expression, n = 6 replicates, ratio paired t-tests. e Effects of erythroferrone treatment in Huh7 cells with and without concurrent HDAC3 knockdown on HAMP mRNA expression, n = 3 separate experiments, comparing scramble + vehicle with HDAC3 knockdown + Erfe (1 or 10µg/ml) (two-way ANOVA for effects of HDAC3 and Erfe, paired t-tests for specific comparisons of interest). f Effects in Huh7 cells of LDN titrations (control, 1, 2, and 6 nM) with and without concurrent HDAC3 knockdown on HAMP mRNA expression, n = 6 separate experiments, two-way ANOVA for effects of LDN and HDAC3. Data are means ± s.e.m. *P ≤ 0.05; **P ≤ 0.01; ***P ≤ 0.001; ****P ≤ 0.0001; NS, P > 0.05
expression of ID1, SMAD7, and ATOH8 (Fig.
6
c), and did not
potentiate the expression of these genes by BMP6 (Supplementary
Fig.
5
b). These data indicate that HDAC inhibition enhances
hepatocyte hepcidin expression independently of iron status
and other hepatic and non-hepatic cell types and organs, and
independently of BMP signaling.
Screens implicate HDAC3/NCOR1 in hepcidin regulation.
We used Huh7 cells to investigate the specific HDAC(s) involved
in hepcidin regulation. First, we treated cells with a panel of
inhibitors that possess relative specificity for different HDACs.
We deployed inhibitors against HDAC1/2 (Romidepsin), HDAC3
(RGFP966), HDAC4/5 (LMK235), HDAC4 (Tasinquimod),
HDAC6 (Tubacin), and HDAC8 (PCI-34051). RGFP966 (50
µM)
but no other inhibitor enhanced HAMP expression, with no effect
on ID1 mRNA (Fig.
6
d) or expression of other BMP-regulated
genes (Supplementary Fig.
5
c). Treatment of Huh7 cells with
either RGFP966 or PB increased H3K9ac in whole-cell lysates
(Fig.
6
e). Next, we obtained data from a previously published
RNAi screen evaluating effects on hepcidin promoter activity
of knockdown of 19,599 genes
37, and plotted effects from
knockdown of HDAC1-11. In this screen, only knockdown of
HDAC3 and HDAC10 produced an increase in HAMP promoter
activity (above the threshold of a z-score
> 1.75 as defined by the
authors) (Fig
6
f). However, subsequent validation experiments
confirmed that knockdown of HDAC3 upregulated HAMP
expression, whereas knockdown of HDAC10 had no effect on
HAMP (Fig.
6
g; Supplementary Fig.
5
d).
The effect of RGFP966 on hepcidin expression was also
observed at a lower dose of 10
µM, at which concentration it
does not inhibit any other HDAC other than HDAC3
38.
RGFP966 (10
µM) increased HAMP expression both at
baseline and enhanced the effect of BMP6 on hepcidin
expression; as a positive control, RGFP966 also increased baseline
expression of the recognized HDAC3 target gene CDKN1A
(Fig.
7
a)
39. In complementary short interfering RNA (siRNA)
experiments, we confirmed that HDAC3 knockdown also
increased both HAMP and CDKN1A expression (Fig.
7
b), but
did not alter expression of BMP target genes ID1 and SMAD7
(Supplementary Fig.
6
a).
We then tested effects of HDAC3 overexpression in Huh7 cells
on hepcidin expression. Cells were transfected with plasmid
encoding HDAC3 under a CMV promoter and harvested after 48
h, at which point ~30% of cells were transfected in parallel
experiments with GFP-tagged plasmids, and FLAG-tagged
HDAC3 protein was readily detectable by western blot (Fig.
7
c).
Compared with empty vector controls, cells overexpressing
HDAC3 exhibited reduced HAMP expression (Fig.
7
c) but not
CDKN1A or BMP-regulated genes (Supplementary Fig.
6
b).
HDAC3 forms a complex with co-repressors, NCOR1
and NCOR2 (SMRT), which are required for deacetylase
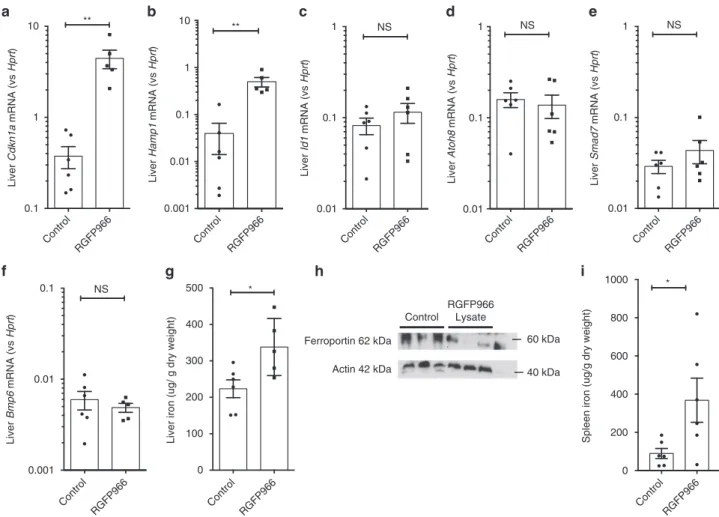
10 ** ** * NS NS * NS NS 10 Liver Cdkn1a mRNA (vs Hprt ) Liver Bmp6 mRNA (vs Hprt )
Liver iron (ug/ g dry weight) Spleen iron (ug/g dry weight)
Liver Hamp1 mRNA (vs Hprt ) Liver Id1 mRNA (vs Hprt ) Liver Atoh8 mRNA (vs Hprt ) Liver Smad7 mRNA (vs Hprt ) 1 1 1 1 1 0.1 0.1 500 1000 800 600 400 200 0 400 300 200 100 0 0.01 0.001 Control RGFP966 Control RGFP966 Control RGFP966 ControlRGFP966 Control
RGFP966 Control RGFP966 Control RGFP966 Control RGFP966
Ferroportin 62 kDa Control RGFP966 Lysate Actin 42 kDa 60 kDa 40 kDa 0.1 0.1 0.1 0.1 0.01 0.01 0.01 0.01 0.001
a
b
c
d
e
f
g
h
i
Fig. 8 Effects of HDAC3 inhibition in vivo on hepcidin expression in iron-deficient mice. Four-week-old C57Bl/6 mice were fed a low-iron diet (2 ppm) for 3 weeks, followed by two doses of RGFP966 2 h apart, and killed 2 h following the second dose. Effect on hepatica Cdkn1a, b Hamp1, c Id1, d Atoh8, e Smad7, andf Bmp6 mRNA expression, g liver iron. h Western blot for hepatic ferroportin expression. i Effect of RGFP966 on spleen iron. N = 6 per group. Data are means± s.e.m. *P ≤ 0.05; **P ≤ 0.01; ***P ≤ 0.001; ****P ≤ 0.0001; NS, P > 0.05
activity
40, 41. RGFP966 inhibits HDAC3 and NCOR1
42, raising
the possibility that NCOR1 is also involved in hepcidin
expression. Knockdown of either NCOR1 or HDAC3 individually
raised HAMP expression in Huh7 cells (Fig.
7
d). However,
simultaneous knockdown of NCOR1 together with HDAC3
augmented the increase in HAMP expression above that seen
with knockdown of either of these genes alone (Fig.
7
d;
Supplementary Fig.
6
c). These data suggest that hepcidin
expression is regulated by a complex comprising HDAC3
and
NCOR1.
We
observed
no
increase
in
CDKN1A
expression in knockdown of NCOR1 alone, but enhanced
expression above HDAC3 knockdown alone when double
knockdown was performed (Fig.
7
d). Combined knockdown of
HDAC3 and NCOR1 had no effect on SMAD7 expression
although in these experiments we observed upregulation of ID1
(Supplementary Fig.
6
c).
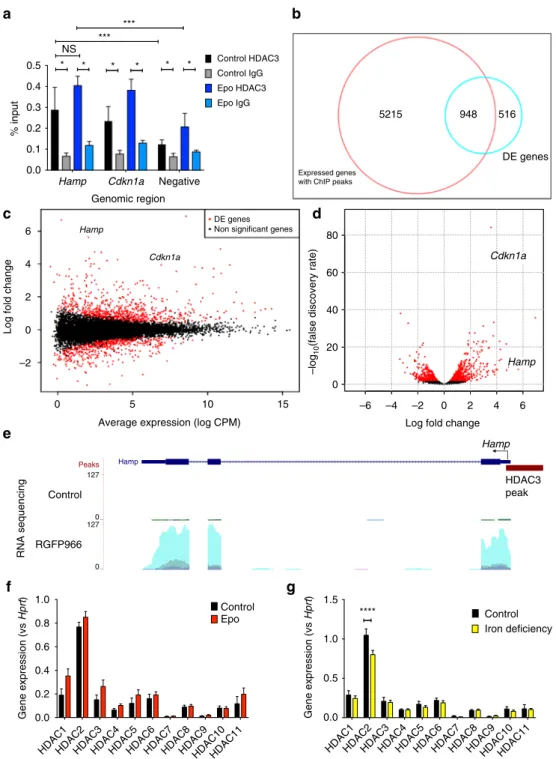
0.5 Control HDAC3 Control IgG Epo HDAC3 Epo IgG Expressed genes with ChIP peaks5215 948 516 DE genes * * * * * * NS *** *** 0.4 0.3 % input 0.2 0.1 0.0 80 Hamp Hamp Cdkn1a 60 40 –log 10
(false discovery rate) 20
0
–2 0 Log fold change
2 4 HDAC3 peak 6 –4 –6 4 6 2
Log fold change 0
–2 0 Control RGFP966 1.0 Control Control Iron deficiency 1.5 **** 1.0 0.5 0.0 Epo 0.8 0.6 0.4 Gene expression (vs Hprt ) Gene expression (vs Hprt ) 0.2 0.0
HDAC1HDAC2HDAC3HDAC4HDAC5HDAC6HDAC7HDAC8HDAC9HDAC10HDAC11 HDAC1HDAC2HDAC3HDAC4HDAC5HDAC6HDAC7HDAC8HDAC9HDAC10HDAC11
RNA sequencing 127 0 0 127 5 10 15
Average expression (log CPM)
Hamp Peaks Hamp Hamp Cdkn1a Cdkn1a Negative Genomic region DE genes Non significant genes
a
b
c
d
e
f
g
Fig. 9 Enrichment of HDAC3 at the hepcidin locus and effects of HDAC3 inhibition on genome-wide RNA expression profile. a Six-week-old C57Bl/6 male mice were administered Epo daily for 3 days 200 IU i.p. or control. ChIP-qPCR for HDAC3 (compared with IgG isotype control) at the hepcidin gene locus, along with the Cdkn1a locus as a positive control and a negative control genomic region. N = 3, paired t-tests. RNA sequencing of livers from mice treated with 3 weeks low-iron diet followed by either vehicle or two doses of RGFP966. Three biologic samples (those with the highest quality RNA) were selected for sequencing from each group.b Smear plot (log fold change vs expression levels), highlighting Hamp and Cdkn1a genes. c Volcano plot (P-value vs log fold change) highlighting Hamp and Cdkn1a genes. d HDAC3 ChIP-Seq peaks were annotated and compared to differentially expressed genes. Expression of each HDAC in 6-week-old mice treated withe Epo vs control, and f ID vs control. Significance testing adjusted for multiple comparisons. N = 8 per group, same mice as experiments presented in Fig.4
HDAC3 knockdown counteracts induced HAMP suppression.
We tested how suppressors of hepcidin expression (recombinant
erythroferrone and the ALK2/3 inhibitor LDN193189 (LDN))
interacted with HDAC3 inhibition. We found that relative to
untreated cells, both erythroferrone (Fig.
7
e) and LDN (Fig.
7
f)
inhibited hepcidin expression, while HDAC3 knockdown
(Supplementary Fig.
6
d) increased expression. The combination
of HDAC3 knockdown with either erythroferrone or LDN at 1
nM led to hepcidin expression levels similar to untreated
cells; higher LDN concentrations suppressed hepcidin even in
the presence of HDAC3 knockdown. HDAC3 inhibition
acted independently of effects on other BMP target genes
(Supplementary Fig.
6
e). Thus, HDAC3 knockdown counteracts
dose-dependent inhibition by physiologic suppressors.
HDAC3
inhibition
partly
rescues
ID-induced
Hamp1
suppression. Next, we studied effects of inhibition of HDAC3
on hepcidin expression in vivo. Mice received an iron-deficient
diet for 3 weeks, followed by two intraperitoneal injections of
RGFP966 20 mg/kg/dose 2 h apart, and were then killed 2 h after
the second dose; this time course was used because of the short
half-life of RGFP966 in vivo
38. This regimen induced hepatic
upregulation of the HDAC3-responsive gene, Cdkn1a (Fig.
8
a).
This was accompanied by upregulation of Hamp1 mRNA
expression (Fig.
8
b). Hepatic Bmp target genes (Id1, Atoh8,
and Smad7, Fig.
8
c–e) and Bmp6 expression itself (Fig.
8
f)
were not affected by RGFP966 treatment. HDAC3 inhibition
was
associated
with
an
increase
in
liver
iron
content (Fig.
8
g), although Perls’ stain of liver sections from
control (Supplementary Fig.
7
a) and RGFP966-treated mice
(Supplementary Fig.
7
b) did not demonstrate detectable liver iron
staining. Increased hepcidin expression was accompanied by
decreased ferroportin protein levels in the liver (Fig.
8
g) and
increased spleen iron (Fig.
8
i).
HDAC3 binds to the hepcidin gene locus. We sought to
establish whether HDAC3 may directly regulate hepcidin. Using
ChIP-qPCR in mouse liver we measured HDAC3 at the hepcidin
locus (near the transcription start site), using HDAC3 binding to
the CDKN1A gene locus as a positive control. These experiments
demonstrated that HDAC3 is enriched at the hepcidin promoter
(compared to HDAC3 binding at a negative control region) and
compared with an IgG isotype control antibody, and that binding
was similar to HDAC3 at the CDKN1A locus (Fig.
9
a). Treatment
of mice with Epo did not significantly alter HDAC3 enrichment
at the hepcidin (or CDKN1A) promoter.
Hepcidin is a key HDAC3 regulated gene in vivo. To establish
the specificity of effect of HDAC3 inhibition on hepcidin
upregulation, we performed RNA sequencing on livers of mice on
a low-iron diet or low-iron diet with RGFP966 as above. Hepcidin
was the third most differentially expressed gene (defined as
log fold change) (Fig.
9
b), with the 146th smallest adjusted
P-value (P
= 1.16 × 10
−8) (Fig.
9
c) out of 1464 differentially
expressed genes, supporting the idea that hepcidin is a
key HDAC3 regulated gene in vivo. A complete list of
differen-tially expressed genes is provided in the Supplementary Material,
and validation of top differentially expressed genes (B3galt1,
Igfbp1, Lcn2) is shown in Supplementary Fig.
7
d.
Next, we sought to establish whether HDAC3 peaks were more
commonly seen on expressed genes in the liver (as has
been observed in T-cells). We mined and re-analyzed publically
available HDAC3 ChIP-Seq data. After remapping the data on to
the mm10 mouse genome and performing peak calling, the list of
peaks was compared to genes identified by RNA sequencing to be
expressed (defined as expression above 1 count per million for at
least three samples across the two conditions) in the liver in our
experiments. We observed that expressed genes were more likely
to have an HDAC3 peak (defined as a peak called within 5 kb
of the transcription start site): odds ratio 8.3 (95% CI 7.8, 8.83),
P
< 10
−16,
χ
2-test, demonstrating that in the liver, HDAC3 binds
to expressed genes. Next, we tested whether effects of RGFP966
on gene expression were associated with HDAC3 binding.
We observed enrichment for genes with an HDAC3 peak
in genes differentially expressed by RGFP966 (odds ratio 1.32
(95% CI 1.18, 1.49), P
= 2 × 10
−6) (Fig.
9
d). These data confirm
that effects of HDAC3 inhibition on gene expression are
more common in genes sited at regions with genomic binding
of HDAC3.
Epo and ID do not alter hepatic HDAC3 expression. Finally,
we measured mRNA expression levels of all HDACs in control
mice vs mice receiving Epo, and control mice vs mice receiving a
2-week low-iron diet. We observed that HDAC3 is expressed in
the liver, although less so than (other Class I HDACs) HDAC1
and 2. Neither Epo nor ID produce a change in HDAC3 (or other
HDAC) transcription (Fig.
9
f). Among Class II HDACs, HDAC7
and HDAC9 expression is low.
Discussion
Suppression
of
hepcidin
can
be
physiologic,
facilitating
iron absorption and making recycled iron available for cells in
conditions of ID or stress erythropoiesis, but it can also be
harmful in patients with ineffective erythropoiesis due to genetic
conditions such as thalassemia or congenital dyserythropoietic
anemia, or due to genetic disruption of the hepcidin regulatory
pathways in hereditary hemochromatosis. Gene expression and
suppression are linked with characteristic post-translational
chromatin modifications. Here, we provide evidence that
dynamic changes in hepcidin expression induced by ID
and increased erythropoiesis are directly mediated by
hepcidin-associated chromatin acetylation. We also
find that hepcidin is
an HDAC3 regulated gene, and one of genes most differentially
expressed by HDAC3 inhibition.
To gain insight into the mechanisms of hepcidin suppression,
we used two in vivo models: ID induced by a low-iron diet,
and increased erythropoiesis caused by administration of Epo.
Suppression of hepcidin by stimulated erythropoiesis is at least
partly mediated by secretion of erythroferrone from intermediate
erythroblasts. Erythroferrone knockout mice fail to suppress
hepcidin when they undergo stimulated erythropoiesis
8, data that
we have recapitulated. An interaction between erythropoiesis and
ID to effect erythroferrone-mediated hepcidin suppression has
been proposed
43, and studies evaluating the role of erythroferrone
in ID have been called for
44. We found, using erythroferrone
knockout mice, that hepcidin suppression induced by low-iron
diet is erythroferrone-independent, and is associated with
reductions in BMP signaling.
Key histone activation marks include H3K9ac, which enhances
accessibility for transcription factor binding via electrostatic
opening of DNA from chromatin and by acting as docking
sites for proteins involved in transcription including SWI/SNF,
transcription elongation complexes, and HATs, e.g., p300
29.
H3K4me3 also enables gene expression by facilitating binding of
factors involved in transcription
45.
Our
data
indicate
that
for
both
ID
and
enhanced
erythropoiesis, suppression of hepcidin expression involves
reversible
erasure
of
histone
activation
marks
at
hepcidin-associated chromatin. We found that mice receiving PB
alone underwent hyperacetylation of the Hamp1 promoter (when
compared with untreated mice), and increased hepcidin gene
expression. HDAC inhibition in in vivo models of physiologic
and pathologic hepcidin suppression showed a consistent effect
in raising hepcidin levels. Treatment of thalassemic mice with
low-dose PB increased hepcidin levels and reduced serum iron
concentrations, indicating a physiologic effect on cellular iron
export. Hepcidin was also raised by PB in Hfe−/− mice. However,
PB elevated liver iron in the Th3/+ and Hfe−/− animals, limiting
its clinical value. PB also increased serum iron in the Hfe−/−
model. Similar effects were seen with the HDAC3 inhibitor
RGFP966 in iron-deficient mice. While the explanation
for increased liver iron is unclear, it may potentially be due to
suppressed erythropoiesis and therefore reduced iron uptake by
the marrow for heme synthesis. However, PB did not change
erythroid maturation and only slightly reduced bone marrow
erythroferrone expression in mice treated with Epo. Likewise, PB
and RGFP966 did not appear to affect BMP signaling given BMP
target gene expression was unchanged. Thus, effects of HDAC
inhibition on hepcidin elevation appear direct, and physiologic,
with reductions in ferroportin and increased spleen iron, while
elevations in liver iron remain difficult to explain and limit
potential clinical application at this stage.
A direct effect of HDAC inhibition on hepcidin expression was
supported by in vitro data indicating that pan-specific HDAC
inhibitors enhanced hepcidin expression without concomitant
increases in other BMP target genes in both primary
and immortalized hepatocytes. These
findings extend those of a
previous screen of 10,169 small molecules that identified a
pan-HDAC (vorinostat) as one of 16 compounds capable of
upregulating hepcidin expression and reporter activity
24, and
recent data showing HDAC inhibitors can elevate hepatic HAMP
expression in vitro
25. Collectively, these data indicate that HDAC
inhibition directly affects hepcidin expression.
We hypothesized that a specific HDAC might be responsible
for control of hepcidin. We combined a panel of inhibitors with
relative specificity for different HDACs and a gene-specific RNAi
approach to investigate which HDAC(s) contribute to hepcidin
regulation. Both of these approaches independently found
that HDAC3 inhibition increased hepcidin expression in vitro.
Furthermore, HDAC3 knockdown counteracted erythroferrone
and LDN193189 (BMP signaling inhibitor)-mediated suppression
of hepcidin, and conversely, HDAC3 overexpression decreased
hepcidin
expression.
HDAC3
inhibition
also
selectively
increased hepcidin expression in vivo in iron-deficient mice
without
altering
expression
of
Bmp6
or
Bmp
target
genes. HDAC3 is essential to the regulation of a range of hepatic
processes, including gluconeogenesis
46and lipid metabolism
47.
Our ChIP-qPCR data confirmed that HDAC3 is enriched at the
hepcidin locus. RNA sequencing demonstrated that hepcidin is
one of the genes most differentially expressed in livers of mice
treated with an HDAC3 inhibitor. Analysis of RNA-Seq and
HDAC3 ChIP-Seq confirmed that HDAC3 is enriched at genes
differentially expressed by RGFP966.
HDAC3 binds to promoter regions of active genes and regulate
their acetylation and hence expression levels
48. The histone
deacetylation function of HDAC3 is contingent on its interaction
with at least one of two co-repressors, NCOR1 and SMRT
(NCOR2)
41. Effects of HDAC3 on histone acetylation and hepatic
metabolic processes have been identified to be both deacetylase
dependent (likely contingent on NCOR1) and deacetylase
independent
49. Our study extends the functions associated with
HDAC3 and its cofactor NCOR1 to include regulation of
iron homeostasis via hepcidin. While inhibition of HDAC3
raises hepcidin expression in vitro and elevates hepcidin
expression in iron-deficient mice, erythropoiesis and ID do not
appear
to
change
hepatic
HDAC3
transcription,
and
erythropoiesis does not affect localization of HDAC3 to the
hepcidin
locus.
Thus,
we
hypothesize
that
HDAC3
is
necessary but not sufficient in itself to effect changes in hepcidin
transcription. Instead, changes to HDAC3 function relating to
interaction with cofactors in its complex (e.g., NCOR1)
may mediate effects on histone acetylation and gene expression
due to erythropoiesis and ID. Although we have not yet been
able to demonstrate clinical benefit, targeting of HDAC3 or
cofactors in the future may have therapeutic potential.
Conversely, HDAC3 inhibition has been proposed for treatment
of neurocognitive disorders
38and cancer; our data indicate
such treatments may also have implications of iron metabolism.
Interestingly, hepatic HDAC3-NCOR1 is known to regulate
circadian processes;
50it would be of interest to discover
whether the well-characterized diurnal variation in serum iron
and hepcidin
51may also be mediated by this complex.
Expression of the master iron regulatory hormone hepcidin is
regulated by histone acetylation state at its locus. Suppression of
hepcidin by either ID or enhanced erythropoiesis converge by
altering epigenetic marks on promoter-associated chromatin.
Hepcidin suppression is pathological in the common disorders
of hereditary hemochromatosis and thalassemia and relieving
histone deacetylation in models of these disorders rescues
hepcidin expression although we were not able to confirm
functional benefits on liver iron overload in these systems.
HDAC3
binds
to
the
hepcidin
promoter,
and
the
HDAC3–NCOR1 complex is likely responsible at least in part for
regulation of hepcidin. These new insights indicate a role for
epigenetic regulation in systemic iron homeostasis.
Methods
Mice. Wild-type male C57Bl/6 mice were purchased from Harlan Laboratories, UK. Animals were housed in individually ventilated cages in the Department of Biomedical Services, University of Oxford, and provided access to normal chow (188 ppm, SDS Dietex Services 801161, other than for dietary iron manipulations) and water ad libitum. For Epo treatments, mice were injected intraperitoneally with 200 IU recombinant human Epo (AbD Serotec) in water daily. For iron-deficient diet experiments, mice were administered a 2–6 ppm iron diet (Harlan UK, TD.99397) or a control 200 ppm iron diet (Harlan TD.07801). Embryos from Fam132b+/− mice on a mixed Sv129/C57BL/6 background were obtained from the Mutant Mouse Regional Resource Center (MMRRC) at UC Davis (strain B6;129S5-Fam132btm1Lex/Mmucd, ID MMRRC:032289-UCD) and rederived. Heterozygote pairs were mated to generate homozygous animals from which knockout and wild-type colonies were maintained. Hfe−/− mice on C57Bl/6 background52were bred at the Instituto de Biologia Molecular e Celular animal facility. Animals were housed in a temperature and light-controlled environment, with free access to standard rodent chow (Harlan 2018S, containing 200 ppm iron) and water. PB was administered to male mice aged 15 weeks. Animals were cared for according to local ethics regulations. In Oxford, animals experiments were undertaken under a Home Office Project License 40/3636. In Portugal, animal experiments were approved under Federation of European Laboratory Animal Science Associations criteria for the care and handling of laboratory animals. Experimental procedures were approved by the Instituto de Biologia Molecular e Celular Animal Ethics Committee. Hbbth3/+(th3/+) female mice (C57Bl/6 background) were as follows:
Cell culture. HUH7 cells (an immortalized human hepatoma cell line53) were cultured in Dulbecco’s Minimum Essential Medium supplemented with 10% fetal calf serum, 1% Glutamine, and 1% Penicillin/ streptomycin, and were plated and treated as described in the text. Huh7 cells were a kind gift of Prof Persephone Borrow, University of Oxford.
Precision cut liver slices. PCLS were cultured up to 24 h in 12-well plates with William E + Glutamax (Gibco, Grand Island, New York, USA), supplemented with 14 mMD-Glucose (Merck, Darmstadt, Germany) and 50µg/ml gentamicin (Gibco, Grand Island, New York, USA) at 37 °C in an O2/CO2incubator (MCO-18M, Sanyo, USA), which was continuously shaken at a speed of 90 rpm and saturated with 80% O2and 5% CO2. PCLS were treated as described in the text. Experiments using mice as a source for precision cut liver slices were approved by the Animal Ethical Committee of the University of Groningen, Netherlands36.