MASTER IN FINANCE
▪ The focus on the decarbonization, by reducing CO2 emissions in the energy industry and implementing constraints to fossil fuel sources of energy, is leading to more favourable economic adjustments and positive prospects of renewables. ▪ Trump’s election brought a lot of uncertainty to the renewables market, which was aggravated with the withdrawal of US from the Paris Agreement, but the majority of the states have clear goals towards renewable energy, namely through Renewable Portfolio Standards (RPS) that benefit companies like EDPR.
▪ Wind and solar energy are becoming less dependent on subsidies or government incentives, mostly due to technological improvements which have enabled the drop of capex, allowing renewables to be more competitive on their own. The US have inclusive, started the phase-out of PTCs and ITCs.
.
“EDP
R
ENOVÁVEIS
”
C
OMPANY
R
EPORT
“U
TILITIES
”
26
N
OVEMBER2018
S
TUDENTS:
A
NAQ
UINTINO&
C
AROLINAC
EREJO[email protected]//[email protected]
Moving into a green future
Driven by technology improvements
Recommendation: BUYVs Previous Recommendation HOLD
Price Target FY19: 9.16 €
Upside/Downside +17%
Price (as of 4-Jan-19) 7.84 €
Bloomberg: EDPR PL
52-week range (€) 6.77-9.17 Market Cap (€m) 6835 Outstanding Shares (m) 872.3
Source: Bloomberg; Nova Equity Research
Source:
(Values in € millions) 2017 2018E 2019F Revenues 1602 1758 1925 EBITDA 1366 1463 1630 Net Profit 456 551 635 Net Debt -4694 -4669 -5370 EPS 0.32 0.38 0.44 P/E 23.9 20.5 17.8 Source: Nova Equity Research
Company description
EDP Renewables operates in the energy sector generating electricity using renewable sources as solar and wind power. It is present in 11 countries namely Spain, Portugal, France, Italy, Romania, Poland, Belgium, USA, Canada, Mexico and Brazil. According to our estimations, the Enterprise Value is 15 210€ million, representing an Equity Value of 7 974€ million. The share price is 9.16€, so currently EDPR is undervalued. Existing capacity and pipeline represent 7.97€ and 1.2€ of the share price, respectively.
▪ China Three Gorges announced a voluntary public tender offer over EDP (at premium) and EDPR (at discount). Both companies have advised investors against it, since the proposal does not reflect the true values of either firms. If the offer moves forward, CTG already stated that EDPR will continue to be listed.
“EDPRENOVÁVEIS” COMPANY REPORT
Table of Contents
COMPANY OVERVIEW ... 2
STRATEGY ... 3
SHAREHOLDERS STRUCTURE ... 4
MARKET OVERVIEW ... 5
VALUATION METHODOLOGY ... 7
LOAD FACTOR ... 8 SELLING PRICE ... 9 CAPEX ... 12 OPEX ... 13 WACC ... 14REGULATORY FRAMEWORK ... 15
RISK ANALYSIS ... 22
MULTIPLES VALUATION ... 25
APPENDIX ... 26
REPORT RECOMMENDATIONS ... 30Company overview
Chart 1: Weight per segment in total“EDPRENOVÁVEIS” COMPANY REPORT
EDP Renewables operates in the energy business and is responsible for the development, construction and operation of wind farms and solar plants to generate and deliver clean electricity. It is spread over 11 countries all around the world, namely, Spain, Portugal, France, Italy, Belgium, Romania, Poland, USA, Canada, Mexico and Brazil.
The company was founded in 2007 to manage and operate the growing renewable assets the parent company, EDP, had in its portfolio. By then, EPDR had 3.6GW installed between Iberia and US, where it established activity through the acquisition of Horizon Wind Energy taking advantage of the installed capacity across the country as well as the expertise and knowledge about the US energy market. In 2008, EDP executed an IPO of 20% of its subsidiary, and the stock is now listed and traded on Euronext Lisbon.
Nowadays, EDPR is the fourth largest wind energy producer; it employs 1220 people and manages a portfolio of almost 11GW, between wind and solar plants, representing a growth of 200% within the past 10 years in terms of installed capacity.
Strategy
EDPR’s strategy lays under three pillars: Selective Growth, Operational Excellence and a Self-Funding Model.
The company selects its investments based on their suitability in the low risk profile of EDPR. The energy market is highly volatile and electricity prices are constantly shifting, that is why EDPR privileges projects with long-term PPAs or long-term contracts awarded (this topic is developed in detail in the Risk Analysis section). The company is also focused in diversifying its portfolio by including solar and offshore energy.
In terms of operationality, the O&M activities are a major concern, and the company has established programs to insource some activities to reduce these costs, which have been inconsistent in the past years, but we estimate a permanent downsize. To achieve the operational excellence the load factor is also an issue. EDPR’s goal is to keep increasing the load factor year after year on the back of the increase competitiveness of new Chart 2: Evolution of Installed capacity
per company in GW (Wind and solar)
Source: Companies Reports Source: EDPR Annual Report 2017
Chart 3: Evolution of O&M costs per segment (€/MW)
Source: Nova Equity Research
“EDPRENOVÁVEIS” COMPANY REPORT
capacity additions, that rely on development and design from the engineers but also on technology disruptions.
EDPR finances itself considering the heavy investments wind and solar plants require. Its strategy relies on a self-funding model which includes Retained Cash Flow (RCF), which represents the amount available to pay dividends or to fund new investments, since the payout ratio is 35%, most of the RCF is directed to financing projects. A second method is through asset rotations that consists on selling minority stakes in assets and reinvest the proceeds in another project. Finally, EDPR relies on US Tax Equity structures that enable it to take advantage of the tax benefits generated by the project in an efficient way.
Shareholders structure
EDP is the main shareholder with 82.6% of share capital and voting rights since 2017, followed by MFS Investment Management, an American asset management company, with 3.1%, and the remaining shares are spread by about 33 500 investors. In 2017, EDP bought an additional 5% of the shares through a voluntary public tender offer. EDP’s offer included 196 million shares of EDPR per 6.75€ a share, corresponding to the remaining 22% of the capital it did not control. Even though it represented a premium of 10.5% over the average price of the previous six months, the offer was not able to convince all investors, leaving EDP with only 82.6% of the subsidiary, below its target of 90% which would have allowed the merger and the delisting of EDPR from the PSI20. After the buyback, also motivated by the low liquidity of EDPR, in the end of the third trimester, as we can see from Chart 6, the share price of EDPR increased, followed by a downward trend in the next few months.
In May 2018, China Three Gorges (CTG) announced the intention of a public tender offer over EDP and EDPR, which is currently being revised by the proper authorities. CTG is offering 7.33€ per share, representing a discount of 6.5% (by the time of the announcement) to which the CEO has already advised investors, in case the offer moves forward, not to sell, as the price does not reflect the reality of the company.
Source: EDPR Annual Report 2017
Chart 5: Shareholder structure
Chart 6: Evolution of share prices (€)
Source: Blomberg
Source: EDPR Annual Report (2014- 2017) and Nova Equity Research
“EDPRENOVÁVEIS” COMPANY REPORT
Market Overview
We live in an era where environmental sustainability is a major concern and the past decades have been crucial to increase governments’ concerns regarding the way energy is produced, as well as raise awareness in society towards this matter. Therefore, from a sustainability perspective renewable energy is the future and considering past years trends and forecasts from GWEC, wind and solar energy will keep increasing all over the globe. The European Commission is focused on changing the paradigm towards electricity production which still heavily relies on fuel fossil resources like coal or CCTG. With this in mind, EU has established policies and ambitious targets for renewables, such as increase their presence in the energy mix to 20% and 32%, for 2020 and 2030, respectively. Other targets are related to the reduction of greenhouse gas and the improvement of energy efficiency. In 2017, wind energy provided the largest contribution, supplying about 75% of the demand. By 2016, some of the country members had already surpassed their targets for 2020, like Romania and Italy, while others still struggling to achieve the proposed goal, namely, Poland.
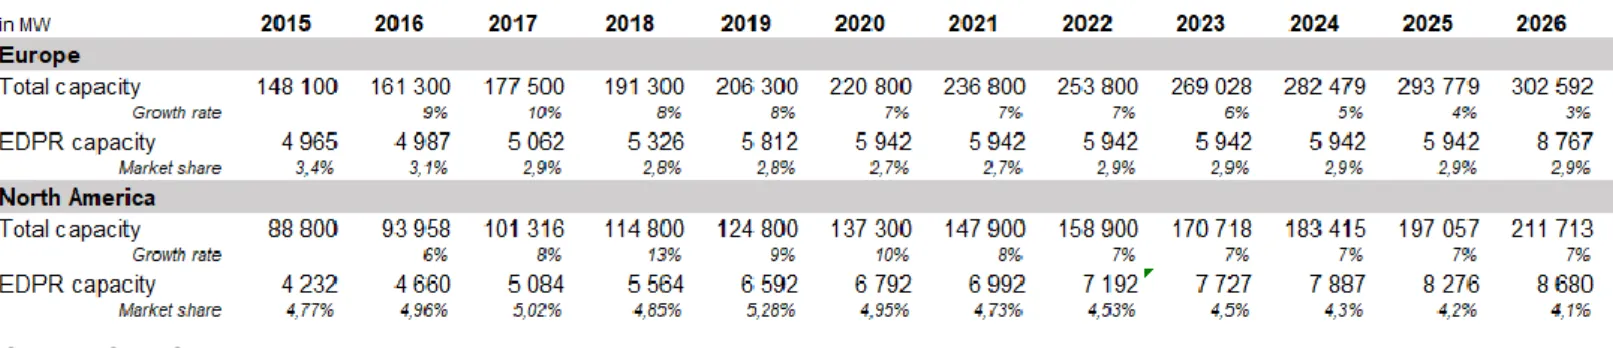
Currently, Europe is the second largest player in terms of installed capacity with 191GW expected for 2018, and according to Global Wind Energy Council (GWEC) until 2022 it will grow 33%. Such evolution is quite significant since Europe represents about half the business of EDPR. For 2030, Wind Europe estimated three possible scenarios, a pessimistic with 256GW, a central with 323GW, and an optimistic for 397GW of cumulative wind. We made our projections for the central scenario as growth is more likely to steadily slowing down, following the downward trend of 2015-2022. Otherwise, for the optimistic scenario market would have to grow at a rate of 7% until 2030 which we believe is too high. On the other hand, North America also plays a critical part for both the company and the industry of wind energy, with an expected growth for the following years of 38%. The US Energy Department estimates that by 2030 there will be 300GW spread across the country, against the current 115GW. However, there are big discrepancies among the different states, while Texas gathers a quarter of the total energy produced; there are 11 states with no installed capacity or near to nothing, such as Florida, Georgia and Alabama.
Source: European Commission
Chart 7: Renewables Share in 2016 vs 2020 National Target
Chart 8: Wind capacity forecast by region (GW)
Source: Global Wind Report 2017 (GWEC)
“EDPRENOVÁVEIS” COMPANY REPORT
This major gap between the Southeast states and the rest of US may rely on the intensity of the wind which is lower in these states, but also the policies and incentives, namely, Renewable Portfolio Standards (RPS) and Production Tax Credit (PTC). The first one requires a minimum amount of electricity to come from renewable, setting penalties to those that do not accomplish them, while PTC attributes benefits for wind energy installation during the first 10 years of the asset’s life. These policies will be explained in detail on the Regulatory Framework section of the report. Another concern regarding the US is the consequences of the Trump administration. It is well known that Donald Trump is in favour of the non-renewable sources of energy and has reverted some of the progress made by previous administrations towards green energy. He has already implemented some measures like cutting the Department of Energy's renewable energy research programs and applying a 30% tariff over imported solar panels. These measures go against and may affect the target the White House established for 2050, and to have 35% of energy coming from wind.
Brazil as an emerging market has a more recent renewable activity which is reflected on the lower targets for 2020 and 2030 comparing to EU or North America, 10% and 20%. Due to its natural resources and tropical climate, most of the energy produced comes from hydropower, and the system is heavily dependent on it, but the government wants to revert this situation by diversifying the power mix with more wind and biomass to reduce the risk of shortages caused by droughts.
We estimated the capacity for the years between 2022 and 2030, according to the expected MW for Europe and North America for 2030, of the Wind Europe scenario and the US Department of Energy respectively. Table 1: EDPR capacity and market share in Europe and North America
“EDPRENOVÁVEIS” COMPANY REPORT
Valuation Methodology
For the present equity research, in order to achieve a trustworthy share price, we relied on the Discounted Cash Flow (DCF) model, which required us to estimate each caption of the financial statements, considering all the relevant past information, as well as our predictions mostly related to installed capacity, load factors and selling prices for the future. As we go further in time, our estimations are based on trends and regulations regarding the renewable energy market as a whole.
The company was divided by geographical segments to properly understand the dynamics of EDPR and to facilitate the estimations, since each segment has specific aspects that have to be considered and handled differently region by region. These are, Spain, Portugal, Rest of Europe onshore (includes France, Belgium, Poland, Romania and Italy) and offshore, North America (USA and Canada), Brazil and Mexico. The segments with more expression in EDPR are Spain and North America, which is where the company has more installed capacity, including wind and solar parks.
Besides this division, we have to consider another one concerning the Enterprise Value, resulting from the sum of the Existing Capacity and Pipeline. The Existing Capacity considers the cash flows generated by the capacity EDPR has already in place and under construction during each project lifetime (30 years for wind and 25 for solar and offshore). To point out that at the end of each project´s life, there are three alternatives: either EDPR sells the parks, repowers the wind turbines to bring them back to active, or it proceeds to the decommissioning of the site, meaning, dismantle everything so the landscape returns to its original state. The last two options have associated costs; however, decommissioning is way costly with no future return. To understand if repowering was a suitable strategy, we calculated the NPV per MW, since it yielded positive values for the different geographies, we considered repowering as EDPR strategy when parks reach the end of their useful life-time.
Moreover, we shall account for the capacity to be installed in the future, under pipeline, considering the new additions until 2030 in Europe and North America based on EDPR market share in these markets. To assess the future market shares we analysed past market shares and assumed a Chart 9: Installed Capacity per
segment (MW)
Chart 10: New Capacity per segment – Existing/Under Construction (MW)
Chart 11: New Capacity per segment – Pipeline (MW)
Source: Nova Equity Research Source: EDPR Annual Report (2014- 2017)
“EDPRENOVÁVEIS” COMPANY REPORT
reduction due to the entrance of more players in the market, and big utility companies betting more on wind. Also, we took into account the possible effects of market regulations in the capacity to be installed in the future.
Load factor
When it comes to energy production, one of the most important aspects to bear in mind and that will determine the performance and directly impact the production of wind and solar energy, in the case of EDPR, is the load factor. To understand how the load factor will evolve through time we have to clarify what it depends on. Hence, the load factor is a design output, it does not entirely depend on the intensity, gusts and turbulence of the wind, because for a turbine with 30 years of lifetime there will be weather variations that in the end will average out. What also determines the wind production is the design of the turbines, namely the blades. Usually, a high load factor is connected to the length of the blades, the longest they are the better. But it is also directly linked to the rotor dimensions and hub height. However, there is another aspect that has implications on the level of power generation, which is maintenance. The developer will account for the down time when estimating the load factor; nonetheless, wind turbines may unexpectedly need some maintenance and repairs, reducing the production of energy.
As an engineering measure it is subject to improvements just like any other technology, as we can see from charts 12 and 13, the evolution in the industry is significant with yearly progresses. Therefore, when EDPR installs a new wind park, the associated load factor will be higher in comparison to previous ones because technology has evolved in the meantime. EDPR can also save in O&M costs, since the turbines will not require so much maintenance. In 2020 EDPR expects its load factor to be 33%, on average, but our estimations are less optimistic pointing to only 32%. This increase (+1%) is justified by new installations, about 2.7 GW between 2017 and 2020, leading to increments in the load factor. In Brazil and Mexico this value driver is quite superior to Europe´s, which can be explained by the small seniority of these parks comprising different technology, better concerns with effectiveness of power generation but mainly due to the natural resources these countries offer.
Chart 12: Evolution of Average Rotor Diameter and Hub Height
Chart 13: Evolution of Hub Height
Source: Wind Technology Market Report 2017
Source: Wind Technology Market Report 2017
“EDPRENOVÁVEIS” COMPANY REPORT
Selling price
Just as any other industry the selling price is perhaps the most important value driver, it is what will define the revenues and it requires a deep exercise to achieve the best estimate. In EDPR the selling price is dependent on different factors such as the price of electricity, current and future regulations of each country, and even within the same country, for the same type of energy, there are distinct pricing rules. The trend points to a downward in the curve of electricity prices due to the rise of renewables in the energy market that comprise a much lower marginal cost, nearly zero.
In Spain, the selling price is derived from the pool price which is a function of the different types of energy prices, hydro, gas, wind, coal, nuclear, etc, being hydro energy the most determinant factor of the pool price due to its low marginal cost, meaning, higher the percentage of hydro in the mix, the lower is the pool, and vice-versa. Bearing this in mind, the increase in prices verified in 2017 the was the result of the severe drought Iberia was under.
Regarding the forecast of the pool price we based our estimation in the electricity future prices that were available in the OMIP1 for the next 5
years. For the long-term we assumed the pool would not be far away from the 2023 future price. Since we are looking into a renewable’s company, we considered a realized pool price which represents around 90% of the pool to reflect the issue associated with wind energy. The fact that this type of energy has to be dispatched as soon as it is generated since there is no storage option, therefore it goes straight to the grid and it is sold at around 90% of the current pool, so it does not have a fixed price. In addition, the Spanish government provided a remuneration complement per MW installed until 2013 for the first 20 years of the asset, meaning that by 2033 EDPR will no longer benefit from it. We will discuss in detail this matter in the Regulatory Framework section.
In Portugal, EDPR presents three different pricing schemes related to the capacity installed by EDPR, the ENEOP (a consortium between EDPR, ENEL and Generg) and the assets from the Ventinveste, a consortium between Galp and Martifer, from whom EDPR bought 218MW, that started generating energy in 2018.
Chart 15: Evolution of Remuneration to Investment in Spain (million €)
Source: Nova Equity Research
Chart 14: Iberia Pool Price (€/MWh)
“EDPRENOVÁVEIS” COMPANY REPORT
We estimated for this “Initial wind” a selling price of 101€/MWh and 90€/MWh, in 2018 and 2019, respectively. The prices were computed considering two different time frames: capacity installed before and after 2012, year when the legislation of renewable prices changed. For production resulting from capacity installed until 2012, the prices were based on a Feed-In-Tariff (FIT), a common regime due to its simplicity and visibility for investors, where generators receive a fixed payment for each unit of electricity generated regardless of the market price. In Portugal, the FIT was updated to inflation during the first 15 years of the asset’s life. In 2012, with a new agreement over renewables, the government allowed companies to extend the tariff for 7 more years, but with a cap of 98€/MWh and a floor of 74€/MWh evolving with inflation, in exchange for a payment of 5.8€/MW between 2013 and 2020. For the remaining life of the assets, prices follow the pool price in Iberia. For parks installed after 2012, the generated production is not eligible for FIT scheme anymore, so the prices per MWh converge to the market prices. Regarding the ENEOP, in 2015 EDPR consolidated its 40% position in the consortium and added 613MW to its portfolio. For 2019, we expect a price of 76€/MWh, derived from the fixed initial price of 74€/MWh with CPI (Consumer Price Index) monthly updates for the first 20 years, converging to the market price until the end. For the Ventinvest, the price was settled through an international tender at 68€/MWh for 20 years, the last 10 years follow the market prices.
For the Rest of Europe, most MW installed by EDPR was through auctions and tenders, and we expect that more and more contracts will be based on them, like in US. Therefore, it is to be highlighted that we did not consider prices to be adjusted at inflation since all selling prices are settled through competitive tenders in order to offer a certain level of return, usually agreed with the government. Meaning, the prices are defined before-hand for the first 20 years of the asset’s life. As new capacity is put in place the prices tend to decrease since recent auctions are settled at lower prices compared to previous ones, when there are no additions, we assumed prices would be flat converging to the market price after 20 years. We assumed the market price in Europe would not be too far from the long-term Iberia pool price, between 48€/MWh and 50€/MWh. Some countries attribute Green Certificates, that we assume will remain constant in future, so they will not have a relevant impact on the price estimation.
Regarding the evolution of prices, in Poland and Romania, we estimate a stiff decrease on the selling prices for the next year due to the trend the Chart 17: Selling price in Poland and
Romania (€/MWh)
Source: Nova Equity Research
Chart 16: FIT for park installed in 2010 in €/MWh
“EDPRENOVÁVEIS” COMPANY REPORT
countries are lately facing, to 45€/MWh and 52€/MWh, in 2018. Even though, there are no assets under construction, a new legislation was put in place in 2017 and we believe it will impact negatively the prices, as it is proven by the 9 months results.
As for Italy, since new capacity will be added from 2018 to 2020, the downturn in prices is mostly explained by it. Besides, according to the company quarter results the price has decreased 6% (from 2017 to 2018). In France and Belgium, the pricing situations are more stable for the next years so prices will not differ a lot from the ones verified in 2017.
In North America, EDPR has most of its installed MW under PPA, where the power purchaser buys energy, and sometimes also capacity and/or ancillary services, from the electricity generator (EDPR) at a fixed price per MWh, this way EDPR is able to hedge against movements in electricity prices and REC (Renewable Energy Certificates). Nonetheless, the company has capacity under merchant prices which are more volatile and comprise different types of risks. The technological evolution in the energy sector is critical for the determination of PPA prices. With turbine innovations, each year suppliers are able to provide the same level of efficiency at a lower cost, leading to a drop in PPA selling prices. Every new contract comprises a $/MWh smaller than the previous one. Therefore, until 2023 we estimate prices to follow last year’s drop, of around -0.4%. Until 2030, new capacity is not expected to severely affect the price, so prices will remain flat. From 2030 onwards, we estimate PPA prices to converge to the merchant price and remain the same for the long term, so what we see in PPAs is a downward trend justified by technological breakthroughs. As for merchant prices the opposite trend applies. Nowadays, these prices are lower than PPA’s but for the long term their convergence is predicted, reflecting the increase in prices mostly driven by inflation.
As for Canada, the remuneration system is the FIT with duration of 20 years, thus there is no exposure to electricity prices. In 2018, the price is expected to increase, according to 9M results, about 4%, considering YoY quarters evolution, to 117$/MWh, but for 2019 we believe in a drastic reduction of the selling price, due to the new project in Alberta of 248MW. This addition has such influence in the price due to the small tariff awarded to this contract, which was the lowest recorded in the country (28.8$/MWh) so far, resulting on an average selling price of 28.2€/MWh.
“EDPRENOVÁVEIS” COMPANY REPORT
As for the emerging markets, in Mexico we believe it will follow US inflation trend for the following years, since EDPR agreements are set in USD, and settling at 79$/MWh in the future. In Brazil, the prices will also follow the country’s inflation until 2040, after that year we believe the prices will stabilize at 362.2R$/MW.
Capex
The renewable energy market has been growing every year and presents quite optimistic future prospects, as referred in Market Overview section. EDPR has been able to take advantage of this opportunity which can be proven by the number of contracts that the company has already in place for the next years to achieve its own targets, leading to new capacity additions to its portfolio in three continents whether if the parks are owned or leased. Either way EDPR is responsible for setting up the site, which comprises intensive capital expenditures, and only some years later is able to reap the benefits generated by selling the energy produced.
To assess if Capex is actually creating value for the company, if the capital invested in new capacity is contributing to a better performance, we should not only compute the NPV of the projects in pipeline, which have to be positive, but also their IRR to understand whether or not the companies benefits from such intensive investment. From Table 2, we can see that all IRR are higher than the WACC of each segment, hence, these projects generate positive and valuable cashflows for EDPR, proving the relevance of the way we estimate Capex because it is determinant for valuation purposes.
This forecast is mainly based on the expectations of the wind energy market towards the price of Capex and not in the past evolution of the price per MW. EDPR does not disclose specific information regarding expansion capex that would allow us to compute the cost. In fact, the Capex per region and the total are available but it includes both expansion and maintenance capex. Therefore, to achieve the price per MW installed, we must decompose the Levelized Cost of Energy (LCOE) which includes Capex and Opex, the load factor, a discount rate and the life time of the assets. For now, we will dive in detail on onshore wind Capex which in turn is the sum of the Turbine costs (Nacelle, Tower, Rotor), representing around 70% of the total, a 23% share goes to Balance of Systems costs that considers all the engineering costs related to development and design, Table 2: IRR vs WACC in pipeline
projects
Source: Nova Equity Research
Chart 18: Evolution of Capex per segment (million €)
Source: EDPR Annual Report (2016- 2017) and Nova Equity Research
“EDPRENOVÁVEIS” COMPANY REPORT
the foundation, preparation of the site and installation; while the remaining percentage is left to the Financial costs.
In retrospective, the past few years the market showed a downward in the Capex and we expect the prices keep decreasing but stabilizing at a certain point in the future. The rationale behind it relies on the competition that has been intensifying, forcing suppliers to reduce the prices of the turbines, mostly since the contracts are set under tender offers, and naturally, the entity with the best deal wins the tender.
Our estimates were based on the 2017 IRENA Power Generation Costs report, where the average price per MW was 1.48$ million, until 2022 we believe price per MW in Europe and in the US will not be too far from it, which represents 1.23€/MW million. For Brazil the price is higher, around 1.6$/MW (1.4€/MW). Such phenomenon may be linked to the fact that wind activity in Brazil is not easily accessible, due to the adverse land features and locations where wind parks are usually built, it requires more capital to analyse and study the fields as well as to carry the materials to these remote places, and grid connections.
Regarding offshore wind, the value of Capex is a bit different as well as its breakdown. Here, the Balance of Systems is what most influences the price, 60%, and the price per MW can reach the 4.6$, in the long term we believe Capex is likely to drop to 4.2$/MW according to the IRENA study. The capex is depreciated depending on the asset’s useful life according to the type of wind energy, if is onshore or offshore, 30 and 25 years respectively.
Opex
The operation expenditures incorporate the Supplies and Services, Personnel costs and Other operating costs, and EDPR has gathered efforts and developed a strategy to a strict cost control in order to improve efficiency and profitability. This strategy regards the Core Opex, that we consider as O&M, which includes Services and Supplies and the Personnel costs, since it is what the company can actively manage. In 2016, the company set specific targets for the following years namely, to reduce by -1% the Core Opex/Avg MW until 2020; however, we estimate a more optimistic change of -2%.
Chart 21: O&M per company in 2017 (€ thousand/MW)
Source: Companies results and Nova Equity Research
Chart 19: Evolution of capex per MW in the world ($million/MW)
Source: IRENA Power generation costs 2017
Chart 20: Capex per company in 2017 (€million)
“EDPRENOVÁVEIS” COMPANY REPORT
To achieve its goal EDPR settled a unique O&M strategy based on Modular Maintenance Model (M3) and Self-Performance (SP) programs. The purpose of these measures is to offer the best solution after the end of O&M contracts with suppliers. The M3 aims to help the company segregating and insourcing the main maintenance activities such as planning, logistics and remote operations, and assigns to external contractors the labor-intensive tasks. On the other hand, SP is a more comprehensive program, with incidence only in the US, which enables the insourcing of more activities like preventive, logistics and small correctives. These cost models, allow keeping in-house high value-added activities, leading to the minimization of OEM (Original Equipment Manufacturer) dependency and increasing efficiency by generating more savings and enhancing internal quality control. EDPR expects an exposure of M3 and SP around 50% on its portfolio by 2020, driven by full scope contracts’ expiration. When comparing to other companies within the industry, EDPR presents the lowest O&M per MW which is explained by the lower installed capacity but also by insourcing of activities.
WACC
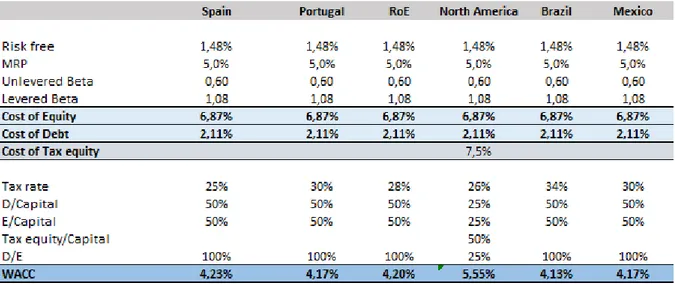
The model was divided into 6 geographies, to obtain the enterprise value of each one we had to compute an individual WACC considering each segment characteristics and specific risk. Since the cashflows are all in Euros, for the risk-free rate we used the average of the past 8 years of the German Bund to correct for the quantative easing (QE) the Central Banks are imposing which result on low interest rates. By relying on the low current yield, we would be overestimating our model and we believe, as the Banks reduce QE the yields will grow and become closer to what they were in the past.
Regarding the cost of equity, for the market risk premium, we relied on the commonly used proxy 5%. Then, we estimated the levered beta of EDPR comparables by regressing the returns of each stock against the returns of the MSCI world, from where we computed the unlevered beta of EDPR as being the average of the unlevered betas of the comparables. Then, to relever the beta we assumed a target D/E based on the comparables, since the past D/E of EDPR is quite low and we believe in the future it will converge to one similar to the industry ratio.
“EDPRENOVÁVEIS” COMPANY REPORT
Regarding the cost of debt, since EDPR does not possess public debt nor it is rated, we computed a theoretical rating based on the interest coverage ratio, reaching a single B rating. To find an approximate yield, we relied on the forward yield curve of utility companies with B rating and used the average yield of 15 years. Then we computed the cost of debt using the yield, the probability of default and loss given default, achieving a result of 2.11%. At the same time, we analysed the average interest rate EDPR pays on its loans where 50% are long-term, and it is around 4%. Based on these two values, we performed a sensitivity analysis, and realised that Enterprise Value is quite sensitive to this input leading to share prices [9.19€; 7.27€]. However, we decided to use 2.11% as the cost of debt as it is the closest approximation.
In North America most of the capital comes from tax equity so it has a particular debt structure, which has an associated opportunity cost. This cost is not publicly available in the market, nor the company discloses much information about it, it only points out to a rate above 7% in the 2016 Results presentation.
Regulatory Framework
The energy sector is a highly regulated market and each country has its specific legislation. Considering legislation suffers changes through time, EDPR must account for this and anticipate the impact such regulations might have to endure for the useful life of its projects.
Table 3: Sensivity Analysis of Cost of debt
Table 4: Weighted Average Cost of Capital Source: Nova Equity Research Source: Nova Equity Research
“EDPRENOVÁVEIS” COMPANY REPORT
Spain
In 2017, in Spain, 32% of the electricity produced came from renewable sources where 20% was generated by wind. The country has 48GW of renewable installed capacity, due to the opportunities the country offers from an environmental, economic, financing perspective to the companies in the renewable sector. In January 2016 an auction was held by the government, and EDPR assured 93MW, of which 68MW commenced operations in 2018 while the remaining will be online in 2019 and 2020. In 2017 two other auctions were held but none was awarded to EDPR.
In 2013 Spanish energy law went through a major reform with the purpose of ensuring the sustainability of the sector regarding production and distribution of renewables. This reform eliminated the incentives that renewable energy companies could choose from: a guaranteed feed-in tariff or a premium that was paid beyond the electricity price. Moreover, measures were introduced involving production, transport and distribution of the energy to increase the use of renewable energy and guarantee the sustainability of the system. In 2014, a new scheme was set in place, limiting the revenues and the profitability of the energy projects by establishing a maximum rate of return on investments equal to the yield of the 10-year state bonds in addition to the revenues from the market, as they were not enough to make up for the initial investment. It was also decided that wind farms operating before 2003 would not receive more benefits, the remaining would receive at most about 7.4% of return before taxes. Recent news have stated that this remuneration plan will be in place until 2030. Plus, the Spanish Government has decreased the remuneration to investment in the renewable sector, and parks that entry activity from 2014 on, were no longer eligible to this remuneration, as companies have become competitive without the help of the government due to the drop-in production costs.
EDPR does not have any installations in pipeline for Spain, for the next few years, nor do we consider it would have, which reflects the intention of the company to expand and invest more in other segments like Rest of Europe and North America, where the potential growth is much more attractive, and where it can improve its market share. Nowadays, EDPR has a generous market share in wind energy in Spain, of 9.7%.
Table 5: Remuneration to Investment in Spain (2004-2013)
Source: EDPR report
Chart 22: Installed GW in Spain vs EDPR GW in Spain in 2017
Source: Nova Equity Research and “Renewable energy in the Spanish electricity system 2017” by REE
“EDPRENOVÁVEIS” COMPANY REPORT
The regulation evolution also has an impact in the consumers. Considering that production costs are decreasing, and the elimination of remuneration to investment, both the direct and indirect price that the costumers have to pay for the energy will decrease. As price now obeys market rules, it is expected to keep the downward trend and the contributions from the population directed to the subsidies will either disappear or be redirected.
Portugal
Before 2012, renewable energy was remunerated based on a feed-in-tariff, as already explained in the Selling Price section. After the elimination of the FIT, the remuneration of new renewable energy was provided through wholesale electricity market, which in Portugal is the Iberian Electricity Market (MIBEL) where electricity is traded before reaching the final consumer, this way supply and demand are balanced, leading to an increase in the competitiveness of this market as the price is set by the market.
In 2014 the Portuguese government created a temporary tax, Contribuição Extraordinária sobre a Energia (CESE) on electric energy. The major energy companies in Portugal have contested this tax as it was supposed to be extraordinary, and 4 years later it is still mandatory. So far, renewable energy awarded through public tenders was exempted, but from January 2019, EDPR will start paying the CESE on the ENEOP and Ventinvest assets. In terms of valuation this measure is irrelevant as the tax paid will represent a low percentage of the P&L.
EDPR has an extremely important role in helping Portugal reach its future goals, namely the target for 2020 of having 31% of the energy produced from renewable sources.
As the amount of electricity production from renewable energy is expected to increase, the energy prices should fall for consumers as the production costs are inferior than when using fossil sources. This will have a positive impact in the purchase power of the population and the competitiveness of the Portuguese energy sector in Europe.
“EDPRENOVÁVEIS” COMPANY REPORT
North America
Since president Trump was elected, the renewable panorama in US changed completely, the uncertainty scenario regarding energy increased investors’ concerns and negative expectations towards renewables companies. Even though it has been 2 years since the election, it is still a relevant issue to discuss and analyse, to understand what EDPR could expect for the next years in terms of installed capacity, if the new regulatory framework in the country has raised obstacles to its growth, as well as understand what could be the impact in the pipeline value for US.
It is important to highlight that US renewables legislation is established at three distinct stages, namely, federal which includes Presidential and Congress levels, and at a state level.
At the president level, Donal Trump mentioned throughout his campaign his willingness to step out of the Paris Agreement, an agreement signed by more than 180 countries to take action against climate change, in particular, to keep global average temperature rise below 2ºC by reducing CO2 emissions, which reflects on cutting energy production from coal fired plants. Trump has put his words into action and US is now out of the Paris Agreement. On top of that, he has redefined the Clean Power Plan (CPP), a climate change policy established by Obama’s administration, aimed to reduce greenhouse gas emissions from power plants. Now, US is under the Affordable Clean Energy rule a rework of CPP, where states have full independence to choose how to regulate CO2 emissions from coal plants, that does not require plants to achieve emissions cuts, since there is no requirement for states to reduce emissions.
Even though these measures do not directly affect renewable energies, nor they constitute barriers to this type of energy production, the fact that coal and gas fired plants are not forced to be reduced or work under some constraints, if states do not incentivise green energy, or where renewables are heavily dependent on subsidies, PPA clients may shift their interest to the cheaper energy, coal and gas. Therefore, we incorporated these issues in the pipeline capacity by reducing EDPR market share until 2030. From 2014-2017 it was around 5% but with the competitiveness of non-sustainable sources of electricity we estimate a reduction in the MW installed under PPA contracts, and a fall in the market share to between 3 and 4%.
Chart 23: Evolution generation of different energy sources (in MW)
Source: U.S. Energy Information Administration
“EDPRENOVÁVEIS” COMPANY REPORT
The second stage of legislation is the Congress, that established and regulated Production Tax Credit (PTC) and Investment Tax Credit (ITC), as well as it is the organism responsible to determine the applicable tax rate to renewable companies.
In 1992, US took the first step towards a renewable energy system with the Energy Policy Act which included a tax incentive program specific for renewable energies, PTC a tax credit adjusted to inflation per KW/h given to those producing energy from renewable sources. In 2009, PTC was extended by three years and an option to have an ITC of 30%, allowing companies to recover 30% of the investment in projects that were already under production or that would begin construction in 2009 and 2010. In 2010, the ITC was extended for one year so projects that were producing by the end of 2012 would also take advantage from it.
In mid year of 2016, it was set that wind farms had 4 years from the start of construction until beginning production in order to qualify for PTC. New sites would have to have start construction by 2016 year-end to qualify for a 100% of the 10-year PTC. Those that started between 2017 and 2020, would be eligible for PTC, 24$/MWh in 2017, but not entirely, this subsidy will be reduced each year by 20% and ITC by 6% until the end of this period, after 2020 wind projects will no longer benefit from PTC and ITC. To take advantage of the PTC and ITC, EDPR employs Tax Equity financing in its capital structure.
During his campaign, Trump emphasized that the government should not choose winners and losers when it comes to forms of energy, being the winners the ones that are subsidized like wind and solar. We can interpret his statement as his intention to cut the incentives on renewables. However, from our point of view, the President has few room to manoeuvre in order to change what has been settled concerning legal incentives, a possible move could be anticipating the elimination of PTC and ITC before 2020, but we see this as an unlikely scenario, since this decision is up to the Congress. Therefore, we did not consider a change in this legislation in our model that would affect the cashflows coming from the projects that are already under construction and the 2GW of PPAs secured.
Besides the subsidies awarded to renewable energy, the Congress is also responsible for defining the major part of the applicable corporate tax rate which is composed by the federal tax and the state tax rate. Until 2017, the Chart 24: Phase-out system (PTC and ITC)
“EDPRENOVÁVEIS” COMPANY REPORT
federal tax rate was 35% but last year the “Tax Cuts and Jobs Act of 2017”, along with other changes, reduced it to 21%, resulting on a corporate tax rate of 25,75% for 2018, -12,25% than in 2017. The measure is supposed to boost after-tax earnings from new renewable projects, but they could also reduce the market demand for the tax credits produced by new renewable energy assets. In our opinion, the corporate tax rate decrease is positive for EDPR and may encourage the pipeline capacity but not drastically.
On the last level of legislation, each state is accountable for the Renewable Standard Portfolio (RPS), which “requires utilities to ensure that a percentage, or a specified amount, of the electricity they sell comes from renewable resources. States have created these standards to diversify their energy resources, promote domestic energy production and encourage economic development” according to National Conference os State Legislatures (NCSL); most of them have set targets for 2020, 2025 or 2030, to achieve a certain percentage of renewable energy in their mix. However, there are some states like Florida or Georgia that do not possess this incentive, so they are already not attractive to wind production. We do not believe Trump’s ideas would impact RPS since they are specific to each state and are spread over Republican and Democrat states.
All in all, the future of the renewable energy market is uncertain at a presidential level, as President Trump does not believe in climate changes, is an advocate of coal and oil and has already put measures in place that hurt the operationality of renewables in the country, including EDPR, which we believe have an impact on the pipeline capacity. However, the Congress and the states have decisive roles in legislation regarding renewables that ensure reliability to these companies. Overall, we do not think they will suffer any changes in the future. Having analysed the regulatory framework of the most relevant segment for EDPR, we believe the enterprise will be able to grow in the US in wind and solar energy. Chart 25: RPS per state
“EDPRENOVÁVEIS” COMPANY REPORT
Brazil
In 2002, with the introduction of PROINFA (Program of Incentives for Alternative Electricity Sources), renewable sources of energy increasingly became part of the Brazil’s energy system. In 2004, the legal scheme for these forms of energy was set and cleared, including that every producer should be granted a PPA with the participation of the public Brazilian electricity company, Eletrobrás, and be regulated by the federal electricity agency. The second stage of PROINFA, started in 2008 and is highly uncertain for the wind sector until today even though other policies have been set it place. In the last auction, in 2015 EDP Renewables obtained a 20-year PPA for wind power for 137MW to start operations in the beginning of 2018. In 2017 and 2018 EDPR obtain through auctions 218MW to start operations in 2023, and 429MW for 2024. We considered these two projects as pipeline.
It is expected that the investment in renewable energy sources reaches 320 billion dollars by 2026. The investment in hydro power is also likely to decrease due to stagnation in hydro related technologies and as advances are made in other renewable related technologies such as solar and wind sectors. In the last few years the production and consumption of renewable energy has been increasing, but in 2017 there was a drop due to a lower production from hydro energy because of the drought felt in the south of the country.
Besides these changes, the election of the new Brazilian president Bolsonaro is expected to invest in policies that will benefit fossil fuels, such as tax reduction on fuels, and eliminate the incentives that exist for solar and wind power. His measures can have both local and global environmental impact, and if they are put into practice it is expected that Brazil will not meet the goals set on the Paris Agreement and may even undo some of the progress so far, regarding gas emissions. Despite the expected changes in the next election cycle related to the energy, Brazil is a country with a lot of potential namely for wind power considering its natural resources and the ability of generating high load factors. However, due to the uncertain political scenario and the high capex costs, we only considered the two already awarded projects for the pipeline.
Source: Ministry of Mines and Energy (MME) of Brazil
Chart 26: Weight of Renewables vs Non-Renewables in the energy mix
“EDPRENOVÁVEIS” COMPANY REPORT
Poland
Even though Poland is not representative in the total portfolio of EDPR, it is one of the biggest markets within the Rest of Europe segment, with a share of 27% in 2017. We believe it is important to discuss the polish market and its regulation and how they could affect EDPR due to its current context. Poland is dominated by coal, around 80% of the total electricity produced comes from it, it is the largest source of greenhouse emissions and a major employer.
As we can see from Chart 28, renewables consumption has been increasing, but not enough for the country to meet the NREAP target for 2020 to have 15% of consumption from renewables source. In December 2018, Poland hosted the UN Climate Change conference proving its awareness of the country’s situation and willingness to improve its energy mix, as coal consumption has been decreasing. However, the country relies heavily on coal preventing it to eliminate coal or drastically change the energy mix in the short term. Moreover, the pour geographic and natural resources for producing energy from renewable sources are obstacles to wind or solar investments. Therefore, one of the reasons we do not expect an improvement of the market share in Rest of Europe for pipeline is the activity in Poland, in 2016 the company actually sold 50MW of capacity which may be a reflection of the company’s disbelief in this market.
Risk Analysis
As any other company, EDPR is subject to many sources of risk that restrain and limit the company´s activity. We considered the following the most relevant.
Market risk
The market risk regards the risk associated to movements in electricity prices, comprising as well, production, interest rates and foreign exchange rates risks. The electricity market is extremely volatile where prices are constantly changing; to face this situation EDPR pursues a strategy of being present in countries where these fluctuations are limited, namely through signing PPA and fix the prices of the electricity and Green Certificates or REC for the duration of the contract, in Europe or US, respectively.
Chart 27: Rest of Europe’s markets
Source: EDPR annual report
Source: BP Statistical Review of World Energy 2018
Chart 28: Evolution of coal and renewables in Poland
“EDPRENOVÁVEIS” COMPANY REPORT
Counterparty risk
Most of EDPR activity is based on contracts, whether it is to sell the energy, like PPAs, or with construction and O&M subcontractors, exposing the company to the default risk from the other party. PPAs are quite common in the US, due to the benefits they comprise, namely, protect both from electricity prices fluctuations. However, these contracts are subject to the counterparty not meeting its obligations. Still we believe this is a minor concern because of EDPR’s counterparties. The company has partnerships with Bloomberg, General Motors, Philipis, Home Depot, among other large and well-known companies which assure reliability and credibility to the contracts. Therefore, based on the characteristics of past counterparties, we believe EDPR will continue to pursue this strategy and the capacity under pipeline will be sold under PPA.
Operational Risk
As previously stated in the report, wind parks are designed by a team of engineers that account for O&M costs and the time turbines are expected to be inoperable. However, renewable plants are exposed to weather hazards, natural disasters, and other unpredictable risks that compromise the functioning and production of energy due to possible damages left on the equipment. Regardless of the O&M origin, EDPR has to account for equipment performance risk; since it is a current issue, the goal is minimizing the associated costs and the dependency of subcontractors. The company developed an O&M strategy relying on an adequate preventive and scheduled maintenance program, where it outsources the non-core technical O&M activities, while value added activities are internally controlled.
Political Risk
The political and regulatory environments are sources of uncertainty in the renewable and the energy market as a whole. Renewables started to gain expression mostly due to subsidies and incentives to investment, as well as better financing conditions and even tax benefits. Nowadays, US is proceeding to the phase-out of the PTC and ITC that implies that parks starting construction after 2020 will not be allowed these credits. Moreover, in Europe some countries are not aligned with the targets established by EU till 2020 and 2030 regarding the energy mix.
“EDPRENOVÁVEIS” COMPANY REPORT
The solution would be to assign penalties for countries where those targets are not met. Basically, the evolution of renewable energy in countries also depends on whether the governments have sustainability in their future prospects or not, and whether or not the traditional energy companies pressure governments towards their own interests. Even though EDPR already accounts for this risk in its portfolio, by taking projects in countries where the instability is lower, the political framework is always uncertain especially for companies that rely a lot on government decisions.
Technology Risk
The factor that most contributes to the evolution of renewables is technology; it is technology that eventually will be able to eliminate traditional forms of energy from the market in an efficient and effective way. Nowadays, the production of renewables is not enough to meet all consumption needs, it is necessary extra energy from CCTG, coal or even nuclear to fulfill the needs. Therefore, technology has to evolve towards a solution like batteries to save and release energy when the wind is not so strong or at night when there is no sun to power solar pv. However, there is a risk of a downward or a disinvestment in research and development, or even stagnation on technology. In order to account for technological breakthroughs, we performed a sensitivity analysis considering the load factor and the cost of capex per MW (factors that are target of technology improvements) and estimated different scenarios for the EV of EDPR.
Regarding the load factor, the one from the existing capacity is not going to be much far away from where it is right now, because new technology will not be incorporated, nor the wind speed and power will radically shift from past years, so to access the impacts of technology in our valuation we completed a sensitivity analysis by varying this feature on the capacity installed through pipeline considering improvements, that would increase the load factor, and technological stagnation by remaining constant. As it would be expected by increasing the load factor, more energy is produced and therefore, sold, so the EV increases. To highlight that the load factor is not expected to rise indefinitely, of course that depending on the location, more or less windy, the load factor is higher or lower, but there is still a cap, it is not likely for a wind park to achieve 100% of load factor, and until 2050 it can go up till 60% with such progresses. As expected, when we increase the load factors the EV is higher, and vice-versa, since by adding Table 6: Sensitivity analysis on load
factor for pipeline capacity
“EDPRENOVÁVEIS” COMPANY REPORT
more power, more energy will be generated and sold, leading to better revenues which has a positive impact in the value of the company. A possible reason for a decrease in the load factor would be climate changes that are also a risk, especially for renewables who depend on natural resources.
Concerning the capex per MW the opposite applies, with technology the price per MW falls, which has been the trend since 1984, according to the IRENA study on installation costs from 2016. By then China and India presented the lowest costs in the world of 1.23 and 1.12 million $/MW. As there are no available estimations for the future of capex, we performed a sensitivity analysis where we assumed a floor of 1.15 and the cap of 1.75, for Europe and North America, we believe for the next decade EDPR’s pipeline capacity capex will be between these. Everything else constant, when the cost per MW decreases the EV will improve, because for the same amount of capacity installed the initial investment is lower.
Multiples Valuation
The multiple valuation method was used to test the degree of consistency between market and intrinsic valuation resulted in DCF. To overcome some issues related with this approach, such as current market trends and the suitable identification of comparable companies, we focussed on two criteria: business model and geography. Hence, we gathered 11 companies from Europe, USA and Brazil.
Instead of using P/E, to avoid capital structure differences in the valuation, we only accounted for non-financing ratios as the EV/Sales and EV/EBITDA. Regarding, EV/EBITDA we came across some outliers namely, Terraform Power, with a multiple of 14.9, way above the market average. Terraform is a yieldco1 created by SunEdison in US, taken public
in 2014, and is now the owner and operator of 3,600MW in wind and solar energy spread across North America and Western Europe, it is in fact a small company in terms of installed capacity, but it presents the highest multiple. The foundation of Terraform allowed the parent company to keep projects off its balance sheet and to recycle the funds back into new projects which led it to bankruptcy in 2016, due to mismanagement and bad conduct. The huge uncertainty rose amongst investors about Terraform future, in our opinion, justifies the high multiple. The market is still wondering if the bankruptcy proceedings will affect Terraform, and how Table 7: Sensitivity analysis on cost
per MW installed for pipeline capacity
“EDPRENOVÁVEIS” COMPANY REPORT
will the renewable company grow without a “sponsor” to dropdown the assets. Moreover, we shall bear in mind that renewable assets in US are traded at a higher premium compared to Europe assets which is another explanation why all American comparables ensure a greater EV/EBITDA (Atlantica Yield, NextEra, NRG Energy, Pattern Energy and Terraform Power), on average 11.8. Nonetheless, we decided to include the American companies to perform the multiples valuation, since 40% of the Enterprise Value of EDPR comes from North America.
From this analysis we reached a mean and median multiple of, x9.8 and x8.6, respectively, leading to equity values of 8 685 million € and 6 873 million €. Currently the share is worth 7.81€, so by relying on the multiples, we corroborate our buy recommendation since they yield share prices of 9.9€ and 7.84€. Using both the DCF and the multiples valuation, EPDR is currently undervalued.
Table 8: Multiples analysis
“EDPRENOVÁVEIS” COMPANY REPORT
Appendix
Simplified DCF
“EDPRENOVÁVEIS” COMPANY REPORT
“EDPRENOVÁVEIS” COMPANY REPORT
CashFlow Map
“EDPRENOVÁVEIS” COMPANY REPORT
Disclosures and Disclaimers
Report Recommendations
Buy Expected total return (including expected capital gains and expected dividend yield) of more than 10% over a 12-month period.
Hold Expected total return (including expected capital gains and expected dividend yield) between 0% and 10% over a 12-month period.
Sell Expected negative total return (including expected capital gains and expected dividend yield) over a 12-month period.
This report was prepared by Ana Quintino and Carolina Cerejo, Master in Finance students of Nova School of Business and Economics (“Nova SBE”), within the context of the Field Lab – Equity Research.
This report is issued and published exclusively for academic purposes, namely for academic evaluation and master graduation purposes, within the context of said Field Lab – Equity Research. It is not to be construed as an offer or a solicitation of an offer to buy or sell any security or financial instrument.
This report was supervised by a Nova SBE faculty member, acting merely in an academic capacity, who revised the valuation methodology and the financial model.
Given the exclusive academic purpose of the reports produced by Nova SBE students, it is Nova SBE understanding that Nova SBE, the author, the present report and its publishing, are excluded from the persons and activities requiring previous registration from local regulatory authorities. As such, Nova SBE, its faculty and the author of this report have not sought or obtained registration with or certification as financial analyst by any local regulator, in any jurisdiction. In Portugal, neither the author of this report nor his/her academic supervisor is registered with or qualified under COMISSÃO DO
MERCADO DE VALORES MOBILIÁRIOS (“CMVM”, the Portuguese Securities Market Authority) as a
financial analyst. No approval for publication or distribution of this report was required and/or obtained from any local authority, given the exclusive academic nature of the report.
The additional disclaimers also apply:
USA: Pursuant to Section 202 (a) (11) of the Investment Advisers Act of 1940, neither Nova SBE nor the author of this report are to be qualified as an investment adviser and, thus, registration with the Securities and Exchange Commission (“SEC”, United States of America’s securities market authority) is not necessary. Neither the author nor Nova SBE receive any compensation of any kind for the preparation of the reports.
“EDPRENOVÁVEIS” COMPANY REPORT
Germany: Pursuant to §34c of the WpHG (Wertpapierhandelsgesetz, i.e., the German Securities Trading Act), this entity is not required to register with or otherwise notify the Bundesanstalt für Finanzdienstleistungsaufsicht (“BaFin”, the German Federal Financial Supervisory Authority). It should be noted that Nova SBE is a fully-owned state university and there is no relation between the student’s equity reports and any fund raising programme.
UK: Pursuant to section 22 of the Financial Services and Markets Act 2000 (the “FSMA”), for an activity to be a regulated activity, it must be carried on “by way of business”. All regulated activities are subject to prior authorization by the Financial Conduct Authority (“FCA”). However, this report serves an exclusively academic purpose and, as such, was not prepared by way of business. The author - a Master’s student - is the sole and exclusive responsible for the information, estimates and forecasts contained herein, and for the opinions expressed, which exclusively reflect his/her own judgment at the date of the report. Nova SBE and its faculty have no single and formal position in relation to the most appropriate valuation method, estimates or projections used in the report and may not be held liable by the author’s choice of the latter.
The information contained in this report was compiled by students from public sources believed to be reliable, but Nova SBE, its faculty, or the students make no representation that it is accurate or complete, and accept no liability whatsoever for any direct or indirect loss resulting from the use of this report or of its content.
Students are free to choose the target companies of the reports. Therefore, Nova SBE may start covering and/or suspend the coverage of any listed company, at any time, without prior notice. The students or Nova SBE are not responsible for updating this report, and the opinions and recommendations expressed herein may change without further notice.
The target company or security of this report may be simultaneously covered by more than one student. Because each student is free to choose the valuation method, and make his/her own assumptions and estimates, the resulting projections, price target and recommendations may differ widely, even when referring to the same security. Moreover, changing market conditions and/or changing subjective opinions may lead to significantly different valuation results. Other students’ opinions, estimates and recommendations, as well as the advisor and other faculty members’ opinions may be inconsistent with the views expressed in this report. Any recipient of this report should understand that statements regarding future prospects and performance are, by nature, subjective, and may be fallible.
This report does not necessarily mention and/or analyze all possible risks arising from the investment in the target company and/or security, namely the possible exchange rate risk resulting from the security being denominated in a currency either than the investor’s currency, among many other risks.