Corresponding author: Drª Carolina Maia Martins Sales.
e-mail: [email protected]
Received 27 March 2018
Accepted 27 July 2018
Major Article
Social determinants of tuberculosis via a zero-inflated
model in small areas of a city in Southeastern Brazil
Carolina Maia Martins Sales
[1],[2], Mauro Niskier Sanchez
[3], Walter Ramalho
[4],
Adelmo Inácio Bertolde
[2],[5]and Ethel Leonor Noia Maciel
[1],[2][1]. Programa de Pós-Graduação em Saúde Coletiva, Universidade Federal do Espírito Santo, Vitória, ES, Brasil. [2]. Laboratório de Epidemiologia, Universidade Federal do Espírito Santo, Vitória, ES, Brasil.
[3]. Departamento de Saúde Coletiva, Universidade de Brasília, Brasília, DF, Brasil. [4]. Campus Ceilândia, Universidade de Brasília, Brasília, DF, Brasil.
[5]. Departamento de Estatística, Universidade Federal do Espírito Santo, Vitória, ES, Brasil.
Abstract
Introduction: This study aimedto analyze social factors involved in the spatial distribution and under-reporting of tuberculosis
(TB) in the city of Vitória, Espírito Santo State, Brazil. Methods: This was an ecological study of the reported cases of TB
between 2009 and 2011, according to census tracts. The outcome was TB incidence for the study period and the variables of exposure were proportions of literacy, inhabitants with an income of up to half the minimum monthly wage (MMW), and
inhabitants associated with sewer mains or with access to safe drinking water. We used a zero-inflated process, zero-inflated
negative binomial regression (ZINB), and selected an explanatory model based on the Akaike Information Criterion (AIC). Results: A total of 588 cases of tuberculosis were reported in Vitória during the study period, distributed among 223 census
tracts (38.6%), with 354 (61.4%) tracts presenting zero cases. In the ZINB model, the mean value of pi was 0.93, indicating that
there is a 93% chance that an observed false zero could be due to sub-notification. Conclusions: It is important to prioritize areas
exhibiting determinants that influence the occurrence of TB in the municipality of Vitória. The zero-inflated model can be useful to the public health sector since it identifies the percentage of false zeros, generating an estimate of the real epidemiological
condition of TB in Vitória.
Keywords: Tuberculosis. Epidemiology. Social determinants of health. Spatial analysis. Statistical model. Negative binomial distribution.
INTRODUCTION
Brazil is among the 30 countries globally with a high tuberculosis (TB) burden, according to the World Health Organization. In Brazil, approximately 10.4 million people were
estimated to have TB in 20161. In Brazil, around 73,000 new
cases of TB are reported annually, with 4,577 deaths in 2013 (Brazil 2014). In the state of Espírito Santo, 15,225 new cases of tuberculosis were reported from 2001 to 2012, 9,356 of which
occurred in the metropolitan area of Vitória2.
The Stop TB plan recommended that, using 1990 as the baseline, prevalence and death rates should have decreased by 50% by 2015. The post-2015 End TB strategy aims to eliminate
TB as a public health problem by 20501. The strategy is based on
increasing access to diagnosis and effective low-cost treatment
and reducing TB incidence and the associated mortality rates3. In
Brazil, TB incidence has decreased in the past decade, although not at a pace that will allow future targets to be met. The TB incidence rate in Brazil decreased from 35.3 cases per 100,000 inhabitants in 2013 to 33.8 cases per 100,000 inhabitants in
2014; the cure rate was 74% for the new cases in 20134.
However, the maintenance of tuberculosis indicators at the levels described above is partially associated with social determinants, despite efforts targeting their reduction. These
determinants, identified through research in different countries,
including Brazil, were as follows: lack of social protection, low income, lack of access to health care services, poorly ventilated residences, and a high average number of inhabitants per
household5-8. In addition to individual care, the strategy used
to identify those susceptible to or suffering from the disease requires a comprehensive approach, with the reduction of the
number of determinants of TB incidence in these populations9.
Two previous studies were conducted in this area. The first
of TB were reported across 78 neighborhoods, with incidence ranging from 0 to 129 cases per 100,000 population, and a strong spatial autocorrelation was observed for the incidence. Furthermore, TB incidence and socioeconomic status had a
significant curvilinear relationship (P = 0.02)10.
In the second study, 503 isolates were genotyped by
IS6110 restriction fragment length polymorphism (RFLP) and
spoligotyping. Of these, the proportion associated with recent transmission was 34.2%. The largest RFLP clusters and families showed that they co-localized in space. Distance analysis
confirmed these results and indicated unique strain patterns
(controls) randomly distributed in space. These results indicated that TB transmission in Vitoria is spatially determined and that recent transmission most frequently occurs among young age adults and those with a low Index of Quality of Urban
Municipality (IQU)11.
Due to considerable heterogeneity in TB incidence throughout the city, and the importance of understanding disease distribution, especially in low incidence areas, in order to highlight if this area had no transmission or if the low number
of cases was due to sub-notification, the aim of this study was to
analyze social factors associated with spatial distribution in the under-reporting of tuberculosis incidence in the City of Vitória, Espírito Santo State (ES), Brazil.
METHODS
Type of study
This is an ecological study of the reported cases of tuberculosis, according to census tracts in the City of Vitória, Espírito Santo State, between 2009 and 2011. In 2010, the City of Vitória had a population of 327,801 inhabitants, distributed
among 577 census tracts12.
Data sources
Disease-related data were obtained from the Notifiable
Diseases Information System [Sistema de Informação de
Agravos de Notificação (SINAN)], and maps of the census tracts in Vitória. Data related to socioeconomic variables were taken from the 2010 Census, available from the Brazilian Geography
and Statistics Institute Instituto Brasileiro de Geografia e
Estatística (IBGE)] website
He outcome measure was the tuberculosis incidence for the study period, calculated as the average number of cases per year in the study period (2009 to 2011) divided by the reference population (2010) per 100,000 inhabitants.
We defined the following exposure variables based on
reports by different authors13-20: % literacy; % inhabitants with
income up to ½ minimum monthly wage, and % inhabitants associated with the sewerage system or with access to safe drinking water, per census tract.
The variables for the fully Bayesian approach were
selected according to the literature13-20 on TB in the State of
ES, according to census tracts. We collected 21 socioeconomic and demographic variables from Brazil’s Atlas of Human Development and analyzed them using Pearson’s correlation
and a scattering matrix (S-matrix), in order to minimize the redundancy of data produced by the high degree of correlation
between variables, ending up with 15 variables (Table 1).
Three of these 15 variables (associated with education, income, and basic sanitation) were selected from the 2010
Census, according to the census tracts and the scientific literature
on TB.
Data analysis
Spatial statistics: spatial analysis of the tuberculosis risk per census tract was performed by smoothing the overall rate using empirical Bayes estimation (EB), proposed by Marshal
(1991) and defined as:
(1)
where EBi is the estimated value; ORi, the overall rate for
tract I; and LR, the local empirical Bayes rate that considers
the rates of neighboring tracts. The local empirical Bayesian (Local EB) is allows for spatial smoothing of the rate, which reduces the instability in the measurement of the risk rate, thus, facilitatin the interpretation and correlation of the Tb event with other factors in space. The results are presented in the form of scatter plots and maps.
Zero-inflated model
In this model we used a inflated process, the zero-inflated negative binomial (ZINB), and as there was
over-dispersion of the data, the explanatory model was selected based on the Akaike Information Criterion (AIC).
A way of modeling the problem is to assume that the random
variable Yican be represented by a negative binomial random
variable (µ,k). In this case, the expression in (2) is written as follows:
The explanatory model was based on the AIC, the statistics of which are the result of adjusting the model and the number of
parameters used to calculate it21. The § is one of the most widely used
model selection measures and is based on the difference between the values observed and those estimated by the model in question, with
the model that generates the lowest AIC value deemed the best fit.
Sampling zeros occur when conditions are conducive to cases, whereas structural zeros are observed when cases do not occur.
Data were analyzed using SatScan software (SatScan
Software, Boston, MA, USA)22 and R statistical software version
2.15 (R Foundation for Statistical Computing, Vienna, Austria).
Ethical considerations
This study was approved by the Research Ethics Committee of the Health Sciences Center of the Federal University of Espírito Santo, under protocol number 242.581. It is in accordance with the ethical standards of the Health National Council resolution 466/2012 and in keeping with the Helsinki Declaration of 1964, as revised in 1975, 1983, 1989, 1996, and 2000.
TABLE 1: Indicators selected to compile municipal profiles21.
Indicators
Municipal Human Development Index - Income
Percentage of people with a per capita household income below BRL75.50
Mortality up to five years old
Percentage of 18 to 24-year-olds with less than eight years schooling
Percentage of people living in households with electricity and a refrigerator.
Percentage of people living in households with more than 2 people per room
Percentage of people living in their own home that is fully paid for
Percentage of the population over 25 years old
Percentage urban population
Percentage of household income appropriated by the wealthiest 10%
Percentage of income derived from labor
Life expectancy at birth
Percentage of income from transfer payments
Overall school attendance rate
Literacy rate
BRL: Brazilian Real. Source: Atlas of Human Development.
RESULTS
Spatial analysis
A total of 588 cases of TB were reported in Vitória from 2009 to 2011, distributed among 223 (38.6%) census tracts, while 354 (61.4%) tracts showed zero cases.
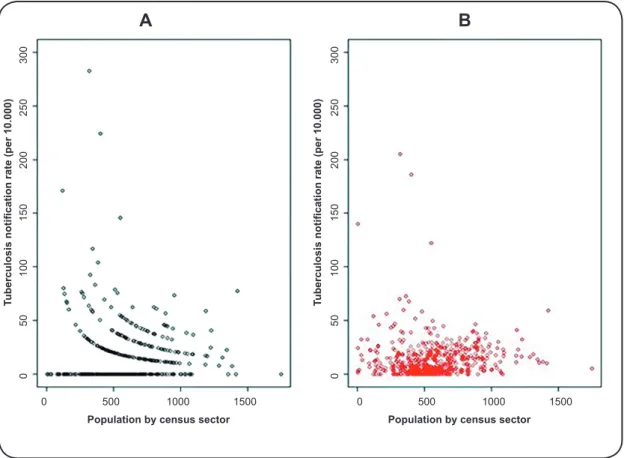
Figure 1A shows a significant fluctuation in the overall rate, particularly in census tracts with smaller populations. By
contrast, Figure 1B) indicates a considerable decline in overall
rate fluctuation for estimates generated by the local empirical
Bayes estimator (EBi) in tracts with smaller populations.
A funnel effect can be seen in Figure 2A, which is not
apparent in Figure 2B. The Figure 2 confirms the above; the
map based on empirical Bayes estimates of TB incidence, Figure 2B, exhibits a well-defined spatial pattern, incidence smoothing during the period, and more evident TB risk areas in the municipality of Vitória, particularly in the Southwest, on Vitória bay, as well as in the center, and Southeast regions.
Risk factors: model for excess zeros
Table 2 shows the modeling results considering the effect of excess zeros, the adjusted models, and AIC values for each model.
It is important to underscore that there were 4 census tracts in our database without information on the selected variables, in these cases, a zero value was attributed to the variables, and a 1 was attributed to the population in order to perform the analyses.
FIGURE 1: Overall tuberculosis notification rate. A. Rate estimated by the local empirical Bayes estimators, and B. per census tract, in the municipality of Vitória from 2009 to 2011.
Tuberculosis notification rate (per 10.000)
Tuberculosis notification rate (per 10.000)
0 50 100 150 200 250 300
0 50 100 150 200 250 300
0 500 1000 1500 0 500 1000 1500 Population by census sector Population by census sector
0-10 10-15 15-20 20-25 25-40 >40
FIGURE 2: Maps of the overall tuberculosis rate. A. Overall tuberculosis rate by empirical Bayes estimate, and B. per census tract in Vitória, from 2009 to 2011.
TABLE 2: Model* negative binomial regression of tuberculosis in the City of Vitória, Espírito Santo State, Brazil in 2009 to 2011.
Models Incidence Probability pi AIC
1 log(µi)=β0+β1inci (negative Bin) log[pi/(1-pi)]=α0+α1inci 1297.2
2 log(µi)=β0+β1liti (negative Bin) log[pi/(1-pi)]=α0 1311.3
AIC: Akaike Information Criterion; Bin: binomial; MMW: monthly minimum wage. *lit is the % of literate inhabitants; inc is the % inhabitants with an income up to ½ MMW.
In the negative binomial model, estimates for the parameters
of the model in Table 2, considered the best fit, were:
(3)
(4)
Where the mean value of pi was 0.93, that is, there is a mean
probability of 0.93 that a zero observed is a false zero. From the best model adjusted according to the lowest AIC value, it can be concluded that the logarithm of the average number of cases of TB decreases linearly with the increase of the percentage of literate people. Moreover, an increase in the percentage of individuals with income exceeding ½ MMW reduced the probability of false zeros.
DISCUSSION
In the municipality of Vitoria, 588 cases of tuberculosis were recorded between 2009 and 2011, with 61.4% of census
tracts exhibiting zero cases, which justifies the application of
a model for excess zeros. The variables of social determinant found in this study using the better adjusted model were illiterate inhabitants and an income up to ½ MMW.
Several areas (tracts) with a case count of zero were observed. According to the study results, 93% of zeros were false zeros, possibly due to under-reporting.
This finding may be because the occurrence of zero cases
in socially deprived areas is rare in an endemic country. Consequently, in such census tracts where zero cases occurred, the likelihood of the cases being false zeros is higher. These areas have, in general, limited infrastructure for health services, including less epidemiological surveillance. Lack of reporting
may lead to these figures, distorting the epidemiological scenario reported to the public officials.
In spatial analysis, the distribution of tuberculosis cases in Vitória is not homogeneous over time. Some census tracts display a high risk of TB transmission while others show low risk. High risk areas should be prioritized not only for disease prevention, but for the early detection of cases and adequate treatment for those affected in order to break the disease transmission cycle.
As in our study, two other studies10-11 observed that the
southwest and northwest regions of the City of Vitória presented a higher incidence and high probability of clusters. These regions are characterized by population agglomeration and low socioeconomic status.
Next to these regions is the central region of the municipality, which despite not having a high probability of clusters, showed an increase in the number of census tracts with a high incidence,
compared to the results in the study from 2002 to 200610.
Accordingly, we considered an average distance of 2000
meters reported in the study11, and, apart from the social
determinants, there is a need to understand TB transmission as an increase in TB incidence has been reported in areas with a higher socioeconomic status in the over the last few years. There is also a need to include such areas for tuberculosis control and prevention, due to changes in the spatial epidemiological scenario over time To our knowledge, the use of the ZINB model is recent, and the ZINB model has not been used to analyze TB in the City of Vitória.
Our findings corroborate with those reported by other research
groups7,10,23, that is, individuals with a low socioeconomic status
were at a greater risk of TB infection; however, a significant
portion of this risk may be the result of limited access to health services.
It is not only in Vitória that TB is associated with issues, such as poverty, social inequality, and unequal income distribution. A
study performed in Ribeirão Preto24 observed a direct association
between TB, income, and education level. Two other studies in Ribeirão Preto and Spain reported an association between the
disease and education level25-26, and TB was associated with the
income of the individuals in a study in Hong Kong27.
Priority should be given to areas with a large population of illiterate inhabitants, and those earning less than the minimum
monthly wage, since these factors influence the occurrence of
TB in the municipality of Vitória.
The zero-inflated model, such as the ZINB, may therefore be an important tool for public health managers, as it identifies
the percentage of false zeros by census tracts, generating a more realistic estimate of TB case distribution, thereby, enabling more effective action to be taken to control the disease.
Conflict of interest
The authors declare that there is no conflict of interest.
REFERENCES
1. World Health Organization (WHO). Global tuberculosis control: WHO report 2016. Geneva: WHO; 2017.
2. Ministério da Saúde (MS). Secretaria de Vigilância em Saúde.
Detectar, tratar e curar: desafios e estratégias brasileiras frente à
tuberculose. Boletim Epidemiológico; 2015; vol. 46, n 9. 19p.
3. Lönnroth K, Castro KG, Chakaya JM, Chauhan LS, Floyd K, Glaziou P, et al. Tuberculosis control and elimination 2010-50: cure, care, and social development. Lancet. 2010;375(9728):1814-29.
4. Ministério da Saúde Saúde (MS). Secretaria de Vigilância em Saúde. Departamento de Vigilância das Doenças Transmissíveis. Panorama da tuberculose no Brasil: indicadores epidemiológicos e operacionais. Brasília: MS; 2014.
5. Hargreaves JR, Boccia D, Evans CA, Adato M, Petticrew M, Porter J. The social determinants of tuberculosis: from evidence to action. Am J Public Health. 2011;101(4):654-62.
6. Reis-Santos B, Gomes T, Horta BL, Maciel ELN. Desfecho do tratamento da tuberculose em indivíduos com doença renal crônica no Brasil: uma análise multinomial. J Bras Pneumol. 2013;39(5): 585-94.
7. Pinheiro RS, Oliveira GP, Oliveira EXG, Melo ECP, Coeli CM, Carvalho MS. Determinantes sociais e autorrelato de tuberculose nas regiões metropolitanas conforme a Pesquisa Nacional por Amostra de Domicílios, Brasil. Rev Panam Salud Publica. 2013;34(6):446-51.
8. Souza WV, Albuquerque MFM, Barcellos CC, Ximenes RAA, Carvalho MS. Tuberculose no Brasil: construção de um sistema de vigilância de base territorial.Rev de Saude Pública. 2005;39:82-89.
9. Rose G. Sick individuals and sick populations. Int J Epidemiol. 2001;30(3):427-32.
10. Maciel ELN, Pan W, Dietze R, Peres RL, Vinhas AS, Ribeiro FK, et al.Spatial patterns of pulmonary tuberculosis incidence and their relationship to socio-economic status in Vitoria, Brazil. Int J Tuberc Lung Dis. 2010;14(11):1395-402.
11. Ribeiro FK, Pan W, Bertolde A, Vinhas SA, Peres RL, Riley L, et al. Genotypic and spatial analysis of Mycobacterium tuberculosis transmission in a high-incidence urban setting. Clin Infect Dis. 2015;61(5):758-66.
12. Instituto Brasileiro de Geografia e Estatística (IBGE). Cidades. Brasil: IBGE; 2010. Available from: https://cidades.ibge.gov.br/painel/painel. php?lang=&codmun=320530&search=esp%EDrito-santo|vitoria
13. Souza WV, Ximenes R, Albuquerque MFM, Lapa TM, Portugal JL, Lima MLC, et al. The use of socioeconomic factors in mapping tuberculosis risk areas in a city of northeastern Brazil. Rev Panam Salud Publica. 2000;8(6):403-10.
14. Mota FF, Vieira-da-Silva LM, Paim JS, Costa MCN. Distribuição espacial da mortalidade por tuberculose em Salvador, Bahia, Brasil. Cad Saude Publica. 2003;19(4):915-22.
15. Santos MLSG, Vendramini SHF, Gazetta CE, Oliveira SAC, Villa TCS. Pobreza: caracterização socioeconômica da tuberculose. Rev Lat Am Enfermagem. 2007;15:762-67.
16. Souza FBA de, Villa TCS, Cavalcante SC, Ruffino Netto A, Lopes
LB, Conde MB.Peculiaridades do controle da tuberculose em um cenário de violência urbana de uma comunidade carente do Rio de Janeiro. J Bras Pneumol. 2007;33(3):318-22.
17. Silva VL, Leal MC, Marino JG, Marques AP. Association between social deprivation and causes of mortality among elderly residents in the city of Recife, Pernambuco State, Brazil. Cad Saude Publica. 2008;24 (5):1013-23.
18. Hino P, Villa TCS, Cunha TN da, Santos CB dos. Padrões espaciais
da Tuberculose e sua associação à condição de vida no município de
Ribeirão Preto. Cien Saude Colet. 2011;16(12):4795-802.
19. Roza DL, Caccia-Bava MCGG, Martinez EZ. Spatio-temporal patterns of tuberculosis incidence in Ribeirão Preto, State of São Paulo, southeast Brazil, and their relationship with social vulnerability: a Bayesian analysis. Rev Soc Bras Med Trop. 2012;45(5):607-15.
20. Acosta LM, Bassanesi SL. The Porto Alegre paradox: social determinants and tuberculosis incidence. Rev Bras Epidemiol. 2014;17(suppl 2):88-10.
21. Akaike H. Information theory and an extension of the maximum likelihood principle. In: Parzen E, Tanabe K, Kitagawa G, editors. Selected Papers of Hirotugu Akaike. Springer Series in Statistics (Prespectives in Statistics). New York: Springer; 1998. p. 199-213.
22. Kulldorf M, Heffernan R, Hartman J, Assunção R, Mostashari F. A Space-Time permutation Scan Statistic for Disease Outbreak Detection. PLoS Med. 2005;2(3):e59.
24. Roza DL, Caccia-Bava MCGG, Martinez EZ. Spatio-temporal patterns of tuberculosis incidence in Ribeirão Preto, State of São Paulo, southeast Brazil and their relationship with social vulnerability: a Bayesian analysis. Rev Soc Bras Med Trop. 2012;45(5):607-15.
25. Brunello MEF, Chiaravalloti Neto F, Arcêncio RA, Andrade RLP, Magnabosco GT, Villa TCS. Areas of vulnerability to HIV/TB co-infection in Southeastern Brazil. Rev Saude Publica. 2011;45(3):556-63.
26. Gomez-Barroso D, Herrador Z, San Martin JV, Gherasim A, Aguado M, Romero-Mate A, Molina L, et al. Spatial distribution and cluster analysis of a leishmaniasis outbreak in the south-western Madrid region, Spain, September 2009 to April 2013. Euro Surveill. 2015;20(7):11-20.