The use of socioeconomic factors
in mapping tuberculosis risk areas
in a city of northeastern Brazil
Wayner V. Souza,
1Ricardo Ximenes,
2, 3Maria F. M. Albuquerque,
1, 2Tiago M. Lapa,
1José L. Portugal,
2Maria L. C. Lima,
3and Celina M. T. Martelli
4In Brazil the challenge of meeting the needs of those living in deprived areas has generated dis-cussions on replacing the existing approach to epidemiological surveillance with an integrated public health surveillance system. This new approach would supplant the traditional focus on high-risk individuals with a method for identifying high-risk populations and the areas where these persons live. Given the magnitude of the problem that tuberculosis (TB) poses for Brazil, we chose that disease as an example of how such a new, integrated public health surveillance system could be constructed. We integrated data from several sources with geographic infor-mation to create an indicator of tuberculosis risk for Olinda, a city in the Brazilian state of Pernambuco. In order to stratify the urban space in Olinda and to check for an association be-tween the resulting TB risk gradient and the mean incidence of the disease bebe-tween 1991 and 1996, we applied two different methods: 1) a “social deprivation index” and 2) principal com-ponent analysis followed by cluster analysis. Our results showed an association between so-cial deprivation and the occurrence of TB. The results also highlighted priority groups and areas requiring intervention. We recommend follow-up that would include treating acid-fast bacilli smear-positive pulmonary TB cases, tracing of these persons’ contacts, and monitoring of multidrug-resistant cases, all in coordination with local health services.
ABSTRACT
In Brazil the traditional epidemio-logical surveillance approach has been “vertical” in nature and has focused on individuals at high risk and those persons’ individual characteristics.
This approach has brought about an accumulation of data in different in-formation systems but with no easy communication between the systems, making it impossible to perform an epidemiological analysis based on ge-ography. This situation has led to a discussion of the type, quantity, and quality of information obtained from the traditional morbidity and “opera-tional” indicators typical of disease control programs.
Health service and epidemiological surveillance systems should help iden-tify and plan interventions to control epidemics and endemics, which are
in-trinsically related to the areas where they occur. To do this, it will be nec-essary to transcend the conventional epidemiological focus on high-risk individuals and their personal charac-teristics, and to instead redirect pub-lic health popub-licies towards defining “high-risk situations,” where environ-mental and socioeconomic conditions increase the risk of the spread of dis-ease (1). This shift in the focus of the public health surveillance system is all the more urgent given the increase in emerging and reemerging diseases that has occurred in the world over the last two decades (2–6).
1 Fundação Oswaldo Cruz, Centro de Pesquisas
Aggeu Magalhães, Recife, Pernambuco, Brasil. Send correspondence to: Wayner V. Souza, Fun-dação Oswaldo Cruz, Centro de Pesquisas Aggeu Magalhães, Av. Moraes Rego s/n°, Cidade Uni-versitária, Recife, Pernambuco, Brasil, 50670-420; e-mail: wayner@cpqam.fiocruz.br
2 Universidade Federal de Pernambuco, Recife,
Per-nambuco, Brazil.
3 Universidade de Pernambuco, Recife,
Pernam-buco, Brazil.
4 Universidade Federal de Goiás, Recife,
Since tuberculosis (TB) is a major concern for Brazil, we chose that dis-ease as an example of how such a new, integrated public health surveil-lance system could be constructed. In Brazil for the last 15 years the TB incidence rate has been high, remain-ing above 50 per 100 000 inhabitants (7). The disease caused some 100 000 deaths in the period from 1979 through 1995. More than 85% of the TB cases have been of the pulmonary form, and, among these pulmonary cases, more than 60% have been acid-fast bacilli smear-positive, constitut-ing the group of greatest epidemio-logical importance.
Data from the Health Ministry of Brazil (7) indicate that in the state of Pernambuco, in northeastern Brazil, there is a more serious TB problem than in the country as a whole. There are also deficiencies in Pernambuco in the implementation of state and local public health services for TB control and patient treatment. While TB inci-dence in the nation overall has leveled off in recent years, the rate has climbed in Pernambuco (Figure 1). Mortality rates in Pernambuco are even more worrisome; the state has values that are nearly 1.5 times the average for the country as a whole.
In Pernambuco during the period of 1991–1996 there were 28 091 TB cases notified. For 18 555 of them (66%) in-formation was missing about previous treatment those persons might have received (7). Among the remaining 9 536 cases, 1 623 of them (17%) were patients who had previously under-gone treatment, including 1 430 (88%) who had begun the new course of therapy without a sputum culture or drug susceptibility test. Additionally, HIV testing was not done in 27 333 (97%) of these patients.
For our study we investigated the situation with TB in one location in Pernambuco, the city of Olinda. We correlated socioeconomic indicators from the demographic census with TB data from the national Disease Surveil-lance Warning System. Our objective was to identify sociodemographic risk factors statistically associated with TB in the city, within “defined
popula-tional bases” (populations living in areas with well-defined boundaries), making it possible to construct differ-ent levels of aggregation, including census tracts, neighborhoods, and san-itary districts (6, 8).
MATERIAL AND METHODS
Area and population under study
Olinda is a city located in the gen-eral metropolitan area of Recife, the state capital of Pernambuco (Figure 2). According to the demographic census of 1991, Olinda had 341 394 inhabi-tants as of 1 September 1991, and, ac-cording to the 1996 population count (9), 349 380 inhabitants on 1 August 1996, all living in urban areas. The de-mographic census takes place in Brazil every 10 years and collects demo-graphic, socioeconomic, and urban-services information that is aggregated at the census tract level. The popula-tion count is done in the middle of the period between consecutive census counts and collects only information about the number of persons, by age
and sex. The Brazilian Institute of Ge-ography and Statistics is responsible for both the demographic census and the population count, which are car-ried out across the country.
Population growth in Olinda over the 1991–1996 period was approxi-mately 0.5% per year, giving a pro-jected population of a little more than 356 000 as of September 2000. Olinda has an area of 40.83 km2, and its
pop-ulation density of 8 719 inhabitants per square kilometer makes it one of the most densely populated areas of the country (1).
Sources of data
In our study we worked with data from three sources. One source was the Disease Surveillance Warning Sys-tem. Administered by the Ministry of Health of Brazil, this national system provides information on all diseases of compulsory notification, including tuberculosis. The information con-cerns the identification, evolution, and treatment of cases, and it is generated by the local public health services and FIGURE 1. Incidence (1982–1996) and mortality (1979–1995) resulting from tuberculosis (all forms), for state of Pernambuco and for Brazil as a whole
Source:Brasil/Ministério da Saúde/Fundação Nacional de Saúde/Centro Nacional de Epidemiologia (7). 0
10 20 30 40 50 60 70 80
Incidence/100 000 inhabitants Mortality/100 000 inhabitants
0 2 4 6 8 10 12 14 16
Year Brazil incidence
Pernambuco incidence
aggregated at the state and national levels (7).
We also obtained primary variables on socioeconomic and demographic characteristics for each census tract in Olinda, using the database from the 1991 demographic census (9). To estimate the population of Olinda for every year of the study period we used the data from the 1991 census and from the 1996 population count database (9).
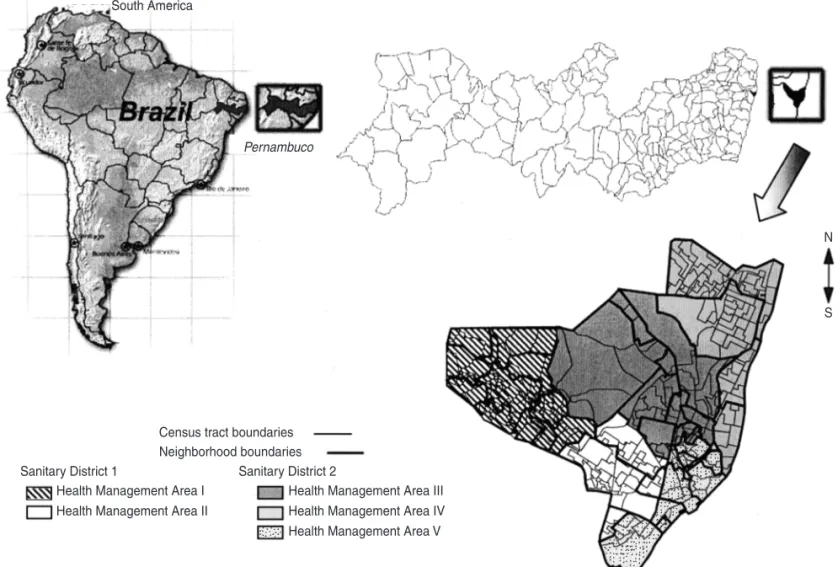
For our third data source, mapping, we started with a digital map supplied by the Department of Cartographic Engineering at Pernambuco Federal University. This map provided the street plan for Olinda, to which we added further layers: 243 census tracts; 40 neighborhoods, and 2 sanitary
dis-tricts (with 5 corresponding municipal health authority management areas) (Figure 2). The local government de-fines a sanitary district as an assembly of management areas that comprise a group of neighborhoods formed by a set of census tracts. This organization structure, adopted by the Municipal Health Authority, aims to decentralize the decision-making process; each san-itary district becomes responsible for the health services activities within its boundaries. We built up the census tracts layer using the 1991 census data-base of the Brazilian Institute of Ge-ography and Statistics. That database provided a description of the limits of each of the 243 census tracts of Olinda. The neighborhoods were developed from analog maps supplied by the
Olinda Municipal Planning Authority, and the sanitary districts were devel-oped from analog maps supplied by the Olinda Municipal Health Author-ity. To build up these layers we used MaxiCAD 32 image acquisition (digi-talization) software (MaxiDATA Tech-nology & Informatics Ltd., Curitiba, Paraná, Brazil).
Data analysis and procedures
For our data analysis we first carried out a descriptive analysis of the occur-rence of all forms of tuberculosis in Olinda, using the annual incidence rate as an indicator. We chose the pe-riod of 1991 through 1996 since census and population information was
avail-FIGURE 2. Map of Olinda, Pernambuco, Brazil, with census tracts, neighborhood boundaries, sanitary districts, and health management areas
Census tract boundaries Neighborhood boundaries
Sanitary District 2 Sanitary District 1
Health Management Area I Health Management Area II
Health Management Area III Health Management Area IV Health Management Area V South America
Pernambuco
N
able for those two end points, from the 1991 demographic census and from the 1996 population count. In addition, 1996 is the latest year with complete information on new TB cases from the Disease Surveillance Warning System.
We considered the census tracts as the basic unit of analysis for our next step, the georeferencing of incident tuberculosis cases, that is, identifying the census tract where the residence of each case was located, based on the address recorded in the Disease Sur-veillance Warning System database.
One problem we found in using the census tracts as a unit of analysis was the lack of stability that the incidence rates showed when calculated for small areas, due to the small number of cases per year per census tract. We tentatively overcame this difficulty by calculating the mean annual TB inci-dence rate for the 1991–1996 period for each census tract (10–12). We next con-ducted geoprocessing of the primary variables from the 1991 census, using ArcView 3.0 software (Environmental Systems Research Institute, Inc., Red-lands, California, United States of America). These variables, describing socioeconomic, demographic, and urban-services conditions at the cen-sus tract level, were used to construct a “social deprivation index” and to perform the principal component analysis that is described below.
Our next step concerned the spatial analysis of the distribution of the dis-ease in relation to the census tracts, using a Poisson distribution to check the probability that this distribution had occurred by chance (13–15).
We then moved on to creating a col-lective risk status indicator, for which two distinct methodologies were ap-plied. The two methods were: 1) a so-cial deprivation index and 2) factor analysis to extract principal compo-nents, followed by cluster analysis.
Social deprivation index. The social deprivation index (SDI) was based on secondary variables that had been de-rived from primary variables in the 1991 census database (16). We inten-tionally built up these secondary
vari-ables, at the census tract level, for either their relationship with social deprivation or their importance in TB transmission. For example, using two primary variables, “average number of bedrooms per house” and “average number of people per house,” we con-structed a secondary variable of “aver-age number of people per bedroom,” which is strongly related with TB transmission.
There were six secondary variables: percent of family heads with less than 1 year of schooling, percent of persons 10 to 14 years old who were illiterate, percent of family heads with income below 1 minimum wage, percent of households without an indoor piped water supply, percent of households in subnormal dwellings (in shanty-towns), and average number of inhab-itants per bedroom.
Using methodology described else-where (1, 16), we then calculated the value of the social deprivation index for each of 241 census tracts (2 of the 243 census tracts do not have inhabi-tants and were thus not analyzed). The lowest values of SDI indicated the least social deprivation, and the high-est SDI values corresponded to the greatest level of deprivation or risk.
We applied an analysis of variance model to check for an association be-tween risk gradient (expressed in quintiles of SDI distribution) and TB incidence, using mean incidences over the 1991–1996 period for the set of census tracts that made up each of the quintiles.
Factor analysis. Our second meth-odology, factor analysis, was not based on a limited number of pri-mary variables intentionally chosen from the census database, as had been true with the SDI methodology. In-stead, the factor analysis used a set of primary variables representing the whole spectrum of socioeconomic, demographic, and urban-services char-acteristics from the 1991 census. In this analysis we used 16 secondary variables, including the same 6 that were included in the SDI construction with the 241 residential census tracts.
From this data matrix we determined the initial factors through principal component analysis (PCA), whose objective is to explain as much as possible the total variation in a set of data through a small number of factors, known as the principal com-ponents (17).
Once we had used PCA to identify the principal components, we took the first principal component (PC1) as the
marker of the social deprivation “di-mension,” given the chosen variables. We then calculated “factor scores” that allowed us to order the census tracts according to the studied characteristic (17–19). As a means of establishing cut-off points for the stratification of the census tracts, we employed the k-means statistical clustering method, taking k = 5 to identify five clusters of census tracts (20, 21). This was in keeping with the logic of ultimately being able to plan local health service interventions.
To assess the association between the risk gradient resulting from this stratification and the incidence of TB, we used an analysis of variance model, taking the mean incidences over the 1991–1996 period for the set of census tracts that make up each one of the clusters identified by cluster analysis.
In our final stage we analyzed the distribution of the census tracts ac-cording to their classifications by SDI (five quintiles) and by PCA (five clusters). We used the kappa test to assess the level of agreement between the results of the two classification approaches (21).
RESULTS
Of the 2 102 incident cases of tuber-culosis observed over the period, for 1 723 of them (82%) there was ade-quate information to georeference them by census tract; that georeferenc-ing percentage exceeded 80% in every one of the 6 years of the period. Almost all the cases that lacked suf-ficient data to be georeferenced car-ried incomplete addresses, suggesting residence in a shantytown or a new settlement, rather than in a more-established area of Olinda. These 379 cases with insufficient data were not included in our study.
Analyzing the mean 1991–1996 inci-dences for each census tract, we found 11 tracts that averaged three or more TB cases per year. Although these 11 census tracts together corresponded to little more than 5% of the population of Olinda, they accounted for more than 15% of all the cases, with a mean incidence rate 2.3 times the average for Olinda. Testing these observed val-ues against those expected according to the Poisson distribution, the chi-square test for goodness of fit rejected the hypothesis of no difference be-tween observed and expected values (chi-square (2) = 852.066, with 1 de-gree of freedom, P< 0.01). The results of this test suggest that the distribu-tion of disease at the census-tract level is aggregated and that this distribution is not random. These results also un-derline the need for additional ways of stratifying this population and ex-pressing different collective levels of risk of falling ill from TB, which we try to do in the sections that follow.
Social deprivation index
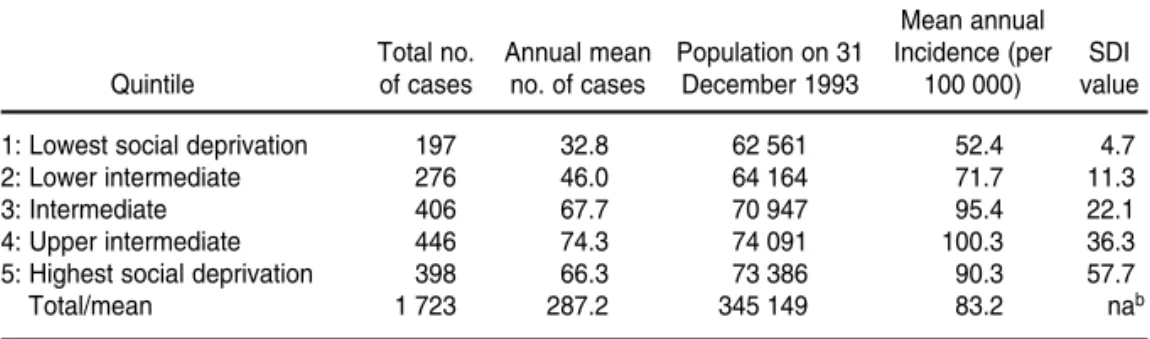
Table 1 shows the incidence of TB cases during the 1991–1996 period, for the five social deprivation index (SDI) quintiles. The table shows that the risk measured by SDI value rises along with the incidence of tuberculosis for the first four quintiles. The analysis of variance for the mean incidence rates for the quintiles showed that these means differ (P< 0.001). Employing the Duncan test to identify
homoge-neous groups (22), a significant differ-ence was found between the inciddiffer-ence means of quintiles 1 and 2 and the in-cidence means of quintiles 3, 4, and 5. Figure 3 is a map of tuberculosis risk in Olinda, classified according to SDI distribution quintiles and indicating rel-ative priority for the five health man-agement areas.
Principal component analysis
The principal component analysis followed on from the matrix of sec-ondary variables. Table 2 shows the mean values and standard deviations for those variables. The table also shows the factor loadings obtained in the PCA, that is, the correlation coeffi-TABLE 1. Tuberculosis incidence according to quintile of social deprivation index (SDI), Olinda, Pernambuco, Brazil, 1991–1996a
Mean annual
Total no. Annual mean Population on 31 Incidence (per SDI
Quintile of cases no. of cases December 1993 100 000) value
1: Lowest social deprivation 197 32.8 62 561 52.4 4.7
2: Lower intermediate 276 46.0 64 164 71.7 11.3
3: Intermediate 406 67.7 70 947 95.4 22.1
4: Upper intermediate 446 74.3 74 091 100.3 36.3
5: Highest social deprivation 398 66.3 73 386 90.3 57.7
Total/mean 1 723 287.2 345 149 83.2 nab
aF= 5.26, degrees of freedom = 4 236, P< 0.001. bna = not applicable.
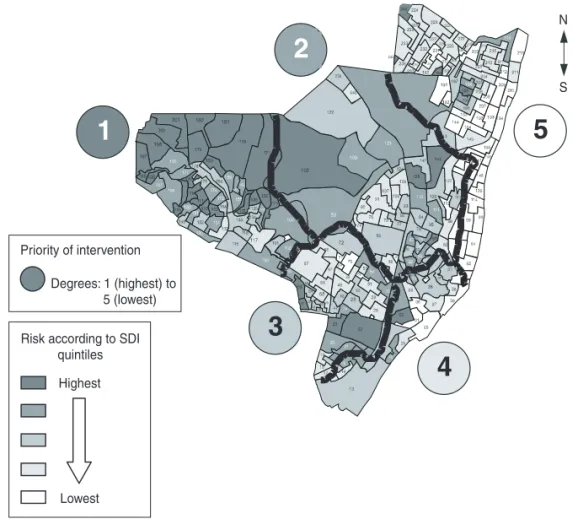
FIGURE 3. Map of tuberculosis risk according to SDI quintiles, and priority definition by health management area, Olinda, Pernambuco, Brazil, 1991–1996
Priority of intervention
Risk according to SDI quintiles Highest
Lowest
Degrees: 1 (highest) to 5 (lowest)
1
2
3
4
5
N
cients for each of these variables and the first principal component (PC1). These results show high percentages of households without satisfactory sani-tary installations and without regular garbage collection, as well as notice-able percentages of illiteracy among persons aged 10–14 years old and of extremely limited schooling among heads of family. Along with standard deviations near or above the mean for most of the variables, these figures in-dicate the existence of both extreme disparities in the distribution of these variables and great social inequalities. The first principal component was ca-pable of explaining around 43% of the total variation of the data set analyzed. Eight of the variables were strongly cor-related with the “dimension” of social deprivation as indicated by PC1, with factor loadings of over 70%.
The factor scores, normalized for each census tract, served as a basis for k-means cluster analysis, using five clusters. Using analysis of variance to compare the mean values of these fac-tor scores for the five clusters, we found that the difference among the five means was statistically significant (F= 1 268, degrees of freedom = 4 236,
P< 0.01).
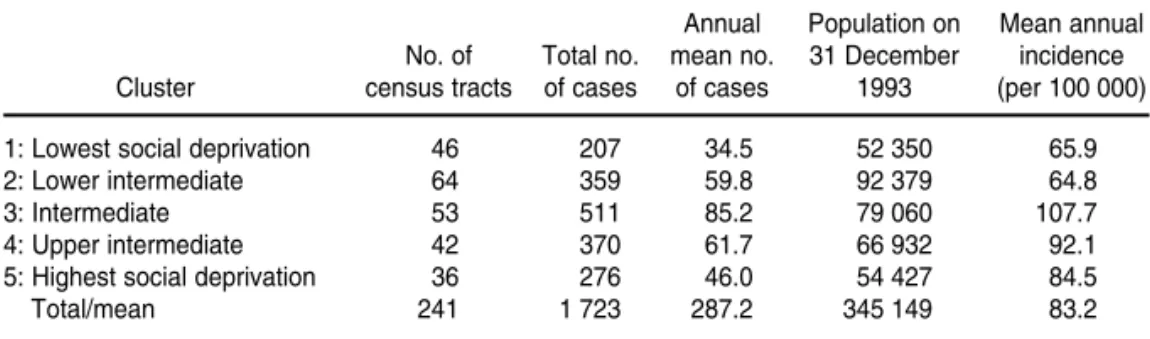
Table 3 shows TB incidence for the five social deprivation clusters defined in our analysis. The analysis of vari-ance for the incidence rates found there were differences among the means that were statistically signifi-cant (P< 0.01). Using the Duncan test to identify homogeneous groups (22), we found a significant difference be-tween the mean incidence rates of clusters 1 and 2 and the mean inci-dence rates of clusters 3 and 4.
Figure 4 shows the results of the cluster analysis, indicating the relative TB risk for different areas in Olinda. The layer containing the municipal health authority management areas has been superimposed on the map of risk in order to define the priority areas.
There was close agreement in the distributions of census tracts accord-ing to their deprivation level classifi-cation by SDI values and from using principal component analysis followed
by cluster analysis; 175 out of 241 cen-sus tracts were identically classified (kappa = 0.689; z = 21.51; P< 0.01) (18).
DISCUSSION
Over the period studied, Olinda dis-played high annual tuberculosis inci-dence rates, approximately two times the averages for Brazil as a whole. These high values underline the mag-nitude of the TB problem in Olinda, as well as the challenge of redefining the guiding principles of the existing epi-demiological surveillance model.
As in other studies that have adopted the census tract as the basis of analysis (23, 24), this one has produced a stratified visualization of an urban area and has provided an overview of collective risk that can explain the
dif-ferentials in the occurrence of tubercu-losis in Olinda.
Our analysis shows that the distribu-tion of tuberculosis cases in Olinda is not uniform and that there is an associ-ation between collective risk, as mea-sured by two different methods, and tuberculosis incidence rates. The results of the kappa test showed there was close agreement between the two meth-odologies, with principal component analysis followed by cluster analysis validating the social deprivation index method, given the convergence be-tween the areas of lowest and highest risk as indicated by the two approaches.
The correspondence between risk situation and incidence of tuberculosis was less than perfect. With the SDI ap-proach, a higher TB incidence was ob-served in the fourth quintile than in the fifth quintile (Table 1). With princi-TABLE 2. Mean values, standard deviation, and factor loadings of the variables used in prin-cipal component analysis, Olinda, Pernambuco, Brazil, 1991–1996
Standard Factor loading
Variable Mean deviation (%)
Average number of inhabitants per bedroom 2.1 0.4 90.2
Persons 10 to 14 years old who were illiterate 13.9% 11.2% 90.1
Family heads with less than 1 year of schooling 15.0% 11.3% 88.6
Subnormal dwellings (in shantytowns) 20.6% 31.5% 80.0
Residences without an indoor piped water supply 15.8% 20.0% 77.6
Residences without satisfactory sanitary installations 45.0% 40.0% 76.2
Residences without regular garbage collection 32.3% 33.1% 75.0
Family heads with income below 1 minimum wage 27.8% 18.1% 71.7
Residences built on lands without legal ownership 15.3% 22.1% 62.8
Average number of persons per household 4.4 0.4 60.4
Residences without piped water 5.9% 12.3% 58.2
Family heads without income 8.2% 7.2% 51.7
Residences with piped water supply from bad sources 1.7% 6.0% 11.2
Households rental free/with loan on home 4.8% 3.9% 1.8
Residences rented 15.5% 7.9% –25.4
Households in apartment blocks 26.1% 40.1% –39.7
TABLE 3. Tuberculosis incidence according to clusters of social deprivation defined by cluster analysis with five clusters, Olinda, Pernambuco, Brazil, 1991–1996a
Annual Population on Mean annual
No. of Total no. mean no. 31 December incidence
Cluster census tracts of cases of cases 1993 (per 100 000)
1: Lowest social deprivation 46 207 34.5 52 350 65.9
2: Lower intermediate 64 359 59.8 92 379 64.8
3: Intermediate 53 511 85.2 79 060 107.7
4: Upper intermediate 42 370 61.7 66 932 92.1
5: Highest social deprivation 36 276 46.0 54 427 84.5
Total/mean 241 1 723 287.2 345 149 83.2
pal component analysis and cluster analysis of the five strata, the cluster with the highest mean incidence was the middle one, with successively lower rates for the fourth and fifth clusters (Table 3). There are several possible explanations for these results. One is the fact that the great majority of the cases that could not be refer-enced to a particular census tract had incomplete addresses, suggesting lo-cation in the most deprived areas. Our results could also suggest that, beyond an intermediate level of deprivation, it may not be meaningful how much worse the social status becomes, since there are already conditions favoring the spread of TB. It is likely that the best model to explain the relation be-tween social deprivation and TB is not a linear one. There appears to be a minimum incidence even when there is no social deprivation, as well as a high level of social deprivation be-yond which there is no more increase in the incidence of TB.
Other issues of concern include the coverage of information systems and access to health services, both of which could be pointing to the underreport-ing of cases within the most deprived population (25).
The second methodology we used, principal component analysis fol-lowed by cluster analysis, appears bet-ter at focusing on the social depri-vation “dimension,” by using a larger number of variables and more refined techniques, thus showing itself to be more rigorous in several respects, in-cluding statistically.
On the other hand, the social depri-vation index methodology works with variables chosen intentionally and that are also known to be related to poverty and transmission of TB. This may make the model easier to construct and easier for those planning and pro-viding health service at any level to operate. Nevertheless, the fact that we constructed the social deprivation in-dex with variables of the same weight,
with no consideration of the relative importance of each one, could repre-sent a methodological limitation. But while this may be important from an academic point of view, the SDI tech-nique is simple and allows the synthe-sis of social deprivation situations that indicate collective risk.
If we analyze the risk strata within the management areas and sanitary districts, it becomes possible to define, or even redefine, control initiatives from a geographically based perspec-tive (26). In the case of tuberculosis a new public health surveillance system will have to offer new guidelines based on the notion of collective risk. This is not a question of establishing new ways of treating TB, but rather of identifying high-risk populations and the areas where these persons live and establishing a more efficient surveil-lance system. Such a system would in-clude strict control of acid-fast bacilli smear-positive carriers of pulmonary tuberculosis and their contacts, follow-up of drug-resistant cases, and treat-ment monitoring of cases registered by each health service, according to a geographic approach compatible with the organization of the health services in sanitary districts.
This work has proposed ending the lack of communication among tradi-tional information systems and allow-ing the interactive analysis of health and sociodemographic data, such as we have done by integrating three data sources: the demographic census, the Disease Surveillance Warning Sys-tem, and a geographical one (map-ping). This type of integration could lead to organizing health services on the basis of the health needs of popu-lation groups in ways that encompass considerations of quality, quantity, and location. Additionally, the orga-nization of health services should contemplate the different levels of complexity of health care within each sanitary district.
Acknowledgements. We are very grateful to the Pan American Health Organization for providing financial support to the development of this work.
FIGURE 4. Map of tuberculosis risk and intervention priorities, obtained by principal com-ponent and cluster analysis, Olinda, Pernambuco, Brazil, 1991–1996
Priority of intervention
Risk according to SDI quintiles Highest
Lowest
Degrees: 1 (highest) to 5 (lowest)
N
S
1
2
3
4
En Brasil, el reto de satisfacer las necesidades de los residentes en zonas pobres ha ge-nerado discusiones sobre la sustitución del actual abordaje de la vigilancia epidemio-lógica por un sistema integrado de vigilancia de la salud pública. Este nuevo abordaje debería sustituir el tradicional enfoque en los individuos de alto riesgo por un método destinado a identificar las poblaciones de alto riesgo y las zonas en las que viven. Dada la magnitud del problema de la tuberculosis en Brasil, elegimos esta enfermedad como un ejemplo de cómo se podría concebir este nuevo sistema integrado de vigilancia de la salud pública. Se reunieron los datos de varias fuentes y la información geográfica para crear un indicador del riesgo de tuberculosis en Olinda, ciudad del estado de Per-nambuco. Con el fin de estratificar el espacio urbano de Olinda y de buscar una aso-ciación entre el gradiente del riesgo de tuberculosis y la incidencia media de la enfer-medad entre 1991 y 1996, se aplicaron dos métodos diferentes: 1) un “índice social de pobreza”, y 2) un análisis de componentes principales seguido de un análisis por gru-pos. Los resultados obtenidos revelaron una asociación entre la pobreza y la aparición de la tuberculosis y también señalaron grupos y zonas prioritarias que requerían in-tervención. Se recomienda un seguimiento que debería incluir el tratamiento de los casos de tuberculosis pulmonar con baciloscopia positiva, la identificación de los con-tactos de estos individuos y el control de los casos resistentes a múltiples fármacos, todo ello en coordinación con los servicios de salud locales.
RESUMEN
Uso de factores
socioeconómicos en la
localización de áreas con
riesgo de tuberculosis en una
ciudad del nordeste de Brasil
1. Ximenes RA, Martelli CM, Souza WV, Lapa TM, Albuquerque Md, Andrade AL, et al. Vigilância de doenças endêmicas em áreas ur-banas: a interface entre mapas digitais cen-sitários e indicadores epidemiológicos. Cad Saude Publica 1999;15(1):109–118.
2. The global challenge of tuberculosis [editor-ial]. Lancet 1994;344(8918):277–279. 3. Farmer P. Social inequalities and emerging
infectious diseases. Emerg Infect Dis 1996; 2(4):259–269.
4. Enarson DA, Grosset J, Mwinga A, Hersh-field ES, O’Brien R, Cole S, Reichman L. The challenge of tuberculosis: statements on glo-bal control and prevention. Lancet 1995; 346(8978):809–819.
5. Gamundi R. The emergence of TB signals dangers [Internet page]. AIDS Project Los An-geles. Available from: http://www.apla.org/ apla/9512/tuberculosis.html. Accessed July 1998.
6. Sabroza PC, Toledo LM, Osanai CH. A orga-nização do espaço e os processos endêmico-epidêmicos. In: Leal MC, Sabroza PC, Ro-drigues RH, Buss PM. Saúde, ambiente e desenvolvimento. Processos e consequências sobre as condições de vida. São Paulo, Hucitec, and Rio de Janeiro, Abrasco; 1992. pp. 57–77.
7. Brazil, Ministério da Saúde. Série histórica de casos de agravos e doenças infecciosas e para-sitárias no Brasil, 1980 a 1996: tuberculose. Inf. epidemiológico SUS 1997;6(1):95–103. 8. Mendes EV, et al. Distritos sanitários:
con-ceitos. In: Mendes EV. Distrito sanitário: o pro-cesso social de mudança das práticas sani-tárias do Sistema Único de Saúde. São Paulo,
Hucitec, and Rio de Janeiro, Abrasco; 1993. p. 150–185.
9. Fundação Instituto Brasileiro de Geografia e Estatística. Censos demográficos [Internet site]. Available at: http://www.ibge.gov.br. Ac-cessed July 1998.
10. Dolk H, Mertens B, Kleinschmidt I, Walls P, Shaddick G, Elliot P. A standardisation ap-proach to the control of socioeconomic con-founding in small area studies of environment and health. J Epidemiol Community Health 1995;49 Suppl 2:S9–14.
11. Small-area variations: what are they and what do they mean? CMAJ 1992;146(4):467–470. 12. Carstairs V, Lowe M. Small area analysis:
cre-ating an area base for environmental monitor-ing and epidemiological analysis. Commu-nity Med 1986;8(1):15–28
13. Elliot P, Cuzick J, English D, Stern R, eds. Ge-ographical and environmental epidemiology: methods for small-area studies. Oxford: Ox-ford University Press; 1996.
14. Hays WL. Statistics. Fort Worth, Texas, United States of America: Holt, Rinehart and Winston; 1988.
15. Sokal RR. Testing statistical significance of ge-ographic variation patterns. Systematic Zool-ogy 1979,28:227–232.
16. Fundo das Nações Unidas para a Infância. Municípios brasileiros: crianças e suas con-dições de sobrevivência. Brasília: Fundação Instituto Brasileiro de Geografia e Estatística; 1994.
17. Kleinbaun DG, Kupper LL, Muller KE. Ap-plied regression analysis and other multi-variable methods. Boston: Duxbury Press; 1987.
18. Souza J. Métodos estatísticos nas ciências psi-cossociais. Brasília, Brasil: Thesaurus; 1987. 19. Chatfield C, Collins AJ. Introduction to
multi-variate analysis. London: Chapman and Hall; 1986.
20. United States of America, Centers for Disease Control and Prevention. Guidelines for inves-tigating clusters of health events. MMWR Morb Mortal Wkly Rep 1990;39(RR-11):1–23. 21. Altman DG. Practical statistics for medical
re-search. London: Chapman and Hall; 1995. 22. Bailar JC, Mosteler F. Medical uses of
statis-tics. Boston: NEJM Books; 1992.
23. Carstairs V, Morris R. Deprivation: explaining differences in mortality between Scotland and England and Wales. BMJ 1989;299(6704): 886–889.
24. Patterson CC, Waugh NR. Urban/rural and derivational differences in incidence and clus-tering of childhood diabetes in Scotland. Int J Epidemiol 1992;21(1):108–117.
25. Castelhanos PL. Sistemas nacionales de vigi-lancia de la situación de la salud según condi-ciones de vida y del impacto de las accondi-ciones de salud y bienestar. Washington, D.C.: Pan American Health Organization; 1993. 26. Albuquerque MFPM, Morais HMM.
Decen-tralization of endemic disease control: inter-vention model for combating bancroftian fi-lariasis. Rev Panam Salud Publica 1997;1(2): 155–163.
Manuscript received 3 December 1999. Revised version accepted for publication on 10 July 2000.