Article
, Vol. 29, No. 10, 2169-2179, 2018 Printed in Brazil - ©2018 Sociedade Brasileira de Química*e-mail: [email protected]
Effect of Temperature on Devulcanization of Waste Sidewall Rubber by
Supercritical Ethanol
Xiang Li,a Xiao-Qing Deng*,b and Chao Dongc
aSchool of Mechanical Engineering, Yangtze University, 434023 Jingzhou, P. R. China
bCollege of Chemistry and Environmental Engineering, Yangtze University,
434023 Jingzhou, P. R. China
cFaculty of Chemical, Environmental and Biological Science and Technology,
Dalian University of Technology, 116024 Dalian, P. R. China
The influence of temperature on devulcanization of waste sidewall rubber via supercritical ethanol was investigated. The effect of parameters on devulcanizing process was analyzed by a full factorial experimental design. The devulcanized products at different temperatures were characterized by gel permeation chromatography (GPC), differential scanning calorimetry (DSC), thermogravimetry and derivative thermogravimetry (TG-DTG) and Fourier transform infrared (FTIR) spectrophotometry. In addition, the kinetics analysis for the devulcanizing process via supercritical ethanol was established. It was found that the reaction temperature was the only significant parameter. When the temperature rose above 240 oC, the reaction rate increased
dramatically. A special phenomenon was observed that the devulcanizing reaction rate of natural rubber (NR) was faster than that of butadiene rubber (BR) in supercritical ethanol. Moreover, when the reaction temperature reached 270 oC, the use of the devulcanizing reagent did not significantly
affect the sol fraction. The analysis of experimental results indicated that supercritical ethanol beyond the critical temperature could strongly promote the devulcanizing reaction, maintaining polymer structure of products as the most intact state.
Keywords: supercritical ethanol, waste sidewall rubber, temperature, kinetics
Introduction
The recycling of waste tire rubber has attracted intensive attention due to the great efforts related to the prevention of environmental pollution and conservation of petroleum resource. However, the tire rubber is difficult to be recycled due to the presence of its stable three-dimensional crosslinks. Currently, devulcanization is widely applied in the field of the waste rubber recycling. Through the devulcanizing process, the three-dimensional crosslinked network is broken and the devulcanized waste tire has the ability to reformulate and recycle into usable products.1
Various types of devulcanizing routes have been studied so far in order to improve the quality of the recycled products, such as chemical method, mechanical process, microwave technique, ultrasonic method and microbial method.2-13 However, some processes have weaknesses such
as environmental pollution and low efficiency.
Supercritical fluid devulcanizing technology is increasingly regarded as an available method for the devulcanization due to its environmental advantage and high efficiency. Crosslinked polymer could be recycled by employing supercritical alcohol. The crosslinked polyethylene has been selectively decomposed by supercritical alcohol and the recycled product could undergo the crosslinking reaction.14 Furthermore, supercritical alcohol is a kind of
solvent which has high chemical activity and could replace the catalyst in some cases. Such as in the degradation process of the alkali lignin, the use of a catalyst did not significantly affect the yields in both solvent systems with alcohol and water.15 In the field of tire rubber recovery, Kershaw16 tried
to degrade tire rubber to obtain the low molecular weight oil by supercritical ethanol, but most products maintained the macromolecular structure after reaction, which was very close to the devulcanization process. In our previous work,17
As is well known, temperature plays a very important role in the recycling of the crosslinked polymer by supercritical fluid. Increased reaction temperature could increase the amount of radicals and enhance the mobility of monomer, which results in a higher degradation rate of crosslinked network. In ScCO2 devulcanizing process, the
temperature was evaluated as the most significant factor by mathematical statistical method.18,19 Meanwhile, the
temperature was also the deciding factor for decrosslinking of polymer in supercritical alcohol.20 Under some conditions,
increased temperature not only accelerates the degradation of crosslinked network in dynamics, but also changes the activity of the supercritical fluids, which will further promote the reaction. Su et al.21 achieved the degradation of
polyethylene by using supercritical water, and demonstrated that the temperature has significant impact on both the degradation of crosslinked network and the activity of supercritical fluid. However, to the best of our knowledge, few studies about the influence of temperature on the supercritical ethanol devulcanizing process are reported.
In this work, we investigated the role of temperature on devulcanization of the sidewall rubber in supercritical ethanol. A full factorial experimental design was used to analyze the devulcanizing process. The chemical structures and thermal properties of the products were characterized. The reaction rate constant of devulcanizing process was obtained. In addition, a possible reaction path by the effect of temperature was discussed.
Experimental
Materials
The experimental feedstock was sidewall rubber obtained from a passenger car tire (Dunlop tires, model 215/60R16 95H, China). The rough rubber pieces were extracted in the azeotropic acetone/chloroform (3/7 v/v) mixture for 12 h in a Soxhlet extractor to remove the low molecular weight compounds. The extracted pieces were dried to constant weight in vacuum at 50 oC, and then trimmed
into strips (20 × 3 × 3 mm3) as the experimental samples.
The experimental samples will be referred to as vulcanizate later. The devulcanizing reagent, diphenyl disulfide (DPDS), was purchased from Energy Chemical, China. Ethanol, acetone, chloroform and toluene were supplied by Sinopharm Chemical Reagent Beijing Co., Ltd, China.
Characterization
Devulcanized product was analyzed by an EQUINOX55 Fourier transform infrared (FTIR) spectrophotometer
(Germany), and the spectrum of sol was taken in the range of 4000 to 400 cm-1 with potassium bromide crystals. Gel
permeation chromatography (GPC) was performed at 30 oC with a TDA302 chromatograph (USA) to detect the
molar mass and molar mass distributions (polydispersity index (PDI)) of sols. The glass transition temperature of vulcanizate and gel was characterized in the range of –100 to 40 oC, with a heating rate of 10 oC min-1 in liquid nitrogen
by a Q2000 differential scanning calorimeter (DSC) (USA). Thermogravimetry (TG) and derivative thermogravimetry (DTG) were performed in a nitrogen atmosphere with a SETSYS 16/18 thermogravimetric analyzer (France), at a heating rate of 10 oC min-1 in the range of 0 to 650 oC.
Experimental process
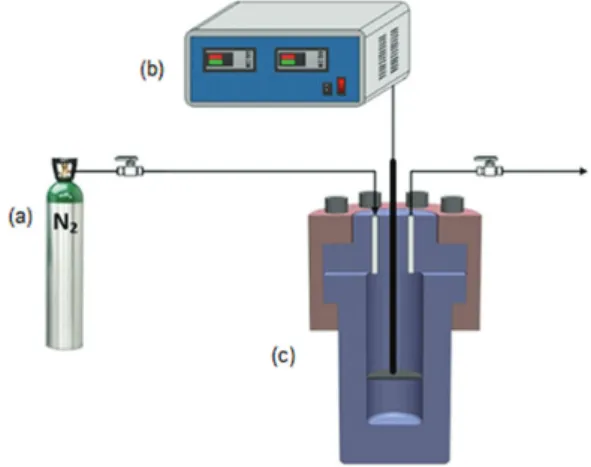
Devulcanizing reaction was performed in a stainless steel autoclave (100 mL, design pressure of 20 MPa and design temperature of 350 oC). The reaction process is shown in
Figure 1. A piece of stainless steel net, which the vulcanizate was placed on, was installed in the middle of the autoclave, and the ethanol was placed on the bottom of the autoclave. Nitrogen was fed into the autoclave, and then discharged for removing the air. This process was repeated five times before starting the reaction. The autoclave was filled with a certain volume of ethanol at ambient temperature, and then followed by heating to the target temperature. The final pressure was referred to as the target pressure, which was only controlled by the volume of ethanol and the target temperature. The heat was provided by an electric heating furnace. The average heating rate was 5 oC min-1. When the
reaction was completed, the autoclave was taken out of the furnace and cooled by a blower to ambient temperature.
The devulcanized product was dried to constant weight (Wd) in vacuum at the ambient temperature.
If the devulcanizing reagent were added during the
devulcanization process, the dried product would be extracted by acetone for 48 h to remove the unreacted devulcanizing reagent. Then the insoluble fraction was dried again to Wd at the same conditions. Subsequently, the
dried product was extracted by chloroform with a Soxhlet extractor for 24 h to obtain the soluble (sol) and insoluble (gel) products. The products were all dried to constant weight in vacuum at the ambient temperature. The sol was comprised of the liner rubber molecules, which were recyclable, and the gel still maintained the crosslinked structure. In general, the higher SF and lower CD of gel reflect a more efficient devulcanized process. The weights of dried sol and gel were Ws and Wg, respectively. The SF
was calculated as
(1)
where w is the weight percentage of rubber ingredient in the sidewall rubber.
The CD of vulcanizate and gel swollen in toluene was calculated by the Flory-Rehner equation:22
(2)
where v is the CD; vr is the volume fraction of the rubber
crosslinked network in the swollen gel; V0 is the molar
volume of the swelling solvent; and µ is the rubber-solvent interaction parameter, µ = 0.39.23
If the gel contained carbon black, vr was corrected by
equation 3:24
(3)
where vr0 is the corrected volume fraction of the rubber
crosslinked network in the swollen gel and z is the mass concentration of carbon black.
Results
Vulcanizate ingredients analysis
The conventional rubber compositions of tires are natural rubber (NR), styrene butadiene rubber (SBR), butadiene rubber (BR) and isobutylene isoprene rubber (IIR).25-28 In our previous experiment,17 we found that IIR
was easy to be devulcanized, and even degraded. Therefore, IIR layer was removed before devulcanization experiment.
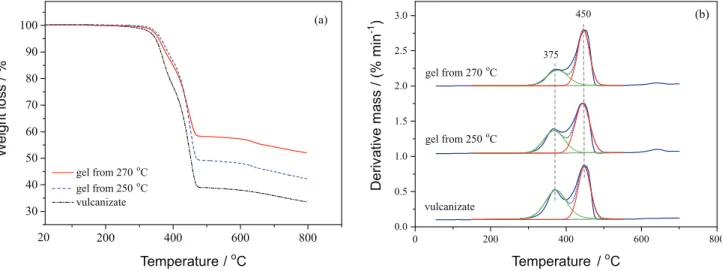
The ingredient of sidewall rubber was determined by TG-DTG, shown in Figure 2a. A mass loss of about 60% was observed in TG from 300 to 500 oC due to
the degradation of the rubber ingredient. The peaks of DTG around 375 and 455 oC represented the maximum
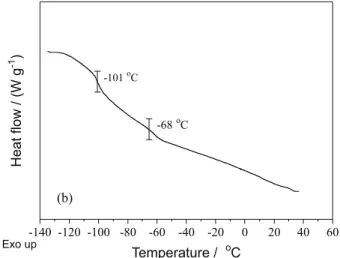
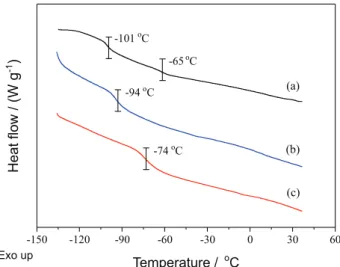
mass loss rate of NR and synthetic rubber (SBR or BR), respectively. After fitting analysis, the proportions of NR and synthetic rubber were 53.6 and 46.4%, respectively, in rubber composition. To further analyze the types of synthetic rubber, the sol was extracted from completely devulcanized sidewall rubber as sample for DSC and the analysis result is shown in Figure 2b. It can be observed that two glass transitions occurred at –68 and –101 oC, and the
latter corresponded to that of BR. Therefore, the synthetic rubber was BR in the sidewall rubber.
Full factorial experimental design
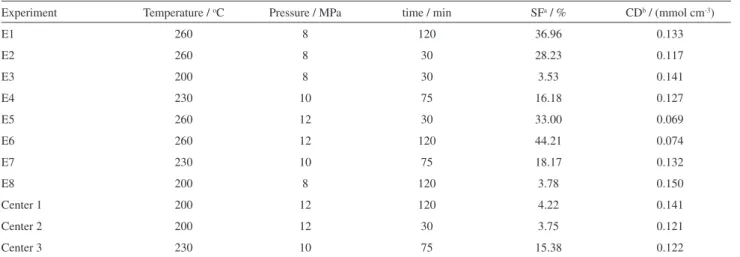
A full factorial experimental design was used to analyze the influence of the parameters on devulcanizing process. The objective functions were SF and CD of gel. The levels of each factor were chosen by our previous study and are
shown in Table 1.17 It is worth noting that the levels of
pressure were all greater than the critical value of ethanol.
The experimental design and its corresponding results are shown in Table 2. Three central point experiments were used to verify the accuracy, reproducibility and experimental error of regression model. The results of variant analyses are shown in Table 3. The influence of factors interaction on devulcanization was neglected because the main effect model agreed well with the experimental results. The probability value (p-value) of temperature was lower than 0.05 for SF and CD, and therefore temperature was
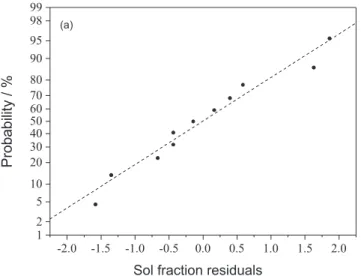
proven to be the only significant factor. Pressure and time had no appreciable effect on devulcanization. The normal probability plots of the residuals for responses are shown in Figure 3; no abnormal experimental points were observed.
For further analysis, the influence of temperature on devulcanization was studied (Figure 4). It could be observed that, in a low temperature region (from 210 to 240 oC),
the SF increased gradually from 7 to 13% (Figure 4a). As the reaction temperature changed from 240 to 270 oC, the
SF rose dramatically from 13 to 55%, however, it turned to depend weakly on the temperature around 56% in a higher temperature region (above 270 oC). There was an
obvious difference in the increase rate of SF below and above 240 oC which was around the critical temperature
of ethanol. This result showed that the devulcanizing process was accelerated when the ethanol entered into the supercritical state. The CDs at different temperatures are also shown in Figure 4b, and it can be seen that the CDs of devulcanized samples are all less than that of vulcanizate.
Table 1. Factors and levels of experimental design
Factor code Minimum level –1
Central level 0
Maximum level +1
Temperature / oC 200 230 260
Pressure / MPa 8 10 12
time / min 30 75 120
Table 3. Analysis and statistical factors of regression model of SF and CD
Variable DFa SF CD
SSb Fc p-Valued SSb Fc p-Valued
Model 3 2090.05 55.09 < 0.0001 0.00591 13.38 0.0028
T 1 2017.36 159.52 < 0.0001 0.00324 21.99 0.0022
P 1 19.84 1.57 0.2506 0.00235 15.93 0.0052
t 1 52.84 4.18 0.0802 0.00328 2.23 0.1794
Residual 7 88.52 0.00103
Lack of fit 5 84.37 8.12 0.1132 0.000986 8.86 0.1045
Pure error 2 4.16 0.0000445
Corrected total 10 2178.57 0.00694
aDegrees of freedom; bsum of square deviations from the overall mean; cF distribution ratio; dprobability value. SF: sol fraction; CD: crosslinking density
of gel; T: temperature; P: pressure; t: time.
Table 2. Full factorial design and experimental responses (SF and CD)
Experiment Temperature / oC Pressure / MPa time / min SFa / % CDb / (mmol cm-3)
E1 260 8 120 36.96 0.133
E2 260 8 30 28.23 0.117
E3 200 8 30 3.53 0.141
E4 230 10 75 16.18 0.127
E5 260 12 30 33.00 0.069
E6 260 12 120 44.21 0.074
E7 230 10 75 18.17 0.132
E8 200 8 120 3.78 0.150
Center 1 200 12 120 4.22 0.141
Center 2 200 12 30 3.75 0.121
Center 3 230 10 75 15.38 0.122
This implied that the supercritical ethanol permeated into the inside of vulcanizate and broke the crosslinked network. In supercritical ethanol, the CD of devulcanized samples decreased as the temperature goes up, and then, showed a slight increase when the temperature reached 270 oC. It
indicated that the reaction of crosslinking by the unsaturated butadiene units occurred again at a higher temperature.29
In the meantime, the molecular weight of sols decreased and the PDI increased as the reaction temperature rose (Table 4), revealing that some main chains were broken at the higher temperature.
In the previous study,19 we found that devulcanizing
reagent was necessary for the devulcanizing reaction in ScCO2. In order to analyze the influence of temperature
with devulcanizing reagent in supercritical ethanol, DPDSs in various concentrations were added in the reaction. The result is presented in Figure 5. It can be seen that the SF increased as the temperature rose at a certain
concentration of DPDS. In the case of a relatively low temperature such as 250 oC, the SF increased obviously
from 25 to 51% with an increase of DPDS from 0 to 12 g L-1. However, the influence of DPDS was not
obvious when the temperature reached a relatively high plateau such as 270 oC. This result demonstrated that the
devulcanizing reagent could accelerate the reaction rate at a relatively low temperature, but the effect was waning with the increase in temperature.
Figure 3. Normal probability plot of residuals for (a) SF and (b) CD of gel.
Figure 4. Effects of reactive temperature on (a) sols and (b) CD of gels. Reaction conditions: 8 MPa pressure, 60 min time.
Table 4. Characters of sol at various reaction temperatures
Temperature / oC Mna / (g mol-1) Mwb / (g mol-1) PDIc
230 64659 88937 1.375
250 40362 67903 1.682
270 37556 74583 1.986
In order to explore the effect of temperature on devulcanization mechanism in supercritical ethanol, the devulcanized samples compared with the vulcanizate were characterized and analyzed. All the devulcanized samples were obtained under the conditions of 8 MPa and 60 min.
Thermal analysis
The results of thermal analysis of vulcanizate and devulcanized gels are shown in Figure 6. The TG curve shapes between 300 and 500 oC are almost the
same (Figure 6a), indicating that the thermostability of devulcanized gels was similar to the vulcanizate. Moreover, the weight loss of devulcanized gels from 300 to 500 oC
decreased gradually with an increase in the reaction temperature. This can be attributed to the decrease of the polymer fraction in gels, which was in good conformity with the result in Figure 4a. Notably, the weight loss curve
of devulcanized gel shows a deviation to higher temperature owing to the proportional change of NR and BR in gels.30
In DTG, the peak intensity at 375 oC is weakened gradually
with an increase in temperature (Figure 6b). Through fitting analysis, the proportion of NR and BR in gels is shown in Table 5. It can be found that, after the devulcanization at 250 and 270 oC, the percentages of NR (39.2 and 33.5%,
respectively) in gels reduced significantly in comparision with that in vulcanizate (53.6%). Correspondingly, the ratios of NR/BR among the three samples, vulcanizate and devulcanized gels at 250 and 270 oC, tended to decrease.
These results implied that the devulcanizing reaction rate of NR was greater than that of BR in supercritical ethanol.
Results of DSC analysis of vulcanizate and devulcanized gels are shown in Figure 7. Clearly, there were two glass transitions in the DSC curve of vulcanizate (in Figure 7a). However, the glass transition at –65 oC, according to
NR, was not obvious in devulcanized gels (Figures 7b and 7c). This change implied that the most NR had been devulcanized and formed the sol in samples b and c, whose only glass transitions at –94 and –74 oC, respectively, were
due to BR. In general, the mobility of polymer chains was strengthened with a decrease in CD, which would result in a lower glass transition temperature. However, Levin et al.31 found that the mono-, di- and polysulfur Figure 5. Effect of DPDS on devulcanization in supercritical ethanol.
Reaction conditions: 8 MPa pressure, 60 min time.
Figure 6. Thermal analysis of vulcanizate and devulcanized gels. (a) TG and (b) DTG.
Table 5. Mass percentage of NR and BR through the DTG analysis
Sample Peak position /
oC Proportion / %
NR/BR ratio
NR BR NR BR
Vulcanizate 375 455 53.6 46.4 1.15
Gel at 250 oC 375 455 39.2 60.8 0.64
Gel at 270 oC 375 455 33.5 66.5 0.50
bonds would rearrange into cyclic sulfur structures at a higher temperature, which might decrease the molecular mobility in polymer and result in a significant increase of glass transition temperature. Based on this explanation, the significantly increase in the glass transition temperature of gels (b and c) whose main polymer component was BR should be due to the rearrangement of bonds.
Structure analysis of sols at various reaction temperatures
The FTIR analysis of sols at different reaction temperatures is shown in Figure 8. The characteristic bands around 500, 570 and 730 cm-1 refer to the presence of S–S
and C–S groups.32,33 It can be observed that the band of S–S
(500 cm-1) almost disappeared at different temperatures,
confirming the breaking of a large proportion of the crosslink bonds, i.e., the success of the devulcanization treatment.34
The bands located at 835 and 1372 cm-1, attributed
to C=CH stretching vibration and the –CH3 stretching
vibration, respectively, confirm the presence of NR in the sol.35,36 The intensity of these two bands does
not appreciably change with increment of treatment temperature, meaning that the C=C double bonds were not destroyed notably by the temperature rise. Therefore, a relatively complete polymer structure was maintained in sol.
The characteristic band at 970 cm-1 (the out-of-plane
bending vibrations of C–H of trans –CH=CH–) corresponds to butadiene in BR.26,30,37 It is worth noting that, compared
with other characteristic bands, the intensity of this band decreased with an increase in the reaction temperature, implying that the proportion of BR in the sol was reduced. It also proved that more NR was devulcanized to form the sol at higher temperature. This result agrees well with the change of NR/BR ratio in Table 5.
The bands between 1800 and 1500 cm-1, corresponding
to the C=C and C=O bonds, show that few changes take place at different temperatures.8,34 This result is in
agreement with the analysis above, indicating that the supercritical ethanol could make the main chain structure maintain integrality.
Band of C–H bond located in the range from 3100 to 2750 cm-1 does not show differences at different
temperatures,38,39 suggesting that the hydrocarbon backbone
of sidewall rubber was not destroyed by higher temperature in supercritical ethanol.
In the general process of devulcanization reaction, there is an inverse relationship between the SF and CD of gel. The CD of the vulcanized rubber gradually declines until the polymer chain breaks away from the crosslinking network, and a sol is formed. However, the SF and CD of gel, here, increase simultaneously with the rising of temperature as shown in Figure 4. According to the analysis of DTG and FTIR, the main composition of sols is NR. Correspondingly, the main composition of gels is BR. The
Figure 8. FTIR of sols at different reaction temperatures. (a) Sol from devulcanization at 250 oC and (b) sol from devulcanization at 270 oC. Figure 7. DSC analysis of vulcanizate and devulcanized gels.
(a) Vulcanizate; (b) gel from devulcanization at 250 oC and (c) gel from
high temperature causes more devulcanization of NR, but the increase in the CD of BR.
Model analysis of crosslinked network scission
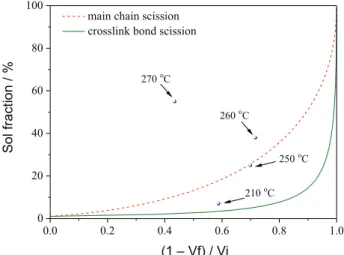
Horikx’s theory40 was used to determine the breakage
mechanism of crosslinked network during devulcanization. Figure 9 presents SF from devulcanizing sidewall rubber as a function of the relative decrease in CD at different temperatures. The solid curve corresponds to the devulcanizing process in which only crosslink bonds scission took place, and the dashed curve corresponds to the devulcanizing process in which only main chains scission occurred. When the temperature was 210 oC, the analysis
result fell near the solid curve, indicating that the formation of sol was mainly caused by crosslink bonds scission. The result was close to the dashed curve as the temperature reached 250 oC, implying that the breakage of main chain
gradually increased with the rising of temperature. When the temperature reached 260 or 270 oC, the results all fell
above the dashed curve, indicating that the devulcanization was mainly caused by main chains scission. Obviously, main chains scission gradually predominated with the rise of temperature during devulcanization. It means that the increase of SF was mainly dependent on the breakage of main chains.
Devulcanizing reaction rate
The reaction kinetics was used to further analyze the supercritical ethanol devulcanizing process. The objective function was gel concentration, and the calculation method is shown as equation 4. The initial gel concentration was 100%.
(4)
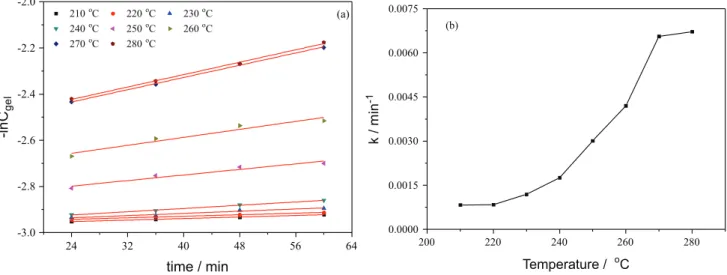
It was assumed that the devulcanizing process followed the first-order kinetics.14,20 The experimental results are
shown in Figure 10. The first-order kinetics equation is shown as
(5)
where Cgel is the gel concentration, t is the reaction time
and k is the reaction rate constant.
The following equations 6 and 7 can be obtained by integrating equation 5 from t0 to t (starting time and reaction
time, respectively). In this study, the reaction time during the elevation of temperature was ignored, and the integral was performed only within the isothermal period, thus the starting time t0 was 0.
(6)
(7)
where Cgel,0 is gel concentration at t = t0. The results of
plots in Figure 11a were obtained by equation 7. Further, the lines were calculated by the least-squared method and fitted well the measured variation of the gel concentration. The k value was calculated by the slope of lines as presented in Figure 11b. It can be observed that the k rose rapidly as the temperature was above 240 oC. This result further
demonstrated that supercritical ethanol played an important role in promoting devulcanization.
Discussion
In general, the crosslinked network is formed by mono-,
Figure 9. SF of devulcanized sidewall rubber against relative decrease in CD at different reaction temperatures.
di- and polysulfur bonds.41,42 In this study, with the increase
in temperature, not only the crosslink bonds but also some main chains were broken in supercritical ethanol process (Figure 9), which all had great influence on SF.
In Figure 4, there can be three regions of temperature: a low temperature region below 240 oC in subcritical
state, a medium temperature region from 240 to 270 oC
and a high temperature region above 270 oC. In the low
temperature region, the breakage of crosslinked bonds predominated the devulcanizing process, but reaction rate was relatively slow.
As the temperature reached the medium temperature region, the ethanol transferred to supercritical state. On one hand, the number of radicals increased due to the promotion on dynamics. The radicals had an instinctive tendency to couple and then form macromolecular structure fragments, which was the main compositions of sols.43 On
the other hand, the reaction activity of supercritical ethanol enhanced. As a result, the crosslinked structure broke rapidly and the sols increased sharply, with the unexpected occurrence of the main chain scission. Interestingly, due to the different structure properties between NR and BR, NR was easier to be devulcanized than BR as can be seen from the results of DTG and FTIR.
When the temperature further rose above 270 oC into the
high temperature region, the degradation rate of crosslinked structure was fast enough to ignore the effect of DPDS. Meanwhile, the main chains continued breaking, which predominated in the devulcanizing process. In addition, the cyclic sulfide structure transformed from the rearrangement of crosslinking bonds grafted onto the main chains, which resulted in the increase of glass transition temperature (as shown in Figure 7).
Based on the presented discussion, the proposed mechanisms for both NR and BR are presented in
Figure 11. Reaction rate constant. (a) –lnCgelvs. time and (b) k value vs. temperature.
Schemes 1 and 2. According to the result of Figure 4b, the unsaturated butadiene units in BR would transform to the crosslink structure at a high temperature as a result of devulcanization by ethanol. The possible reaction process of increase in CD is also proposed in Scheme 3.
Conclusions
The effect of temperature on devulcanization for sidewall rubber in supercritical ethanol was studied. A full factorial experimental design was used to define the experimental conditions. Reaction temperature was the most important factor in the devulcanization process. Reaction pressure above critical value and reaction time exert no significant influence. When the reaction temperature changed from 240 to 270 oC, the SF rose
dramatically from 13 to 55%. Meanwhile, the CD of devulcanized gel drastically reduced comparing with that of vulcanizate. The use of devulcanizing reagent did not significantly affect the SF at a high temperature of 270 oC.
Devulcanizing reaction rate of NR was faster than that of BR in supercritical ethanol. The mass percentage of NR/ BR in gels continued to decrease with the rise in reaction temperature as revealed by DTG analysis, which was in agreement with the results of DSC and FTIR.
The scission of the crosslink bonds predominated in devulcanization process at lower temperatures and the main chains began to be broken when the temperature reached 250 oC, which has been proved by the mode
when the temperature was above 240 oC, which indicated
that temperature had the most notable promoting effect in the supercritical ethanol devulcanizing process.
Acknowledgments
This work is supported by National Natural Science Foundation of China (51703013).
Scheme 1. Simplified mechanism proposed for the formation of sol during devulcanization of NR by supercritical ethanol.
References
1. Srinivasan, A.; Sanmugharaj, A. M.; Bhowmick, A. K. In Current Topics in Elastomer Research; Bhowmick, A. K., ed.; CRC Press: Boca Raton, 2008.
2. Rajan, V. V.; Dierkes, W. K.; Joseph, R.; Noordermeer, J. W. M.; Prog. Polym. Sci.2006, 31, 811.
3. Verbruggen, M. A. L.; Van der Does, L.; Noordermeer, J. W. M.; Van Duin, M.; J. Appl. Polym. Sci.2008, 109, 976. 4. Zhang, X. X.; Lu, Z. X.; Dong, T.; Li, H.; Lu, C. H.; J. Appl.
Polym. Sci.2013, 127, 4006.
5. Maridass, B.; Gupta, B. R.; Polym. Test.2004, 23, 377. 6. Ghosh, J.; Ghorai, S.; Bhunia, S.; Roy, M.; De, D.; Polym. Eng.
Sci.2018, 58, 74.
7. de Sousa, F. D. B.; Scuracchio, C. H.; Hu, G. H.; Hoppe, S.; J. Appl. Polym. Sci.2016, 133, ID 43503. DOI 10.1002/ APP.43503.
8. de Sousa, F. D. B.; Scuracchio, C. H.; Hu, G. H.; Hoppe, S.; Polym. Degrad. Stab. 2017, 138, 169.
9. Zanchet, A.; Carli, L. N.; Giovanela, M.; Brandalise, R. N.; Crespo, J. S.; Mater. Des.2012, 39, 437.
10. Isayev, A. I.; Rubber Chem. Technol.1995, 68, 267.
11. Mangili, I.; Lasagni, M.; Huang, K.; Isayev, A. I.; Chemom. Intell. Lab. Syst.2015, 144, 1.
12. Sato, S.; Honda, Y.; Kuwahara, M.; Kishimoto, H.; Yagi, N.; Muraoka, K.; Watanabe, T.; Biomacromolecules2004, 5, 511. 13. Tsuchii, A.; Tokiwa, Y.; J. Polym. Environ.2006, 14, 403. 14. Goto, T.; Yamazaki, T.; Sugeta, T.; Okajima, I.; Sako, T.; J. Appl.
Polym. Sci.2010, 109, 144.
15. Cheng, S.; Wilks, C.; Yuan, Z.; Leitch, M.; Xu, C.; Polym. Degrad. Stab.2012, 97, 839.
16. Kershaw, J. R.; Fuel1998, 77, 1113.
17. Li, X.; Liu, Z.; Wang, X.; Liu, F.; Wei, W.; Zhang, R.; Li, Z.; Xu, X.; Polym. Mater.: Sci. Eng.2016, 32, 112.
18. Mangili, I.; Oliveri, M.; Anzano, M.; Collina, E.; Pitea, D.; Lasagni, M.; J. Supercrit. Fluids2014, 92, 249.
19. Liu, Z.; Li, X.; Xu, X.; Wang, X.; Dong, C.; Liu, F.; Wei, W.; Polym. Degrad. Stab.2015, 119, 198.
20. Lee, H. S.; Ju, H. J.; Cho, H. K.; Koo, C. M.; Hong, S. M.; Kim, H.; Lee, Y. W.; Polym. Degrad. Stab. 2008, 93, 2084. 21. Su, X.; Zhao, Y.; Zhang, R.; Bi, J.; Fuel Process. Technol.2004,
85, 1249.
22. Flory, P. J.; Rehner, J.; J. Chem. Phys. 1943, 11, 521. 23. Sheehan, C. J.; Bisio, A. L.; Rubber Chem. Technol. 1966, 39,
149.
24. Porter, M.; Rubber Chem. Technol.1967, 40, 866.
25. Fukumori, K.; Matsushita, M.; Okamoto, H.; Sato, N.; Suzuki, Y.; Takeuchi, K.; JSAE Rev.2002, 23, 259.
26. Ramarad, S.; Khalid, M.; Ratnam, C. T.; Chuah, A. L.; Rashmi, W.; Prog. Mater. Sci.2015, 72, 100.
27. Naskar, A. K.; De, S. K.; Bhowmick, A. K.; Pramanik, P. K.; Mukhopadhyay, R.; Rubber Chem. Technol. 2000, 73, 902. 28. Klingensmith, B.; Rubber World1991, 203, 16.
29. Sarkar, M. D.; Mukunda, P. G.; De, P. P.; Bhowmick, A. K.; Rubber Chem. Technol.1997, 70, 855.
30. Fernández-Berridi, M. J.; González, N.; Mugica, A.; Bernicot, C.; Thermochim. Acta2006, 444, 65.
31. Levin, V. Y.; Kim, S. H.; Isayev, A. I.; Massey, J.; Meerwall, E. V.; Rubber Chem. Technol.1996, 69, 104.
32. Tao, G.; He, Q.; Xia, Y.; Jia, G.; Yang, H.; Ma, W.; J. Appl. Polym. Sci.2013, 129, 2598.
33. Colom, X.; Faliq, A.; Formela, K.; Cañavatea, J.; Polym. Test.
2016, 52, 200.
34. Aoudia, K.; Azem, S.; Aït Hocine, N.; Gratton, M.; Pettarin, V.; Seghar, S.; Waste Manage.2017, 60, 471.
35. Rooj, S.; Basak, G. C.; Maji, P. K.; Bhowmick, A. K.; J. Polym. Environ.2011, 19, 382.
36. Jana, G. K.; Das, C. K.; Polym.-Plast. Technol. Eng.2005, 44, 1399.
37. Masson, J.; Pelletier, L.; Collins, P.; J. Appl. Polym. Sci.2015, 79, 1034.
38. Karabork, F.; Pehlivan, E.; Akdemir, A.; J. Polym. Eng.2014, 34, 543.
39. Li, Y.; Zhao, S.; Wang, Y.; J. Polym. Environ.2012, 20, 372. 40. Horikx, M. M.; J. Polym. Sci.1956, 29, 1166.
41. Holst, O.; Stenberg, B.; Christiansson, M.; Biodegradation
1998, 9, 301.
42. Kojima, M.; Ogawa, K.; Mizoshima, H.; Tosaka, M.; Kohjiya, S.; Ikeda, Y.; Rubber Chem. Technol. 2003, 76, 957.
43. Jiang, K.; Shi, J.; Ge, Y.; Rui, Z.; Yao, P.; Li, X.; Zhang, L.; J. Appl. Polym. Sci.2013, 127, 2397.
Submitted: February 12, 2018
Published online: May 14, 2018
Scheme 3. The crosslinking reaction caused by unsaturated butadiene units at high temperature.