Macroeconomic and Institutional Factors, Debt
Composition and Capital Structure of Latin American
Companies
Cláudio Júnior Bernardo †
Pontifícia Universidade Católica de São Paulo (PUC/SP), São Paulo, SP, Brazil Tatiana Albanez Ω
Universidade de São Paulo (FEA/USP), São Paulo, SP, Brazil José Roberto Securato ¥
Universidade de São Paulo (FEA/USP), São Paulo, SP, Brazil
1. INTRODUCTION
Over the years, several studies have sought to explain how firms define their capital structure. The existing and still growing literature points out that understanding the drivers or determinants of corporate financing decisions remains a challenge for the academia and market players in general.
Considering the literature on the theme, it is important to punctu
-ate the seminal studies by Modigliani and Miller (1958; 1963), which generated numerous discussions about the relevance of decisions in
-volving the capital structure of companies, and, after these studies, several theories appeared with the intention of explaining how com
-panies make financing decisions, highlighting the theories of Trade-Off, Pecking Order (by Myers and Majluf, 1984; and Myers, 1984) and Market Timing (by Baker and Wurgler, 2002), focusing on taxes, in
-formational asymmetry and market opportunity windows, respectively.
This article has a Creative Commons License - Attribution 3.0 Not Adapted.
Corresponding author:
† Pontifícia Universidade Católica de São
Paulo (PUC/SP), São Paulo, SP, Brazil E-mail: claudiojrbernardo81@gmail.com
Ω Universidade de São Paulo (FEA/USP),
São Paulo, SP, Brazil E-mail: tatiana.albanez@usp.br
¥ Universidade de São Paulo (FEA/USP),
São Paulo, SP, Brazil E-mail: securato@usp.br
Received: 03/22/2016. Revised: 05/17/2016. Accepted: 12/06/2016. Published Online: 02/15/2018.
DOI: http://dx.doi.org/10.15728/bbr.2018.15.2.4 ABSTRACT
The objective of this research was to examine the influence of macroeconomic and institutional factors when determining the capital structure of Latin American companies from 2009 to 2014, and also analyze if the significance of these factors to explain the capital structure of the companies is changed taking into account the financing composition. We used hierarchical linear modeling to process data. The main results pointed that, both the representative variables of characteristics of the firm and representative variables of countries are important determinants of the capital structure of the companies. However the variables of the firm explain a much higher percentage of variance of leverage. Thus, we emphasize that there is still much to be done in order to analyze the effects of macroeconomic and institutional factors. We expect that this study has created contributions to the national literature, by using a theoretical and also econometric approach that has not been much explored so far. As well as for market agents to examine the determinants of capital structure, considering the institutional aspects.
Keywords: Capital structure; Macroeconomic factors; Institutional factors; Hierarchical linear models; Financing decisions.
BBR
15,2
153
Many national studies (Nakamura et al., 2007; Medeiros and Daher, 2008; Machado and Maia, 2009; Mendes et al., 2009, Rossi Jr. and Marotta, 2010, Vallandro et al., 2010; and Albanez and Lima, 2014, among others) and international ones (Shyam-Sunder and Myers, 1999; Fama and French, 2002; Frank and Goyal, 2003; Kayhan and Titman, 2007; Hovakimian and Li, 2011, among others) were dedicated to test the aforementioned theo
-ries, advancing in the understanding of the financial decisions made by the companies. However, most of the studies consider only specific or intrinsic factors to the companies, when it is known that the company is inserted in an institutional environment capable of influencing its decision-making process, either by the availability and supply of resources, or by the existence of specific financing lines of the market in which it operates, such as the financing lines of the National Bank for Economic and Social Development (BNDES) in Brazil. Furthermore, the diverse economic agents of this environment can also influence the decisions of the companies, such as shareholders, creditors, government, employees, sup
-pliers, customers, regulators, etc. Thus, the financial decisions made by companies can be influenced by the external environment in which they are inserted as well as by the agents of that environment, as verified by La Porta et al. (1998) and Carvalho (2009).
According to Santos (2013), the macroeconomic and institutional variables are the most significant in relation to the external environment, because they play an important role in the relationship between the company and its financier, affecting to some degree the financing structure of the companies. In this regard, it is possible to note how institutional changes are able to impact the financing and, consequently, the level of investments made by the companies, as occurred after the issuance of the Instruction CVM n.476/2009, which provides for public offerings of securities distributed with restricted efforts.
This instruction aimed at reducing the costs of emissions, facilitating companies’ access to the capital markets and, according to Tarantin Jr. and Valle (2015), ended up directly affecting the amount of debentures issued as of 2009 and the very BNDES participation in the leverage and maturity of debts of Brazilian companies.
In this context, it is also possible to mention the enactment of Instruction CVM n.566/2015, which lengthened the issuance of promissory notes offering another long-term financing alternative for companies in Brazil, boosting the participation of companies in the capital market. Another important step in this direction is the enactment of the law N° 12.431/11, which establishes a privileged tax regime for income from assets intended for the financing of long-term investment, as tax benefits for holders of infrastructure debentu
-res, seeking to make the issuance of securities attractive and to increase access to the capital market.
Despite the evidence, the study of macroeconomic and institutional variables deter
-mining corporate indebtedness is relatively recent when compared to other theoretical ap
-proaches of capital structure literature. Authors such as Rajan and Zingales (1995), La Porta et al. (1997; 1998), Demirgüç-Kunt and Maksimovic (1998), Booth et al. (2001), Jong et al. (2008), Ramirez and Kwok (2010), Zheng et al. (2012) and Jõeveer (2013) stud
-ied and confirmed the importance of the firm variable to determine the capital structure of companies even in different macroeconomic scenarios, but the firm variable behaves in dif
BBR
15,2
154
In Brazil, recent studies have analyzed institutional and macroeconomic variables and ob
-tained important results, as Terra (2007), Bastos et al. (2009), Kayo and Kimura (2011), Valle and Albanez (2012), Santos (2013) and Martins and Terra (2014; 2015). We point out that, con
-sidering the different approaches and econometric modeling, there is no consensus in studies on the representativeness of institutional factors in relation to the characteristic factors of firms. Terra (2007) finds that, unlike previous studies, the explanatory power of macroeco
-nomic factors is compensated by the specific factors of firm, much more important in the analysis carried out, but it points out that there are still unknown factors which seem to be decisive in determining the leverage of companies. This result is also corroborated by Bastos et al. (2009) in a similar sample.
Kayo and Kimura (2011) affirm that, although firm variables are more important to determine the capital structure of companies from developed and emerging countries, there is evidence of significant indirect influences of industry and country level variables on the determinants of cor
-porate leverage and emphasize that managers should not ignore the importance of the external environment, which has the power to influence the internal characteristics of the firm.
In this regard, when analyzing the influence of financing lines originating from the BNDES in the capital structure of Brazilian companies, Valle and Albanez (2012) verified that the inclusion of access to these sources, together with classic variables commonly used in the models of analysis for the level of indebtedness, contributed to the understanding of the capital structure of companies.
Findings by Martins and Terra (2014; 2015) also confirm the importance of external factors in determining the capital structure of firms. In their first study, the authors verify that the country’s financial development facilitates access to third-party resources and that institutional quality is negatively related to leverage. In their second study however, the au
-thors verify that the measures of financial development and quality of the institutions also indirectly impact on the maturity of the indebtedness of companies of the sample. Thus, both papers confirm the influence of institutions on the capital structure of companies (via leverage and debt maturity), which is reflected directly on their financing decisions and, consequently, expansion of business via investments.
When discussing the determinants of corporate leverage, it is important for us to consid
-er not only the demand side of resources (companies), but also the supply side (creditors), directly affecting the volume of resources available and access to credit by companies.
As aforementioned, there is much to be done to analyze the influence of factors external to the firm in determining its capital structure. Thus, this study seeks to investigate the fol
-lowing research question: what is the influence of macroeconomic and institutional factors on the financing decisions of companies located in Latin America? Thus, the main objec
-tive of this research is to examine the influence of macroeconomic and institutional factors in determining the capital structure of Latin American companies. As a specific objective, we intend to examine whether the significance of these factors in explaining the capital structure of companies is changed considering the decomposition of short and long term financing. The sample is made up of six Latin American countries that together account for 85% of Latin America’s GDP, according to data from the World Bank (2014).
The objectives of this study resemble those by Terra (2007), Bastos et al. (2009) and Martins and Terra (2014), who sought to investigate the importance of external factors on the financing decisions of Latin American companies. However, this work differs from the others when analyzing two groups of variables, representative of macroeconomic and in
-stitutional factors (including a variable representative of the level of corruption and ethics of the countries analyzed), whereas the cited studies use mostly macroeconomic variables. The study also differs from those by Terra (2007) and Bastos et al. (2009) by the econo
-metric modeling employed (Hierarchical Linear Modeling – HLM or multilevel regres
BBR
15,2
155
of the analysis and the nested data structure (companies from different countries analyzed over a period of time), as well as by the sample and period of analysis.
Therefore, we hope that this study may generate new contributions to the literature of the area, scarce compared to other approaches, especially since it uses an econometric approach that has not yet been explored, as is the literature on institutional factors within the capital structure literature. We also hope that the research contributes with capital market agents by analyzing the determinants of the capital structure considering the institutional aspects, so relevant in countries such as those analyzed in this research, as well as the importance of these variables when deci
-ding on financing by companies considering markets with different characteristics of fun-ding. In addition, the research brings practical contributions to managers by pointing out the most relevant firm characteristics to determine the companies’ financing capacity and, conse
-quently, affecting their capital structure, enabling investments. It also contributes to regula
-tory bodies by providing the basis for the elaboration of policies aimed at increasing access to the capital market and the level of investments made by companies (as did Instructions CVM n.476/2009 and 566/2015 and the law N° 12.431/11), in addition to public policies to streng
-then the quality of institutions and the level of investor protection (e.g. law N°10.303/01), which may reflect positively on the financial market and the country’s economic scenario.
2. THEORETICAL FRAMEWORK
One of the seminal works of capital structure literature dealt with the irrelevance of financ
-ing decisions to determine firm value. Rely-ing on the assumptions of perfect markets and tax absence, Modigliani and Miller (1958) demonstrated that the only relevant decision would be to invest resources. According to the authors, the increase in indebtedness causes the share
-holder to demand a greater return on the assumed risk. Thus, the increase in the cost of eq
-uity would compensate for the increase in leverage with the use of lower cost debt, without changing the company’s weighted average cost of capital, thus making the capital structure irrelevant, only if the funds raised were invested in assets that maximize the firm value.
Subsequently, when considering the presence of taxes, Modigliani and Miller (1963) acknowledge that financing provides a fiscal benefit through the use of debt, since the use of debt generates a deductible financial expense for the calculation of income tax capable of reducing the weighted average cost of capital, directly impacting the value of the company; therefore, the capital structure becomes relevant.
Based on studies by Modigliani and Miller (1958; 1963), great discussions were estab
-lished, with new theories emerging, which take on assumptions such as the presence of taxes, informational asymmetry and windows of market opportunity. The theories aligned with these assumptions are: Trade-Off, Pecking Order and Market Timing.
The Trade-Off Theory is analyzed from the perspective of the existence of an optimal level of indebtedness achieved through a trade-off between the costs and benefits of debt use, according to Myers (2001). In this regard, companies seek a balance between the fiscal benefit of the debt and the costs of bankruptcy or financial difficulties linked to its use. It is assumed that, in order to increase the value of the company, the decisions to readjust the capital structure are alternated between use of debt and equity.
BBR
15,2
156
that involves the issue of agency conflicts, in this case, between managers and shareholders, according to Jensen and Meckling (1976) and Jensen (1986).
Another important point discussed in this theoretical approach concerns the capital struc
-ture adjustment costs, thus the approach of the dynamic trade-off models appears. Several re
-cent studies using partial fit models at the target level (Leary and Roberts, 2005; Flannery and Rangan, 2006; Strebulaev, 2007; Hovakimian and Li, 2011) point out that adjustment costs may lead companies to not continually readjust their capital structures and, as a result, companies will rebalance their structures only occasionally when the benefits outweigh the adjustment costs.
As for the Pecking Order theory, by Myers and Majluf (1984) and Myers (1984), the companies follow a preference order by type of financing, preferring internal financing (via internally generated resources) to external financing. If there is a need for additional fund
-ing, it will opt for a source of resources that presents a lower risk of informational asym
-metry, in this case, debt issuance, with the issuance of shares being the last option.
According to Myers and Majluf (1984), this order of preference is based on the information transmitted to the market for each type of issued security: if the company issues debt, the signal
-ing is positive, represent-ing financ-ing capacity and good investment projects, since the creditors have ample access to information about the company. The issuance of shares however, may represent that they are overvalued; as otherwise, the company would refuse to issue these securi
-ties. This negative signaling would be able to reduce the share price in the issue announcement. Thus, this financing alternative would be the last one to be used by the company.
Posteriorly, Myers (1984) opposes the trade-off and pecking order theories in the expla
-nation of the financial behavior of the companies and exposes what he terms the “modified pecking order”, more consistent with the empirical evidence for considering both, the exis
-tence of informational asymmetry and the costs of financial difficulties.
Several studies have sought to test the trade-off and pecking order theories in the national literature (Brito and Silva, 2005; Nakamura et al., 2007; Medeiros and Daher, 2008; Machado and Maia, 2009) and international studies (Shyam-Sunder and Myers, 1999; Fama and French, 2002; Frank and Goyal, 2003; Kayhan and Titman, 2007; Hovakimian and Li, 2011), find
-ing evidence in favor of both theories. However, these theories cannot explain why companies sometimes opt for the issuance of shares even though they still have the capacity to finance debt.
Thus, the Market Timing Theory comes in, attributed to Baker and Wurgler (2002). According to this theory, companies choose to issue shares when it is considered that the share price is overvalued to the market in relation to the book value, indicating a lower cost of issuance when compared to other forms of financing. At this point, there would be a window of market opportunity for the issuance of shares.
Baker and Wurgler (2002) used a historical average of the market-to-book index as the main independent variable to capture the behavior of market timing and to explain the le
-verage of companies. As main results, the authors found that high market values contribute to the reduction of short-term indebtedness, and high historical market values are consistent with low debt ratios. The evidence found is significant and point out that the market-to-book index has a significant impact on corporate indebtedness and, consequently, in the definition of its capital structure. In Brazil, studies such as Mendes et al. (2009), Rossi Jr. and Marotta (2010), Vallandro et al. (2010), Albanez and Lima (2014) and Albanez (2015) found evidence in favor of the Market timing theory.
BBR
15,2
157
However, the study of institutional (legal risk, protection of creditors and investors, protection of property rights, quality of institutions, level of corruption, etc.) and macro
-economic variables (GDP, income, inflation, interest rate, foreign exchange, development of the capital market, etc.) in the determination of the capital structure of companies is relatively recent in the literature of the area when compared to other theoretical approaches. In the international literature, the studies of La Porta et al. (1997; 1998), Demirgüç-Kunt and Maksimovic (1998), Booth et al. (2001), Jong et al. (2008), Ramirez and Kwok (2010), Zheng et al. (2012) and Jõeveer (2013). In Brazil, we highlight the studies by Terra (2007), Bastos et al. (2009), Kayo and Kimura (2011), Valle and Albanez (2012), Santos (2013) and Martins and Terra (2014; 2015). Next, in Table 1, we have a summary of the objectives and main results obtained in recent national papers on the theme. As can be observed, there is important evidence of the influence of macroeconomic and institutional factors of the environment where the company is inserted regarding its financing decisions and definition of its capital structure.
3. RESEARCH METHOD
3.1. HYPOTHESES
The research hypotheses are related to the effects of macroeconomic and institutional factors on corporate leverage, as well as to the importance of these factors to determine their capital structure considering the composition of short- and long-term financing. Thus, we have as research hypotheses:
• Hypothesis 1: Macroeconomic and institutional factors are important determinants of
the variation of corporate leverage over time.
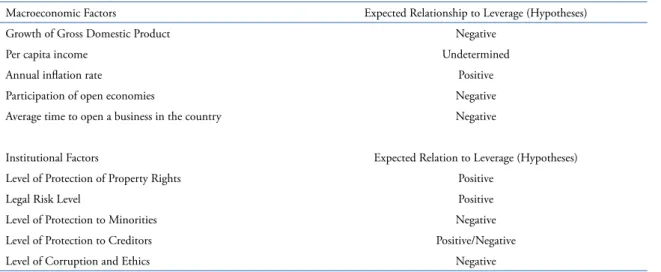
This first hypothesis can be dismembered according to Table 2, considering the different factors and the expected relationship with the leverage of the companies according to the the
-oretical framework that bases this research, as La Porta et al. (1997; 1998), Demirgüç-Kunt and Maksimovic (1998), Booth et al. (2001), Jong et al. (2008), Bastos et al. (2009), Ramirez and Kwok (2010), Jõeveer (2013), Santos (2013) and Martins and Terra (2014; 2015).
• Hypothesis 2: The importance of macroeconomic and institutional factors to determine
the capital structure of companies is altered by considering the composition of short- and long-term financing.
When testing the proposed hypotheses, we hope to contribute to the understanding of the determinants of the capital structure of companies located in different economic and institutional contexts.
3.2. Population and sample
The surveyed population was composed of all publicly traded companies from six Latin American countries: Argentina, Brazil, Chile, Colombia, Mexico and Peru, analyzed during the period 2009-2014. From this population, some filters were needed when operating the variables used in the work, resulting in the analysis of a sample.
BBR
15,2
158
Table 1. Main empirical evidence in the national literature.
Authors Objetives of the Studies Main Empirical Evidence
Bastos et al. (2009)
To analyze the determinants of the capital structure of publicly-held companies in Latin America taking into account
the specific aspects of the firm and and also the institutional and macroeconomic aspects of each country. The study comprised a sample of 388 companies from 2001 to 2006,
with the companies belonging to the following countries: Mexico, Brazil, Argentina, Chile and Peru. The data analysis
was performed using the econometric data panel technique.
It concludes that the Pecking Order theory explains more strongly the indebtedness of companies in the analyzed countries. It is also considered that macroeconomic and institutional factors, have collaborated to justify that, in times of economic growth, companies decrease their financial
leverage, where the variable GDP growth was the most relevant statistically speaking.
Kayo and Kimura (2011)
To analyze the relationship between indebtedness and 3 levels of determinants: year, firm and industry in emerging
and developed markets. The work brought two important contributions to the study of capital structure, with the first being the use of the multilevel analysis model that contributed to the analysis of the simultaneous influence of the three levels of determinants on indebtedness, and the second important
contribution is the analysis of two variables related to the sector: Munificence and Dynamism.
"The results show that the variance of indebtedness is explained in 65.1% by the independent firm-specific variable,
26.9% explained due to time and 8% due to the sector. Regressions were significant for most of the firm's specified variables, except for the variable Size. Regarding the variables
related to the sector, Munificence showed a positive and significant sign with the indebtedness of the companies."
Valle and Albanez (2012)
To analyze the influence of institutional factors represented by sources of resources with subsidized interest rates and foreign currencies on indebtedness. The period comprised the years 1997 to 2006. In the analysis of the firm's specific variables,
the traditional ones found in the literature we considered and, for the institutional explanatory variable, the type of company financing was analyzed, indicating whether the type
of financing is subsidized or market, in national currency or foreign currency. The quantitative method used was data panel
analysis.
The results show that the differentiated sources of resources and foreign currency lines had a significant participation in the indebtedness of Brazilian companies. It was concluded that the inclusion of access to different sources in the analysis model to understand the indebtedness of Brazilian companies contributed to the understanding of the capital structure of
the same, which demonstrates the importance of analyzing institutional factors in capital structure studies.
Santos (2013)
To analyze the importance of the firm and country-specific variables in the companies' indebtedness and if there is a variation of the importance of these variables in countries with different economic contexts and in periods of economic growth or contraction. We analyzed 10,243 companies based in 61 different countries from 2002 to 2011. The three-level hierarchical linear regression model with repeated measures
is used.
The results show that the indebtedness is explained to a greater degree by the characteristics of the firm and time and, to a lesser extent, but also significant, by the characteristics of the environment. The study also identified that the firm's specific variable did not have significant changes in its behavior even in distinct economic environments and in periods before and after economic crises. In relation to the analyzed country variables, these presented a behavior that was adverse and little
explanatory, and neither did it show any behavioral changes when compared in different economic environments.
Martins and Terra (2014)
To analyze the role of the national scenario (Macroeconomics, Financial Development and Institutional Quality) and characteristics of the sectors of activity in determining the
capital structure of companies in Latin America. A total of 612 publicly traded companies from 7 Latin American countries were analyzed. A comparison was also conducted
with 847 companies from the United States. The period of analysis comprised the years 1996 to 2009. The Linear
Hierarchical Model was used for the analysis.
The result is that Financial Development facilitates access to third-party capital resources and Institutional Quality is
negatively related to corporate indebtedness. Additionally, there is evidence that the Institutional Quality can promote the asymmetric development between the stock market and
credit.
Martins and Terra (2015)
To analyze the influence of different groups of factors (firm and macroeconomic variables) in the variance of corporate debt maturity in Latin America. Publicly held companies from 7 Latin American countries were analyzed, in addition to American companies as a comparison, totaling 1820 companies. The period of analysis covered the years 1996 to 2009. Linear Hierarchical
Model and Factor Analysis were used for the analysis.
The results suggest that the variations over time and between firms are the major sources of variations in the maturity of the debt. The size, liquidity of the company, the real interest rate and
the financial development of the country stand out as the main determinants of the maturity of the debts. Also, the financial development and quality measures of the institutions indirectly impacted the indebtedness maturity by means of the size variable.
The initial sample of active public companies from all countries contained 828 compa
-nies belonging to the six Latin American countries, excluding sector funds, finance, insu
-rance and holding companies, and we used Economatica database to obtain financial data. We used data from the consolidated financial statements of all companies, as of December 31 of each year, in thousands of dollars (USD).
From this initial sample, some filters were applied when operating the variables, such as the exclusion of companies with negative equity in all years and companies with less than two years of consecutive data for analysis. After the application of these filters and the calculation of all variables, the final sample consisted of 608 companies. The macroeco
BBR
15,2
159
Business), World Economic Forum (The Global Competitiveness Index - GCI) and the World Federation of Exchanges (WFE).
3.3. Operational definition of variables
We used leverage indicators at book value and market value as dependent variable, as in Bastos et al. (2009). Financial leverage was also segregated in terms of current liabilities (short term) and noncurrent liabilities (long term), as the aforementioned authors.
We used variables representative of firm-specific characteristics identified in the litera
-ture as explanatory variable (Rajan and Zingales, 1995; Fama and French, 2002; Frank and Goyal, 2003; Myers, 2001; Baker and Wurgler, 2002) as important determinants of the capital structure, and they are: Size, Tangibility, Profitability, Risk, Liquidity, Growth op
-portunities and Market-to-book index. To obtain the financial accounts and calculation of these variables we used the Economatica database.
Country-specific variables were also used (representative of macroeconomic and in
-stitutional factors). The data for the operationalization of these variables were collected from the World Bank website (Doing Business), World Economic Forum (The Global Competitiveness Index - GCI) and the World Federation of Exchanges (WFE), mainly for variables related to the capital market of each country. We used five variables to represent the macroeconomic factors and five variables to represent the institutional factors more specifically, whose selection is based on previous studies, such as La Porta et al. (1997; 1998), Demirgüç-Kunt and Maksimovic (1998), Booth et al. (2001), Terra (2007), Bastos et al. (2009), Jõeveer (2012), Santos (2013), Martins and Terra (2014; 2015). Therefore, the following macroeconomic variables were tested in the models:
a) Growth of Gross Domestic Product (Growt_GDP): a negative relationship is ex
-pected between this variable and leverage, since the greater the GDP growth, the greater the probability of generating resources by companies and retaining profits, with this being the main source of resources of the companies according to the pecking order theory;
b) Per capita income (Income): the relationship between this variable and the everage is undetermined and will be analyzed later;
c) Annual inflation rate (Infl): a positive relationship between this variable and leverage is expected, since an increase of inflation generates an economic retraction and a greater difficulty of generation of resources by the companies, leading to a higher level of indebtedness. Moreover, for Bastos et al. (2009), this positive relationship is justified considering that inflation depreciates the nominal amounts of debts, making them more attractive to the borrower;
Table 2. Research hypotheses for macroeconomic and institutional factors.
Macroeconomic Factors Expected Relationship to Leverage (Hypotheses)
Growth of Gross Domestic Product Negative
Per capita income Undetermined
Annual inflation rate Positive
Participation of open economies Negative
Average time to open a business in the country Negative
Institutional Factors Expected Relation to Leverage (Hypotheses) Level of Protection of Property Rights Positive
Legal Risk Level Positive
Level of Protection to Minorities Negative
Level of Protection to Creditors Positive/Negative
BBR
15,2
160
d) Participation of publicly traded companies in the economy (Part_Comp): a ne
-gative relationship is expected between this variable and leverage, since publicly traded companies would have other financing alternatives via capital markets in countries where the market is more developed (Santos, 2013);
e) Average time to open a business in the country (T_Buss): a negative relationship between this variable and leverage is expected, since the longer the time to start a business, the longer it will take for companies to seek external financing. For Bastos et al. (2009), this variable may also represent the transaction costs of the market under analysis, which would cause companies to be less indebted, leading to a negative relationship with leverage.
We also tested other macroeconomic variables, such as: number of listed compa
-nies, foreign direct investment, real interest rate, spread, tax burden and capital ma
-rket development (World Economic Forum Index), however, these variables did not contribute to the improvement of the models and, since they did not present statistical significance, they were discarded from the analysis.
To represent factors essentially institutional, we considered the following variables: a) Property right (Prop_Rig): this variable was obtained from the World Economic Forum (The Global Competitiveness Index) and aims to measure the strength of property rights protection in the country, including financial assets, being represented by a scale from 1 (extremely weak) to 7 (extremely strong). A positive relationship between this variable and leverage is expected. According to Santos (2013), in economies where the level of protection of property rights is high, there is a lower contractual cost due to the minimization of opportu
-nistic behavior of agents over contracts, which reduces the costs of monitoring, encouraging the increase of transactions in this market. Such a view is also supported by Jõeveer (2012);
b) Legal Risk (Legal_Risk): this variable was obtained from the World Economic Forum (The Global Competitiveness Index) and it measures how efficient the legal system is for private business in resolving disputes, being represented by a scale from 1 (extremely inefficient) to 7 (extremely efficient). A negative relationship between this variable and le
-verage is expected, indicating that the greater the efficiency of the legal system (the higher the indicator), the lower the leverage. According to Santos (2013), in countries where the legal environment presents greater enforcement, agency conflicts tend to be lower, stimu
-lating the raising of funds through the issuance of shares;
c) Minority protection (Min_Prot): this variable was obtained from the World Economic Forum and measured to what extent the interests of minority investors are protected by the legal system, being represented by a scale from 1 (unprotected) to 7 (completely protected). A negative relation between this variable and the leverage is expected, according to Jõeveer (2012), since agency conflicts are lower in countries where the legal environment presents greater enforcement and investor protection, encouraging the raising of funds by compa
-nies through the issuance of shares. This view is also supported by La Porta, et al. (1998); d) Creditors protection (Cred_Prot): this variable was obtained from the World Bank
(Doing Business) and measures the extent to which bankruptcy laws protect creditor’s rights, thus facilitating credit supply, with it being represented by a scale from 0 (weak) to 12 (strong). It is possible to expect both signs for this variable and leverage, since in countries with greater enforcement of debt contracts, the greater the credit supply by creditors (La Porta, et al., 1998). However, it is also possible to expect a negative relation, since in countries with great
-er creditor protection, enforcement will be great-er in times of financial difficulties (recov-ery and bankruptcy), reducing the incentives to raise funds through debt issuance;
e) Corruption and Ethics (Corrup_Et): this variable was obtained from the World Economic
Forum (The Global Competitiveness Index) and is composed of an aggregated value of indica
BBR
15,2
161
politicians; frequency of irregular payments (bribe); ethics of companies in their relationships with government, politicians and other companies; among other aspects, and the higher the in
-dicator, the better (less corruption and higher ethics). 1according to Jõeveer (2012), it is possible to expect a positive relationship between this indicator and corporate leverage, since the larger the indicator (lower corruption), the greater the protection of contracts and legal stability, as well as less information asymmetry, leading to an increase in the availability of credit.
We also tested other variables that could represent institutional factors such as informa
-tion quality, accountability and corporate board efficiency; however, these variables did not contribute to the improvement of the models, being discarded from the analysis.
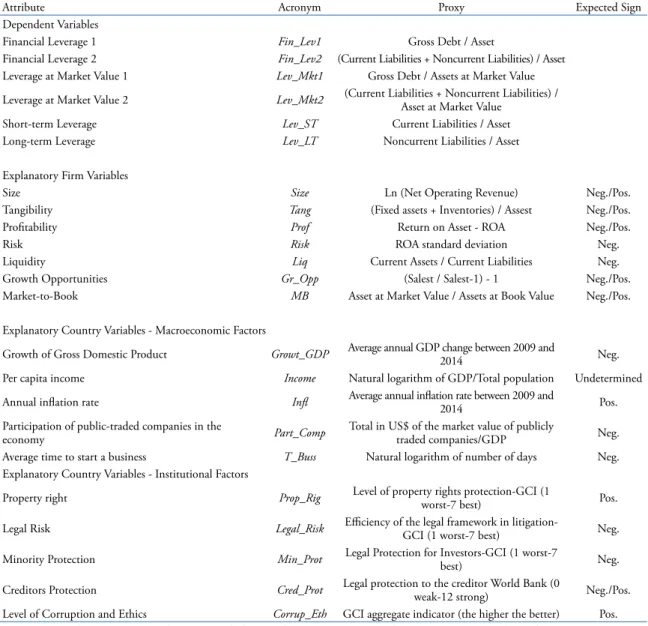
Table 3 shows all the variables used in the study, the form of operationalization, as well as the expected signs between these variables and the level of corporate indebtedness according to the capital structure theories. The natural logarithms of the absolute value of some variables were used in order to reduce problems related to residues heteroscedasticity due to the order of magnitude of these variables and possible outliers. As required for the multilevel analysis, we used the means of the independent variables in the period for each firm and country.
Table 3. Description of the variables used in the study.
Attribute Acronym Proxy Expected Sign
Dependent Variables
Financial Leverage 1 Fin_Lev1 Gross Debt / Asset
Financial Leverage 2 Fin_Lev2 (Current Liabilities + Noncurrent Liabilities) / Asset Leverage at Market Value 1 Lev_Mkt1 Gross Debt / Assets at Market Value
Leverage at Market Value 2 Lev_Mkt2 (Current Liabilities + Noncurrent Liabilities) /
Asset at Market Value Short-term Leverage Lev_ST Current Liabilities / Asset Long-term Leverage Lev_LT Noncurrent Liabilities / Asset
Explanatory Firm Variables
Size Size Ln (Net Operating Revenue) Neg./Pos.
Tangibility Tang (Fixed assets + Inventories) / Assest Neg./Pos.
Profitability Prof Return on Asset - ROA Neg./Pos.
Risk Risk ROA standard deviation Neg.
Liquidity Liq Current Assets / Current Liabilities Neg.
Growth Opportunities Gr_Opp (Salest / Salest-1) - 1 Neg./Pos. Market-to-Book MB Asset at Market Value / Assets at Book Value Neg./Pos.
Explanatory Country Variables - Macroeconomic Factors
Growth of Gross Domestic Product Growt_GDP Average annual GDP change between 2009 and 2014 Neg.
Per capita income Income Natural logarithm of GDP/Total population Undetermined
Annual inflation rate Infl Average annual inflation rate between 2009 and 2014 Pos.
Participation of public-traded companies in the
economy Part_Comp
Total in US$ of the market value of publicly
traded companies/GDP Neg. Average time to start a business T_Buss Natural logarithm of number of days Neg. Explanatory Country Variables - Institutional Factors
Property right Prop_Rig Level of property rights protection-GCI (1
worst-7 best) Pos.
Legal Risk Legal_Risk Efficiency of the legal framework in
litigation-GCI (1 worst-7 best) Neg.
Minority Protection Min_Prot Legal Protection for Investors-GCI (1 worst-7
best) Neg.
Creditors Protection Cred_Prot Legal protection to the creditor World Bank (0 weak-12 strong) Neg./Pos.
Level of Corruption and Ethics Corrup_Eth GCI aggregate indicator (the higher the better) Pos.
BBR
15,2
162
3.4. Specification of the models and method of data analysis
We elaborated models of analysis of the possible determinants of leverage, considering variables representative of firm characteristics, in addition to explanatory variables repre
-sentative of macroeconomic and institutional factors. Thus, the general model for analysis of the proposed relationship can be described in a simplified way as:
Leveraget = f (firm variablest, macroeconomic and institutional factorst)
To analyze the variables and the proposed relationship, we used descriptive statistics and Hierarchical Linear Modeling (HLM), with the Stata software. By the characteristics of the sample (companies from different countries analyzed over a period of time), we consider the hierarchical linear regression model in which each level of the data structure (year, firm and country) is represented by its own model.
According to Fávero et al. (2009), the hierarchical linear models represent a genera
-lization of the regression methods and, in comparison to the traditional linear regression models, the multilevel models have the advantage of taking into account the analysis of hierarchically structured data, in an analysis framework within which we can recognize the models that represent each level, as well as the importance of each level to explain the variation of the dependent variable, offering researchers possibilities to test more complex hypotheses.
Regarding the inherent endogeneity of the regression models, the hierarchical linear models tend to reduce it due to the grouping and contextualization process of the analyzed relations helping to control latent variables, not observed directly, but has its effect captured by the grouping process, as can be observed in Courgeau (2003) and Smith (2011).
Within this econometric approach, when the same individuals or observations are measured on more than one occasion (as it is in this study with the companies being analyzed over time), this model is known as a hierarchical model with repeated measures. As we analyzed three levels in this study (year, firm and country), the model is termed as the three-level hierarchical model with repeated measures.
Considering the unbalanced nature of the data, most hierarchical linear models are estimated by the maximum likelihood method in the integral concept (full maximum likelihood or ML). As we have three levels under analysis, we performed three types of estimation: 1) the Bayesian empirical estimation of the random coefficients of levels 1 and 2; 2) estimation by maximum likelihood in the integral concept, which refers to an estimation by Generalized Least Squares of the coefficients of level 3; and 3) estimation by maximum likelihood of the components of variance and covariance. For this purpose, we defined three sub-models, where there is t = 1, ...., Tij years in level 1, which are nested in each i = 1, ..., nj firms, which, in turn, are nested in j = 1, ..., j countries.
Thus, we have in level 1 that:
ytij = π0ij + r1ij . YEARtij + etij, in which:
t = 1, 2, ..., Tij (years), j = 1, 2, ..., J (countries) and i = 1, 2, ..., nj (firms); π0ij: expected va
-lue of the variable y (mean) of the firm ij in year 1; r1ij: growth rate of variable Y of the firm
ij; and σ2: variance of etij (variance of the firm over time), assuming that etij ~ NID(0, σ2).
Each level 1 coefficient becomes a dependent variable in the level 2 model. Thus, it can be written as:
πpij = βp0j + βp1j.X1ij + βp2j.X2ij + ... + βpQpj.XQpij + rpij
BBR
15,2
163
βp0j (q = 0, 1, ..., Qp) are the coefficients of level 2; Xqij is the vector of predictor variables of level 2; and rpij is the random effect of level 2, assuming that rpij ~ NID(0, τπpp).
The level 3 model can be represented by:
Bpqj = γpq0 + γpq1.W1j + γpq2.W2j + ... + γpqSpq.WSpq + upqj
Bpqj = γpq0 + ∑γpqs.Wsj + upqj, in which:
γpqs (s = 0, 1, ..., Spq) are the coefficients of level 3; Wsj is the vector of predictor variables of level 3; and upqj is the random effect of level 3, assuming that upqj ~ NID(0, τβ).
In the following chapter the results of the models mentioned above will be presented and analyzed for each dependent variable analyzed.
4. ANALYSIS OF RESULTS
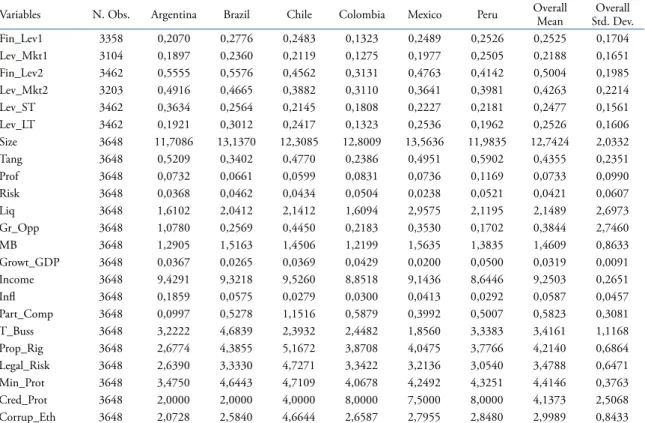
Table 4 presents the descriptive statistics (means) of the dependent and explanatory variables used in the models of determinants of corporate leverage belonging to the six countries analyzed in the period 2009-2014: Argentina, Brazil, Chile, Colombia, Mexico and Peru, as well as the mean and standard deviation for each sample variable.
Table 4. Descriptive statistics (averages by country, mean and standard deviation)
Variables N. Obs. Argentina Brazil Chile Colombia Mexico Peru Overall Mean Std. Dev.Overall
Fin_Lev1 3358 0,2070 0,2776 0,2483 0,1323 0,2489 0,2526 0,2525 0,1704 Lev_Mkt1 3104 0,1897 0,2360 0,2119 0,1275 0,1977 0,2505 0,2188 0,1651 Fin_Lev2 3462 0,5555 0,5576 0,4562 0,3131 0,4763 0,4142 0,5004 0,1985 Lev_Mkt2 3203 0,4916 0,4665 0,3882 0,3110 0,3641 0,3981 0,4263 0,2214 Lev_ST 3462 0,3634 0,2564 0,2145 0,1808 0,2227 0,2181 0,2477 0,1561 Lev_LT 3462 0,1921 0,3012 0,2417 0,1323 0,2536 0,1962 0,2526 0,1606 Size 3648 11,7086 13,1370 12,3085 12,8009 13,5636 11,9835 12,7424 2,0332 Tang 3648 0,5209 0,3402 0,4770 0,2386 0,4951 0,5902 0,4355 0,2351 Prof 3648 0,0732 0,0661 0,0599 0,0831 0,0736 0,1169 0,0733 0,0990 Risk 3648 0,0368 0,0462 0,0434 0,0504 0,0238 0,0521 0,0421 0,0607 Liq 3648 1,6102 2,0412 2,1412 1,6094 2,9575 2,1195 2,1489 2,6973 Gr_Opp 3648 1,0780 0,2569 0,4450 0,2183 0,3530 0,1702 0,3844 2,7460 MB 3648 1,2905 1,5163 1,4506 1,2199 1,5635 1,3835 1,4609 0,8633 Growt_GDP 3648 0,0367 0,0265 0,0369 0,0429 0,0200 0,0500 0,0319 0,0091 Income 3648 9,4291 9,3218 9,5260 8,8518 9,1436 8,6446 9,2503 0,2651 Infl 3648 0,1859 0,0575 0,0279 0,0300 0,0413 0,0292 0,0587 0,0457 Part_Comp 3648 0,0997 0,5278 1,1516 0,5879 0,3992 0,5007 0,5823 0,3081 T_Buss 3648 3,2222 4,6839 2,3932 2,4482 1,8560 3,3383 3,4161 1,1168 Prop_Rig 3648 2,6774 4,3855 5,1672 3,8708 4,0475 3,7766 4,2140 0,6864 Legal_Risk 3648 2,6390 3,3330 4,7271 3,3422 3,2136 3,0540 3,4788 0,6471 Min_Prot 3648 3,4750 4,6443 4,7109 4,0678 4,2492 4,3251 4,4146 0,3763 Cred_Prot 3648 2,0000 2,0000 4,0000 8,0000 7,5000 8,0000 4,1373 2,5068 Corrup_Eth 3648 2,0728 2,5840 4,6644 2,6587 2,7955 2,8480 2,9989 0,8433
BBR
15,2
164
By analyzing the descriptive statistics, we can notice that among the leverage, firm, macroeco
-nomic and institutional variables, there are countries that differ substantially from the others, as is the case in Colombia, with the lowest leverage indicators, in general. Among the firm variables, Mexico and Brazil stand out with the market-to-book index; Argentina for the growth opportuni
-ties; Mexico with more liquid and larger companies; Peru and Argentina with greater tangibility of assets; and Colombia and Peru with more profitable companies, but also of greater risk.
Among the macroeconomic indicators of countries, the growth of the GDP of Peru and Colombia during the period is highlighted; the high inflation rate in Argentina and the small sha
-re of companies in their GDP, diffe-rent from what happens in Chile, the country with the highest participation; and the time it takes to open a business in Brazil, which surpasses all countries.
Among the institutional indicators, it is worth highlighting the best indicators of proper
-ty rights, legal risk and protection of minorities in Chile, which is also highlighted by the lowest level of corruption; Argentina and Brazil have the lowest creditor protection when compared to the others. As for corruption and ethics, the worst indicators are from Brazil and Argentina.
We also performed tests of parametric and nonparametric means (Anova and Kruskal-Wallis) which pointed out statistically significant differences for the study variables, jus
-tifying the multilevel analysis employed. These tests were not presented in the study, but may be requested from the authors.
Before analyzing the models, we also examined the correlations between firm and coun
-try explanatory variables and corporate leverage indicators. Due to space limitations, these tables were also not presented in the study.
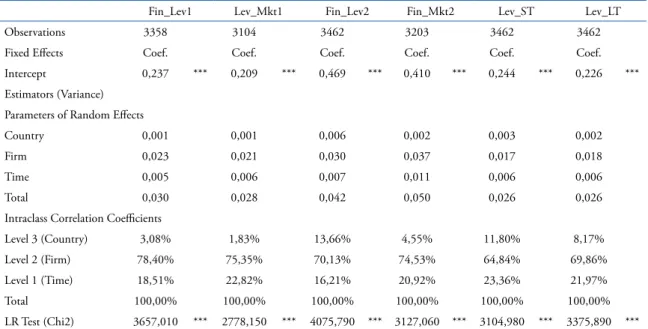
In the following tables, the results of the models are presented. In Table 5 are the results for the null model (or empty), which considers only the mean of the leverage variable by means of the intercept, for all leverage indicators.
Table 5. Determinants of leverage: null model.
Fin_Lev1 Lev_Mkt1 Fin_Lev2 Fin_Mkt2 Lev_ST Lev_LT
Observations 3358 3104 3462 3203 3462 3462
Fixed Effects Coef. Coef. Coef. Coef. Coef. Coef.
Intercept 0,237 *** 0,209 *** 0,469 *** 0,410 *** 0,244 *** 0,226 *** Estimators (Variance)
Parameters of Random Effects
Country 0,001 0,001 0,006 0,002 0,003 0,002
Firm 0,023 0,021 0,030 0,037 0,017 0,018
Time 0,005 0,006 0,007 0,011 0,006 0,006
Total 0,030 0,028 0,042 0,050 0,026 0,026
Intraclass Correlation Coefficients
Level 3 (Country) 3,08% 1,83% 13,66% 4,55% 11,80% 8,17% Level 2 (Firm) 78,40% 75,35% 70,13% 74,53% 64,84% 69,86% Level 1 (Time) 18,51% 22,82% 16,21% 20,92% 23,36% 21,97%
Total 100,00% 100,00% 100,00% 100,00% 100,00% 100,00%
LR Test (Chi2) 3657,010 *** 2778,150 *** 4075,790 *** 3127,060 *** 3104,980 *** 3375,890 ***
BBR
15,2
165
This model without variables is important because it allows verifying the relative im
-portance of each level to explain the variation of the leverage. This is done through the ICC (IntraClass Correlation Index), which represents the variance decomposition of the leverage between the levels. It is possible to notice that most of the variability of the inde
-btedness is due to the difference between characteristics of companies (from 65% to 78%), and a relevant percentage of variance in the indebtedness was due to the time evolution in each firm or characteristics of the companies over time (from 16% to 23%). A much lower percentage of variance is due to differences between countries (from 2% to 14%), even in models where indebtedness is broken down between short and long terms. However, it is possible to notice that a greater percentage of explanation for the country variables is verified in the models of the financial leverage 2 (13.66%) and short-term (11.80%) and long-term leverage (8.17%).
It is also noted that in all models the maximum likelihood test (LR Test) rejects Ho, con
-firming that the estimator used in the multilevel regression adds significance to the models, with it being a better than the non-pooled linear regression estimator.
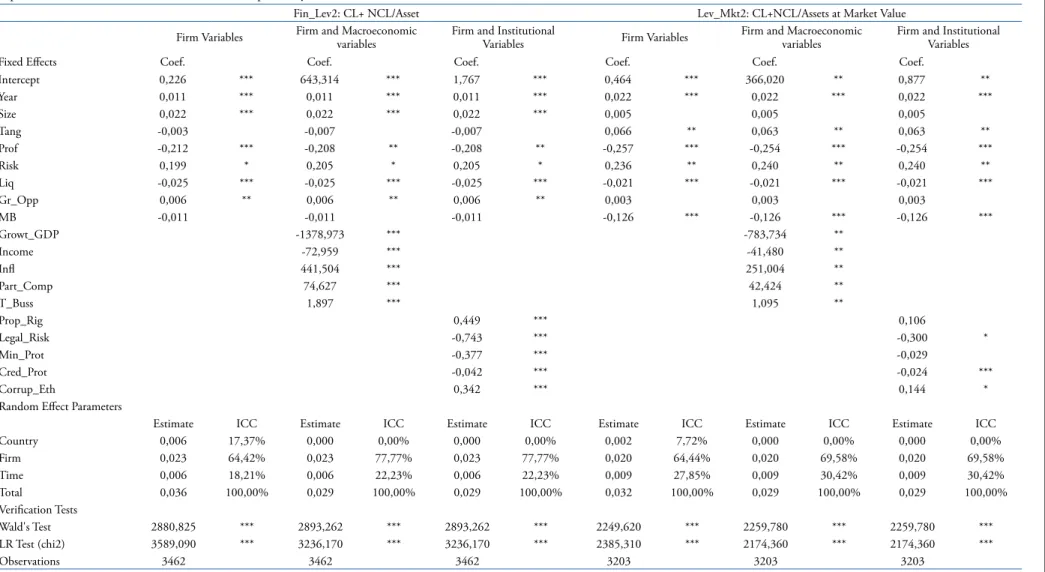
In Table 6, we analyze the determinants of leverage 1, at book value and at market value. These indicators consider the Gross Debt in the numerator. In Table 7, we analyze the determinants of leverage 2, at book and market value. These indicators consider the sum of Current Liabilities and Noncurrent Liabilities in the numerator. In the first column of each quadrant of the tables we find the model with the firm variables; in the second column, the model considering the firm variables and the variables representative of macroeconomic factors; and in the third column, the model considering the firm variables and the variables representative of institutional factors.
We verify in Tables 6 and 7, through Wald’s test results, that all the models were signifi
-cant to explain the variation of the leverage level of the companies over the years.
In all columns of Tables 6 and 7, we calculated the ICC (IntraClass Correlation Index), with it being possible verifying that the firm level is the most important to explain the vari
-ance of the indebtedness in all models of the tables. This may indicate that, although the macroeconomic and institutional context of each country is relevant to explain the changes in corporate indebtedness over time, the firm variables are more important to explain the financing decisions of companies in each country.
In several studies (Kayo and Kimura, 2011; Santos, 2013; Martins and Terra, 2014; 2015), the lower levels variables (firm characteristics) explain a much higher percentage of variance of leverage than the variables of higher levels (country characteristics). For Kayo and Kimura (2011), this result can be explained by the fact that country characteristics vary much less over time than firm characteristics, more dynamic. Thus, according to the authors, it cannot be said that country-level characteristics are less important because they explain a lower percentage of variance, since these factors vary less than firms’ leverage over time.
It is also noted that in all models, the LR test rejects Ho, confirming that the estimator used in the multilevel regression adds significance to the models, with it being better than the non-pooled linear regression estimator.
BBR
15,2
166
Table 6. Determinants of leverage 1 (at book value and market value). Hierarchical Linear Regressions.
Dependent Variables: Fin_Lev1 and Lev_Mkt1. Explanatory variables: firm, macroeconomic and institutional variables.
Fin_Lev1: Gross Debt/Asset Fin_Mkt1: Gross Debt/Assets at Market Value
Firm Variables
Firm and Macroeconomic
variables
Firm and Institutional
Variables Firm Variables
Firm and Macroeconomic
variables
Firm and Institutional
Variables
Fixed Effects Coef. Coef. Coef. Coef. Coef. Coef.
Intercept 0,013 567,845 *** 0,158 0,125 *** 433,024 *** -0,187 Year 0,007 *** 0,007 *** 0,007 *** 0,014 *** 0,014 *** 0,014 *** Size 0,020 *** 0,020 *** 0,020 *** 0,010 *** 0,010 *** 0,010 ***
Tang 0,034 0,026 0,026 0,069 *** 0,064 ** 0,064 **
Prof -0,185 ** -0,184 ** -0,184 ** -0,163 ** -0,167 ** -0,167 **
Risk -0,082 -0,084 -0,084 0,042 0,034 0,034
Liq -0,011 *** -0,011 *** -0,011 *** -0,010 *** -0,010 *** -0,010 ***
Gr_Opp 0,000 0,000 0,000 -0,001 -0,001 -0,001
MB -0,019 ** -0,020 ** -0,020 ** -0,066 *** -0,066 *** -0,066 ***
Growt_GDP -1215,186 *** -925,792 ***
Income -64,419 *** -49,113 ***
Infl 388,870 *** 296,262 ***
Part_Comp 65,860 *** 50,188 ***
T_Buss 1,666 *** 1,276 ***
Prop_Rig 0,092 -0,056
Legal_Risk -0,342 ** -0,151
Min_Prot 0,032 0,179
Cred_Prot -0,014 ** -0,006
Corrup_Eth 0,197 ** 0,108
Random Effect Parameters
Estimate ICC Estimate ICC Estimate ICC Estimate ICC Estimate ICC Estimate ICC Country 0,001 3,90% 0,000 0,00% 0,000 0,00% 0,001 3,89% 0,000 0,00% 0,000 0,00% Firm 0,020 75,73% 0,019 78,58% 0,019 78,58% 0,016 70,29% 0,015 72,89% 0,015 72,89% Time 0,005 20,37% 0,005 21,42% 0,005 21,42% 0,006 25,82% 0,006 27,11% 0,006 27,11% Total 0,026 100,00% 0,025 100,00% 0,025 100,00% 0,022 100,00% 0,021 100,00% 0,021 100,00% Verification
Tests
Wald's Test 3096,159 *** 3104,870 *** 3104,870 *** 2793,260 *** 2801,682 *** 2801,682 *** LR Test
(chi2) 3395,560 *** 3292,100 *** 3292,100 *** 2477,380 *** 2369,390 *** 2369,390 ***
Observations 3358 3358 3358 3104 3104 3104
Notes: Coef.: coefficients; ICC: IntraClass Correlation Index (% of explanation of each group based on the explained variance); Wald’s Test: regression significance test; LR Test: maximum likelihood test (multilevel regression versus non-pooled regression); ***, ** and * indicate significance of 1%, 5% and 10%, respectively; Estimation method: Maximum Likelihood (ML). Random intercept model.
The variable profitability is statistically significant in all models of Tables 6 and 7, confirming the relationship predicted by the pecking order theory, according to which more profitable com
-panies are less leveraged because they prefer the use of internally generated resources. It should be emphasized that this variable was the one that presented the highest coefficient among the rep
-resentative firm variables, maintaining the persistence and significance of the signs in all models. The risk variable did not present statistical significance in the models in Table 6, as well as the variable growth opportunities. In the models of Table 7, the risk variable gains signifi
-cance, presenting a positive relation with leverage, i.e., riskier businesses (with more volatile results) are also more indebted than the others. In the model of Financial Leverage 2 of Table 7, the variable growth opportunities also gains statistical significance, presenting a positive sign, indicating that the greater the growth opportunities, the greater the leverage. This sign is justified by the modified pecking order theory (by Myers, 1984), according to which compa
BBR
15,2
167
Table 7. Determinants of leverage 2 (at book value and market value). Hierarchical Linear Regressions.
Dependent Variables: Fin_Lev2 and Lev_Mkt2. Explanatory variables: firm, macroeconomic and institutional variables.
Notes: Coef.: coefficients; ICC: IntraClass Correlation Index (% of explanation of each group based on the explained variance); Wald’s Test: regression significance test; LR Test: maximum likelihood test (multilevel regression versus non-pooled regression); ***, ** and * indicate significance of 1%, 5% and 10%, respectively; Estimation method: Maximum Likelihood (ML). Random intercept model.
Fin_Lev2: CL+ NCL/Asset Lev_Mkt2: CL+NCL/Assets at Market Value
Firm Variables Firm and Macroeconomic
variables
Firm and Institutional
Variables Firm Variables
Firm and Macroeconomic variables
Firm and Institutional Variables
Fixed Effects Coef. Coef. Coef. Coef. Coef. Coef.
Intercept 0,226 *** 643,314 *** 1,767 *** 0,464 *** 366,020 ** 0,877 **
Year 0,011 *** 0,011 *** 0,011 *** 0,022 *** 0,022 *** 0,022 ***
Size 0,022 *** 0,022 *** 0,022 *** 0,005 0,005 0,005
Tang -0,003 -0,007 -0,007 0,066 ** 0,063 ** 0,063 **
Prof -0,212 *** -0,208 ** -0,208 ** -0,257 *** -0,254 *** -0,254 ***
Risk 0,199 * 0,205 * 0,205 * 0,236 ** 0,240 ** 0,240 **
Liq -0,025 *** -0,025 *** -0,025 *** -0,021 *** -0,021 *** -0,021 ***
Gr_Opp 0,006 ** 0,006 ** 0,006 ** 0,003 0,003 0,003
MB -0,011 -0,011 -0,011 -0,126 *** -0,126 *** -0,126 ***
Growt_GDP -1378,973 *** -783,734 **
Income -72,959 *** -41,480 **
Infl 441,504 *** 251,004 **
Part_Comp 74,627 *** 42,424 **
T_Buss 1,897 *** 1,095 **
Prop_Rig 0,449 *** 0,106
Legal_Risk -0,743 *** -0,300 *
Min_Prot -0,377 *** -0,029
Cred_Prot -0,042 *** -0,024 ***
Corrup_Eth 0,342 *** 0,144 *
Random Effect Parameters
Estimate ICC Estimate ICC Estimate ICC Estimate ICC Estimate ICC Estimate ICC
Country 0,006 17,37% 0,000 0,00% 0,000 0,00% 0,002 7,72% 0,000 0,00% 0,000 0,00%
Firm 0,023 64,42% 0,023 77,77% 0,023 77,77% 0,020 64,44% 0,020 69,58% 0,020 69,58%
Time 0,006 18,21% 0,006 22,23% 0,006 22,23% 0,009 27,85% 0,009 30,42% 0,009 30,42%
Total 0,036 100,00% 0,029 100,00% 0,029 100,00% 0,032 100,00% 0,029 100,00% 0,029 100,00%
Verification Tests
Wald's Test 2880,825 *** 2893,262 *** 2893,262 *** 2249,620 *** 2259,780 *** 2259,780 ***
LR Test (chi2) 3589,090 *** 3236,170 *** 3236,170 *** 2385,310 *** 2174,360 *** 2174,360 ***
BBR
15,2
168
The liquidity variable confirms the relationship obtained between the variable profit
-ability and leverage, also in accordance with the pecking order theory, in which companies with greater financial freedom tend to be less indebted, maintaining the persistence and significance of the sign in all models.
Finally, the market-to-book variable, with a persistent sign, confirms the relationship expected by the market timing theory, in which companies with greater market-to-book re
-lationships are less leveraged, since they may prefer to issue shares at times of high market values, exploiting windows of opportunity for the issuance of securities.
The effect of external factors on the companies’ capital structure was analyzed through macroeconomic and institutional variables. We verified that all macroeconomic variables were statistically significant to explain the level of leverage at book and market value of companies in each country in all models of Tables 6 and 7.
In relation to the signals obtained, as in Terra (2007), Bastos et al. (2009) and Kayo and Kimura (2011), the variable GDP growth presented a negative relationship with leverage, as expected, pointing out that the higher the GDP growth the lower the indebtedness of the companies. Given this result it is possible to infer that in times of economic growth compa
-nies would be able to generate more resources internally to finance their activities, and this is the preferred financing source for companies according to the pecking order theory due to information asymmetry in the market. For Terra (2007), this result may also indicate that firms opt for a low-debt strategy during business cycle expansions.
At the same time, this result is surprising if we consider that in times of economic growth there are more resources available in the economy and greater access to credit, which could lead to a positive relationship. However, confirming the sign of the variable GDP, the per cap
-ita income variable also presented negative sign with leverage in all the models, We can as
-sume that the higher the income, the greater the consumption and the profitability of the com
-panies, and this could lead to lower indebtedness due to the generation of internal resources. The inflation rate variable also presented the expected sign with leverage, indicating that the higher the inflation, the higher the indebtedness, since an increase of the inflation generates an economic retraction and a greater difficulty of generation of resources by the companies. The signs obtained for the variables GDP growth, per capita income and infla
-tion rate are in agreement with the signs found by Bastos et al. (2009) and Santos (2013). The signs obtained for the variables GDP growth, per capita income and inflation rate are in agreement with the signs found by et al. (2009), indicating a positive relation with leverage. Regarding the participation of publicly traded companies in GDP, it is possible to infer that publicly traded companies have greater financing capacity and are seeking to finance via credit market rather than capital markets, which is common in Brazil, because most of the companies that opened capital in recent years did not return to issue primary shares, according to Albanez and Lima (2014). This positive relationship between public companies’ participation in GDP and leverage is also found by Santos (2013).
Regarding the variables representative of institutional factors, the property rights vari
-able presents a positive and significant coefficient in the model of leverage 2 at book value, as expected, indicating that the greater the protection of property rights, the greater the leverage, as in La Porta, et al. (1997).
The legal risk and creditor protection variables present persistent and significant nega
BBR
15,2
169
fewer incentives for leverage, considering that creditors have greater enforcement power to enforce contracts in times of financial difficulties (recovery and bankruptcy).
The minority protection variable presents a significant negative sign in the leverage model 2 at book value, also confirming the expected relationship with leverage, in markets where investor protection is greater, there are greater incentives and easiness for compa
-nies to raise funds through the issuance of shares, confirming the result obtained with the variable legal risk. This result is also found by La Porta, et al. (1997), Jõeveer (2012) and Santos (2013). Martins and Terra (2014) also affirm that the quality of institutions can nega
-tively affect the level of indebtedness by increasing the issuance of shares in that market. The variable corruption and ethics presents a persistent and significant positive sign in all models, except in the model of leverage 1 at market values. The obtained sign is in ac
-cordance with Jõeveer (2013) and indicates that the lower the corruption, the greater the protection of contracts and legal stability, leading to a possible increase in the availability of credit and leverage of companies.
As aforementioned, the variables legal risk, creditors protection and level of corruption and ethics were those that presented more robust results, maintaining the persistence of signs and statistical significance in almost all models, emphasizing the importance of the institutional environment and its reflexes on the financial decisions of the companies.
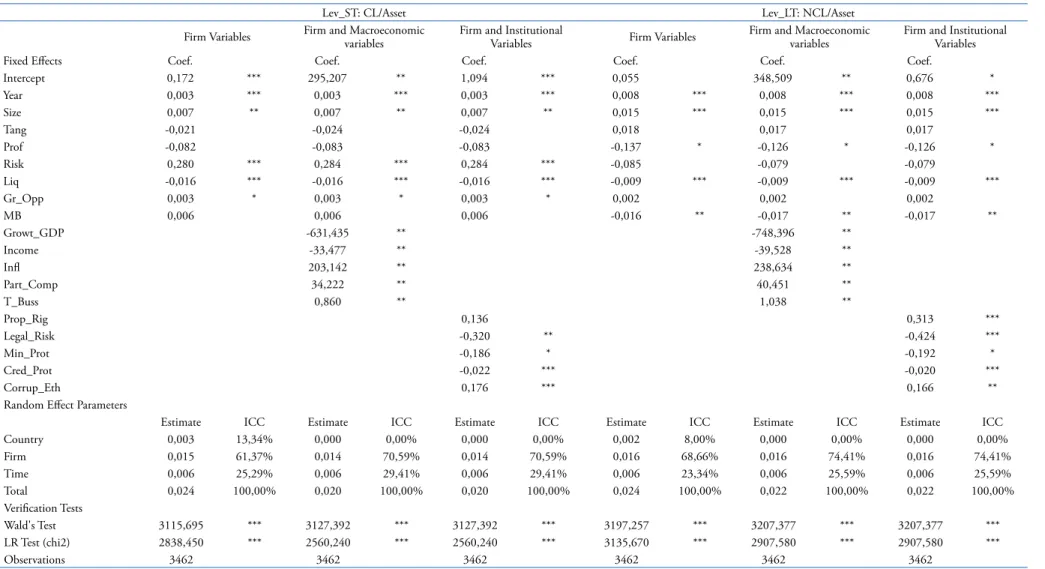
Table 8 below shows the results of the models in which corporate leverage is broken down into short-term (current liabilities) and long-term (non-current liabilities).
By analyzing Table 8, we can observe that the results do not change significantly con
-sidering the firm, macroeconomic and institutional variables in terms of the percentage of explanation of the variation of leverage (ICC) for each factor, contrary to what was expec
-ted. The signs and significance of the variables do not change significantly either.
As before, all models presented statistical significance, however, firm-specific variables were more important to explain the variance of firms’ leverage between the different coun
-tries, and this result does not change even when leverage is broken down into short and long term. These results are in line with the studies by Kayo and Kimura (2011), Santos (2013) and Martins and Terra (2014).
Thus, hypothesis 1 of the study is confirmed, since the representative variables of ma
-croeconomic and institutional factors presented statistical significance in all the models, demonstrating the importance of these factors in explaining the capital structure of com
-panies. However, firm variables are more significant in all models, even considering short- and long-term leverage, not confirming hypothesis 2.
5. FINAL CONSIDERATIONS
The study of the impact of macroeconomic and institutional variables on decisions in
-volving the capital structure of companies is relatively recent and scarce in the national literature. Thus, the main objective of this research is to examine the influence of macro
-economic and institutional factors in determining the capital structure of Latin American companies in the period 2009-2014. We used hierarchical linear models for data treatment, which consider six indicators of leverage as dependent variables and explanatory vari
-ables of firm (characteristics of companies) and country (macroeconomic and institutional factors).
As main results, we verified that both the representative variables of firm characteris
-tics and the representative variables of country are important determinants of the capital structure of companies. However, the firm variables explain a much higher percentage of variance of leverage.
Among the firm variables, it is worth mentioning the weight of the coefficient of the prof
BBR
15,2
170
Table 8. Determinants of short-term and long-term leverage at book value. Hierarchical Linear Regressions.
Dependent Variables: Lev_ST and Lev_LT. Explanatory variables: firm, macroeconomic and institutional variables.
Notes: Coef.: coefficients; ICC: IntraClass Correlation Index (% of explanation of each group based on the explained variance); Wald’s Test: regression significance test; LR Test: maximum likelihood test (multilevel regression versus non-pooled regression); ***, ** and * indicate significance of 1%, 5% and 10%, respectively; Estimation method: Maximum Likelihood (ML). Random intercept model.
Lev_ST: CL/Asset Lev_LT: NCL/Asset
Firm Variables Firm and Macroeconomic variables Firm and Institutional Variables Firm Variables Firm and Macroeconomic variables Firm and Institutional Variables
Fixed Effects Coef. Coef. Coef. Coef. Coef. Coef.
Intercept 0,172 *** 295,207 ** 1,094 *** 0,055 348,509 ** 0,676 *
Year 0,003 *** 0,003 *** 0,003 *** 0,008 *** 0,008 *** 0,008 ***
Size 0,007 ** 0,007 ** 0,007 ** 0,015 *** 0,015 *** 0,015 ***
Tang -0,021 -0,024 -0,024 0,018 0,017 0,017
Prof -0,082 -0,083 -0,083 -0,137 * -0,126 * -0,126 *
Risk 0,280 *** 0,284 *** 0,284 *** -0,085 -0,079 -0,079
Liq -0,016 *** -0,016 *** -0,016 *** -0,009 *** -0,009 *** -0,009 ***
Gr_Opp 0,003 * 0,003 * 0,003 * 0,002 0,002 0,002
MB 0,006 0,006 0,006 -0,016 ** -0,017 ** -0,017 **
Growt_GDP -631,435 ** -748,396 **
Income -33,477 ** -39,528 **
Infl 203,142 ** 238,634 **
Part_Comp 34,222 ** 40,451 **
T_Buss 0,860 ** 1,038 **
Prop_Rig 0,136 0,313 ***
Legal_Risk -0,320 ** -0,424 ***
Min_Prot -0,186 * -0,192 *
Cred_Prot -0,022 *** -0,020 ***
Corrup_Eth 0,176 *** 0,166 **
Random Effect Parameters
Estimate ICC Estimate ICC Estimate ICC Estimate ICC Estimate ICC Estimate ICC
Country 0,003 13,34% 0,000 0,00% 0,000 0,00% 0,002 8,00% 0,000 0,00% 0,000 0,00%
Firm 0,015 61,37% 0,014 70,59% 0,014 70,59% 0,016 68,66% 0,016 74,41% 0,016 74,41%
Time 0,006 25,29% 0,006 29,41% 0,006 29,41% 0,006 23,34% 0,006 25,59% 0,006 25,59%
Total 0,024 100,00% 0,020 100,00% 0,020 100,00% 0,024 100,00% 0,022 100,00% 0,022 100,00%
Verification Tests
Wald's Test 3115,695 *** 3127,392 *** 3127,392 *** 3197,257 *** 3207,377 *** 3207,377 ***
LR Test (chi2) 2838,450 *** 2560,240 *** 2560,240 *** 3135,670 *** 2907,580 *** 2907,580 ***