ARTICLE
Aneuploidy is associated with different human diseases including cancer. However, different cell types appear to respond
differently to aneuploidy, either by promoting tumorigenesis or causing cell death. We set out to study the behavior of adult
Drosophila melanogaster intestinal stem cells (ISCs) after induction of chromosome missegregation either by abrogation of
the spindle assembly checkpoint or through kinetochore disruption or centrosome amplification. These conditions induce
moderate levels of aneuploidy in ISCs, and we find no evidence of apoptosis. Instead, we observe a significant accumulation
of ISCs associated with increased stem cell proliferation and an excess of enteroendocrine cells. Moreover, aneuploidy
causes up-regulation of the JNK pathway throughout the posterior midgut, and specific inhibition of JNK signaling in ISCs is
sufficient to prevent dysplasia. Our findings highlight the importance of understanding the behavior of different stem cell
populations to aneuploidy and how these can act as reservoirs for genomic alterations that can lead to tissue pathologies.
Aneuploidy in intestinal stem cells promotes gut
dysplasia in Drosophila
Luís Pedro Resende1,2, Augusta Monteiro1,2, Rita Brás1,2, Tatiana Lopes1,2, and Claudio E. Sunkel1,2,3
Introduction
Aneuploidy is characterized by the presence of an abnormal number of chromosomes in a cell and is a hallmark of different human diseases. It is one of the major causes of spontaneous miscarriages, a hallmark of cancer, and it has been linked to neurodegeneration and aging (Holland and Cleveland, 2012; Ricke and van Deursen, 2013). Aneuploidy is present in >90% of human tumors, but several studies report a detrimental effect of aneuploidy on cells leading to cell death or cell cycle arrest. Addi-tionally, recent studies also indicate that the cellular response to aneuploidy is not uniform among different tissues (Sheltzer and Amon, 2011; Knouse et al., 2017). Tissue stem cells are responsi-ble for the constant renewal of tissues, and their behavior must be tightly regulated to prevent diseases. Contrasting with other proliferative nonstem cells (Dekanty et al., 2012; Morais da Silva et al., 2013), adult stem cells have been proposed to tolerate an-euploidy and not activate apoptosis in response to genomic insta-bility (Mantel et al., 2007; Harper et al., 2010). This tolerance to aneuploidy underscores the need to understand how aneuploidy impacts adult stem cell behavior and how this consequently af-fects tissue homeostasis.
The Drosophila melanogaster intestine is a powerful model system to study adult stem behavior in vivo, where markers are available for all cell types that compose the intestinal epithelium (Fig. 1 A) and a diversity of genetic tools can be used to manip-ulate gene expression in a cell-type and temporally controlled
manner (Jiang and Edgar, 2012). In the Drosophila posterior midgut, multipotent intestinal stem cells (ISCs) and entero-blasts (EBs) constitute the main progenitor cell populations of this tissue. Differentiated cell types in the adult midgut include secretory enteroendocrine (EE) cells and absorptive polyploid enterocytes (ECs; Micchelli and Perrimon, 2006; Ohlstein and Spradling, 2006). ISCs have the potential to divide symmetrically or asymmetrically with regard to cell fate (O’Brien et al., 2011; de Navascués et al., 2012; Goulas et al., 2012). When dividing asym-metrically, they can give rise to either an EB or an EE. Bidirec-tional Notch signaling, genes of the achaete–scute complex, the transcription factor Prospero (Pros), and Tramtrack69 have been implicated in the regulation of EE fate (Amcheslavsky et al., 2014; Guo and Ohlstein, 2015; Wang et al., 2015; Zeng and Hou, 2015; Yin and Xi, 2018). ECs are generated through differentiation of EBs (Zeng and Hou, 2015).
Genomic stability through cell division is maintained by the spindle assembly checkpoint (SAC), a surveillance mecha-nism that prevents or delays mitotic exit in response to abnor-mal interaction between chromosomes and the mitotic spindle (Musacchio and Salmon, 2007). In this study, we show that ab-rogation of the SAC or impairment of mitotic structures such as kinetochores or centrosomes in ISCs results in moderate levels of aneuploidy without showing any evidence of cell death. In-stead, we observe accumulation of ISCs, with an increased rate
© 2018 Resende et al. This article is distributed under the terms of an Attribution–Noncommercial–Share Alike–No Mirror Sites license for the first six months after the publication date (see http:// www .rupress .org/ terms/ ). After six months it is available under a Creative Commons License (Attribution–Noncommercial–Share Alike 4.0 International license, as described at https:// creativecommons .org/ licenses/ by -nc -sa/ 4 .0/ ).
1Instituto de Investigação e Inovação em Saúde, Universidade do Porto, Porto, Portugal; 2Instituto de Biologia Molecular e Celular, Universidade do Porto, Porto,
Portugal; 3Instituto de Ciências Biomédicas de Abel Salazar, Universidade do Porto, Porto, Portugal.
Correspondence to Claudio E. Sunkel: cesunkel@ ibmc .up .pt; Luís Pedro Resende: luis.resende@ ibmc .up .pt.
of stem cell proliferation and an excess of cells of the EE lineage. This is accompanied by a general activation of the JNK pathway throughout the tissue. Moreover, specific inhibition of JNK sig-naling by expression of a Basket dominant-negative form in progenitor cells prevents the accumulation of these cells. Our findings describe an in vivo model where failure to maintain a correct genomic content can lead to stem cell misbehavior and the development of tissue pathology.
Results
Drosophila ISCs are SAC competent
To determine whether SAC impairment could be used as a strategy to induce aneuploidy in ISCs, we first examined SAC activity in these cells. SAC-competent cells arrest in prometa-phase in response to microtubule depolymerization (Zhou and Giannakakou, 2005). Previous work showed that proliferative cells within the intestine arrest in mitosis when flies are fed with drugs such as colchicine or colcemid (Guo et al., 2013; Markstein et al., 2014). We confirmed these results, showing that colchi-cine feeding results in a significant increase in the number of pH3-positive cells (Fig. 1, B and C; and Table 1). During an un-perturbed mitosis, SAC proteins accumulate at kinetochores only at prometaphase, but in a SAC-arrested mitosis, these proteins remain at kinetochores until the SAC is satisfied. Accordingly, we observed kinetochore accumulation of SAC proteins such as Mad2 and BubR1 after microtubule depolymerization (Fig. 1, D–F). To further validate the SAC response in ISCs, we tested whether SAC genes were essential for this prometaphase arrest. Unlike in mammals where Mad2 mutants are lethal in homozy-gosity (Dobles et al., 2000), Drosophila homozygous mutants for mad2Δ are viable and fertile (Buffin et al., 2007). We also
re-cently characterized a semiviable mps1 mutant allele (aldG4422;
Conde et al., 2013; Moura et al., 2017) that allows survival of a small percentage of homozygous flies until adult stages. Both of these SAC mutations rendered the checkpoint defective and showed high rates of aneuploidy in their neuroblast population. We found that mutations in either mad2 or mps1 significantly reduced the accumulation of pH3-positive cells in the intestine, indicating that the SAC was impaired (Fig. 1, G–J; and Table 1). Furthermore, we also observed that overexpression of the SAC gene mps1 specifically in ISCs/EBs caused mitotic arrest, consis-tent with its role in an active checkpoint response in these cells (Fig. S1, A–C). The experiments described above were performed using mad2 or mps1 mutant flies, and therefore, it is possible that
the response of intestinal cells we observed was due to earlier developmental defects. To directly characterize the impact of loss of SAC proteins in ISCs/EBs of adult flies, we used the esgGAL4 driver to express UAS-RNAi constructs targeting RNA from mad2 or mps1 genes. To avoid developmental defects, a GAL80ts
(temperature-sensitive repressor of the GAL4-UAS system) was used, and crosses were maintained at 18°C to suppress the GAL4-UAS system during development. Adult flies were shifted to 29°C after eclosion to activate the GAL4-UAS system and were fed col-chicine as described before, and then the total number of mitotic cells was determined (Fig. 1, K–P). Expression of mad2RNAi or mps1RNAi specifically in ISCs/EBs reduced the progressive mi-totic arrest in response to colchicine treatment observed in con-trols (Fig. 1 Q), suggesting that depletion of checkpoint proteins specifically in adult intestinal progenitor cells also leads to an impairment of SAC activity.
Impairment of SAC activity in ISCs causes aneuploidy
In different model organisms and cell types, a defective SAC has consistently been associated with abnormal chromosome segre-gation and aneuploidy induction (Musacchio and Salmon, 2007). Thus, we evaluated whether impairment of the SAC also leads to aneuploidy in intestinal progenitor cells. The first indication that aneuploidy was being generated was the observation of ab-normal mitotic figures associated with chromosome missegrega-tion such as lagging chromosomes or chromatin bridges in flies where Mad2 or Mps1 were depleted in ISCs/EBs (Fig. 2, A–C). To confirm whether these defects indeed resulted in aneuploidy, we performed FACS analysis in sorted ISCs/EBs from control and SAC-impaired conditions. FACS analysis has been used suc-cessfully to detect increases in specific types of aneuploidy in other Drosophila tissues following similar strategies (Dekanty et al., 2012; Morais da Silva et al., 2013; Clemente-Ruiz et al., 2014; Tauc et al., 2014). As expected, ISCs/EBs (GFP positive; la-beled by esgGAL4,UAS GFP) from mad2RNAi or mps1RNAi flies showed higher rates of aneuploidy than controls (Fig. 2, D–F). This method gave a rather conservative quantification of aneu-ploidy and missed any classes with less than the equivalent of the G2 DNA content. Given this limitation, we used alternative methods to detect aneuploidy. FISH analysis allows the identi-fication of extra chromosomes within cells. However, high lev-els of chromosome pairing can be present in Drosophila (Bosco, 2012); therefore, an unambiguous classification of cells as an-euploid with this method was restricted to cells with more than two copies of the chromosome labeled by FISH. Using probes for Figure 1. ISCs are SAC competent. (A) Anatomical organization of the Drosophila intestine and schematic representation of different cell types of the pos-terior midgut. ISCs/EBs are the progenitor cells and are found in close association with basement membrane (BM) and visceral muscle (VM). Differentiated cell types include EE cells and absorptive ECs. (B) Mitotic cells labeled with pH3 (B′) in WT 2–5-d-old OreR fed with 5% sucrose control solution during 24 h (white circle and yellow arrow show pH3-positive cell; inset B1). (C) Same as B, but flies were fed with 5% sucrose and 0.2 mg/ml colchicine. Note the increase in pH3-positive cells (compare C′ with B′). (D) Kinetochore marker Spc105 is detected in SAC-arrested ISCs (pH3 positive; yellow arrows). (E and F) mad2 or bubR1 reporter lines show GFP signal in SAC-arrested cells (yellow arrows). (G–J) 2–5-d-old mad2 or mps1 mutants flies fed with the same feeding method as described for WT flies in B and C. (K–P) Mitotic cells labeled with pH3 in intestines from control and flies where indicated RNAi was expressed. Flies were kept at 18°C during development to suppress the GAL4-UAS system and then were shifted to 29°C at eclosion day. After 48 h at 29°C on regular food, flies were shifted to vials with either sucrose or sucrose + colchicine solutions for 24 h. White circles and yellow arrows show pH3-positive cells. Bars: 40 µm (B, C, and G–P); 20 µm (B1 and G1); 10 µm (D–F). (Q) Number of mitotic cells present in first two fields of view of the posterior midgut after the pyloric ring (40× objective) in control, mad2RNAi, and mps1RNAi. Sucrose or colchicine feeding was initiated after flies spent 2 d at 29°C (0 h time point). n > 16 for all genotypes/ conditions. ND, not determined; ****, P < 0.0001; Mann–Whitney U test.
Chromosomes X and III, we detected a higher percentage of aneu-ploid cells in flies expressing RNAi against either Mad2 or Mps1 when compared with controls (Fig. 2, G–M). Since both FISH and FACS only unambiguously allow for the detection of aneuploidy involving chromosome gain, we investigated whether chromo-some loss might also occur after SAC impairment in ISCs/EBs. To do so, we resorted to an antibody that specifically recognizes the fourth chromosome (Larsson et al., 2001). We observed that after depletion of Mad2 or Mps1, cells showed high frequency of loss of Chromosome VI (Fig. 2, N–Q). Taken together, these results demonstrate that SAC impairment in intestinal progenitor cells results in induction of aneuploidy in these cells.
SAC impairment results in intestinal dysplasia
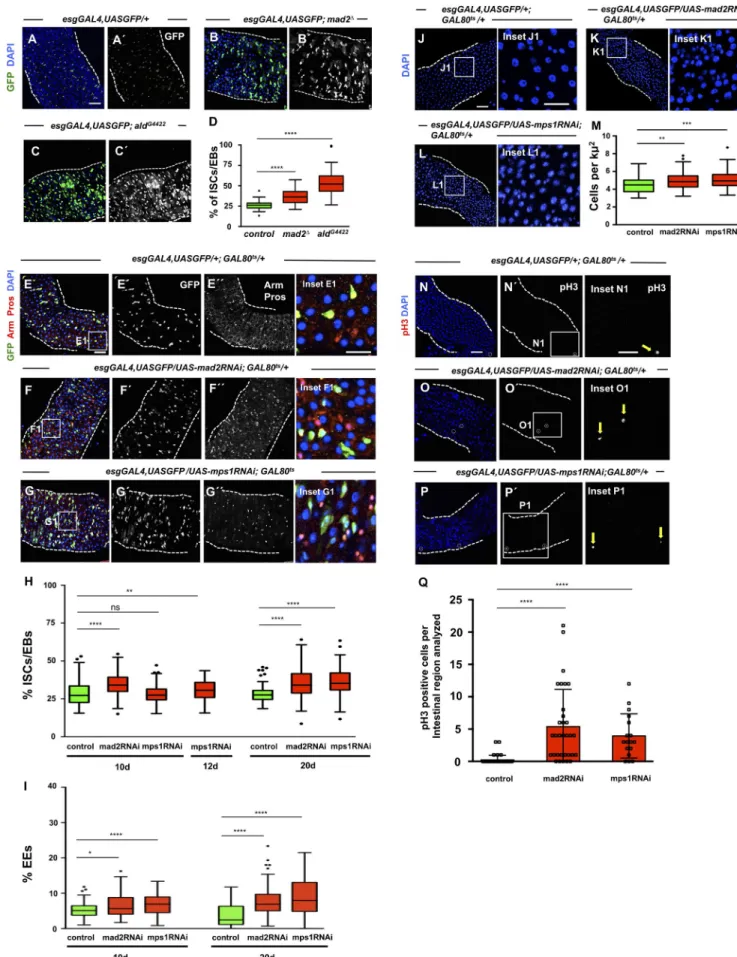
To determine how aneuploidy impacts on ISCs, we generated flies carrying mad2 or mps1 mutations and the esgGAL4,UAS GFP construct to label ISCs/EBs. We observed a significantly higher number of ISCs/EBs in mutant flies when compared with con-trols (Fig. 3, A–D). To further investigate this phenotype, we im-paired the SAC specifically in the ISCs/EBs and only in the adult as described previously for mad2RNAi and mps1RNAi flies, and we determined the percentage of different cell types (Fig. 3, E–G). Similarly to Mad2 or Mps1 mutants, we found that depletion of either Mad2 or Mps1 in ISCs/EBs leads to a significantly higher percentage of these cells with respect to controls after different times of RNAi expression (Fig. 3, E–H). In addition, a significant accumulation of cells of the EE lineage was also observed (Fig. 3, E–G and I). In agreement with these observations, intestines from flies expressing mad2RNAi or mps1RNAi showed a higher cell density when compared with controls (Fig. 3, J–M), and the number of cells undergoing mitotic divisions was strongly up-regulated (Fig. 3, N–Q).
These observations are in sharp contrast with previous re-sults, where it was reported that expression of an RNAi against the SAC gene bub3 in ISCs/EBs leads to their loss through prema-ture differentiation (Gogendeau et al., 2015). We used two inde-pendent RNAi lines and confirmed that depletion of Bub3 indeed leads to a severe reduction in the number of ISCs/EBs (Fig. S2, A–C and E). To determine whether this was also the case when other proteins of the SAC are depleted, we proceeded to quantify the number of ISCs/EBs after knockdown of BubR1. We find that similar to mad2 or mps1 knockdown, expression of bubR1RNAi also leads to higher number of ISCs/EBs and EEs (Fig. S2, A and D–F). Knockdown of bub3 or bubR1 both lead to a defective SAC
response (Fig. S2, G–K). Taken together, these results indicate that bub3RNAi behaves as an exception and that aneuploidy induction via loss of function of most SAC genes promotes testinal dysplasia, characterized by an accumulation of ISCs, in-creased tissue proliferation levels, and high number of EEs.
Aneuploidy promotes intestinal dysplasia
After concluding that aneuploidy induction via impairment of SAC genes results in dysplasia, we set out to address whether this phenotype was aneuploidy driven or caused by any other effect intrinsic to SAC impairment. The orientation of cell division of the ISCs has been suggested to be genetically regulated, and con-flicting evidence exists as to whether this dictates the symmetry versus asymmetry of stem cell division with regard to cell fate (Lin et al., 2013; Chen et al., 2018). Previously referred accumula-tion ISCs/EBs and EEs in Notch loss-of-funcaccumula-tion phenotypes have been proposed to be mediated by alterations in the orientation of the stem cell division (Guo and Ohlstein, 2015). Therefore, we investigated whether the angle of cell division of ISCs after mad2RNAi or mps1RNAi was affected (Fig. S3, A–G). After 3D reconstruction of dividing ISCs, no significant differences were found in the angle of division after mad2 or mps1 knockdown when compared with controls (Fig. S3, E–G and I). Thus, alter-ations in cell division angle can be excluded as the cause for the dysplasia observed after SAC impairment.
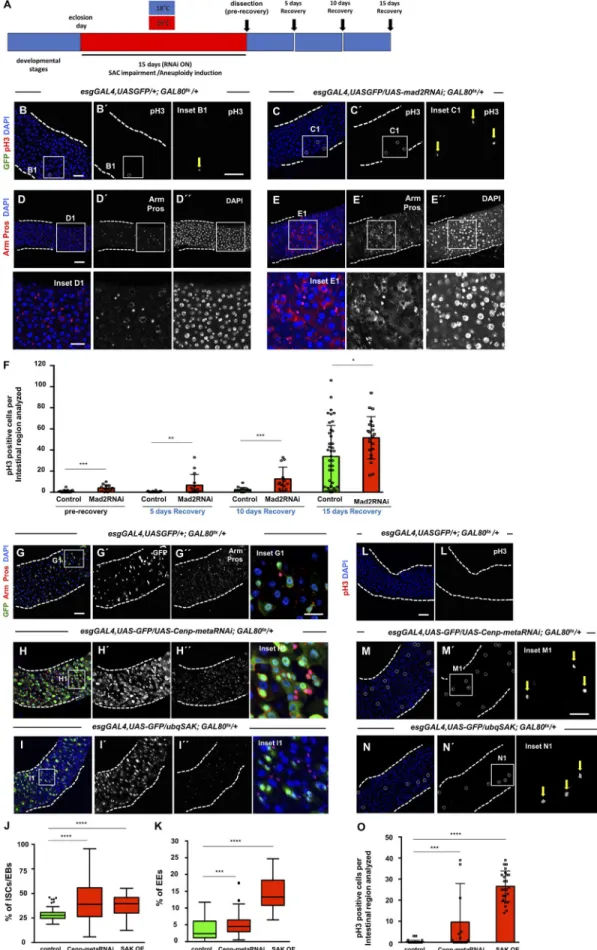
Drosophila ISCs are known to be highly dynamic in their ca-pacity to modulate their division rate according to current tis-sue needs (Biteau et al., 2011). Transient increase in stem cell activity is regulated to increase the generation of differentiated cells when necessary, and basal ISC proliferation rate is restored once the stimulus is abrogated. Based on this, and in order to de-termine whether the intestinal dysplasia observed is a result of aneuploidy itself and not an indirect consequence of SAC impair-ment, we tested whether the high proliferative rate of ISCs would be maintained if SAC function was restored after aneuploidy was induced. We induced aneuploidy by expressing mad2RNAi in ISCs/EBs during the first 15 d of the adult fly, and then we shifted these flies to 18°C (GAL8Ots ON/GAL4-UAS system OFF) during 5,
10, or 15 d (Fig. 4 A). During the first 5 d of recovery at 18°C, the GAL4-UAS system was efficiently turned off, and consequently, SAC function was restored in mad2RNAi flies (Fig. S4, A–E). We observed that the proliferation rate of ICSs was always higher than controls at all recovery time points and that mad2RNAi re-mained dysplastic, suggesting that the observed phenotype is Table 1. Quantification of mitotic cells after colchicine treatment
WT mad2Δ aldG4422
pH3-positive cells per intestinal region Sucrose 0.29 ± 0.85 3.11 ± 3.90 5.73 ± 4.82
Colchicine 34.81 ± 30.46**** 12.62 ± 12.60 34.27 ± 19.74
Mitotic index fold change (sucrose vs. colchicine) ×120 ×4 ×6
Quantification of pH3-positive cells present in the first two fields of view of the posterior midgut after the pyloric ring (40× objective) of WT and homozygous mutants for mad2 or mps1. n (intestines) = 24 for WT on sucrose; n (intestines) = 47 for WT on sucrose + colchicine; n (intestines) = 22 for mad2 mutants on sucrose; n (intestines) = 29 for mad2 mutants on sucrose + colchicine; n (intestines) = 11 for mps1 mutants on sucrose; n (intestines) = 11 for mps1 mutants on sucrose + colchicine. ****, P < 0.0001; Mann–Whitney U test.
Figure 2. Induction of aneuploidy in intestinal cells after SAC impairment. (A) Control cell in anaphase. (B and C) Lagging chromosomes/chromatin bridges (white arrows) in dividing cells from 10-d-old mad2RNAi and mps1RNAi flies. (D–F) Examples of FACS profiles of ISCs/EBs from control, mad2RNAi, and mps1RNAi flies. For control versus mad2RNAi, two biological replicates were performed. In both, the percent aneuploidy was higher in the mad2RNAi flies (P < 0.01; Fisher exact t test). For control versus mps1RNAi flies, two biological replicates were performed. In both, the percent aneuploidy was higher in the mps1RNAi (P < 0.01; Fisher exact t test). Average percent aneuploidy ± SD: control, 2.4 ± 0.5; mad2RNAi, 5.4 ± 0.73; mps1RNAi, 7.77 ± 1.1. (G–L) FISH analysis in combination with IF labeling Chromosomes X or III within ISCs/EBs (GFP+/esg+; white circles). Due to somatic chromosome pairing, cells were only scored as
aneuploid when more than two FISH signals were observed. (M) Quantification of ISCs/EBs where more than two FISH signals for Chromosome X or III were detected within control, mad2RNAi, and mps1RNAi intestines. n (ISCs/EBs) for controls = 1,161 (Ch III) and 541 (Ch X); n (ISCs/EBs) for mad2RNAi = 841 (Ch III) and 751 (Ch X); n (ISCs/EBs) for mps1RNAi = 936 (Ch III) and 720 (Ch X). (N–P) 15–20-d control, mad2RNAi, and mps1RNAi intestines stained for anti-POF antibody to label the fourth chromosome. Bars, 5 µm. (Q) Percentage of ISCs/EBs where no signal for anti-POF was observed in N–P. N refers to number the ISCs/EBs analyzed in each genotype. ***, P < 0.001; ****, P < 0.0001; Fisher's exact t test.
Figure 3. SAC inactivation results in intestinal dysplasia. (A) 2–5-d-old control intestine where ISCs/EBs can be visualized by GFP expression under the control of esgGAL4. DAPI marks cell nuclei. (B and C) 2–5-d-old intestines of homozygous mutants for SAC genes mad2 or mps1. Note accumulation of ISCs/ EBs (compare B′ or C′ with A′). (D) Quantification of percent ISCs/EBs (GFP positive) per total cell number in A–C. Tukey boxplots. (E) 20-d-old control intestine
driven by aneuploidy and not by SAC impairment per se (Fig. 4, B–F). Between days 10 and 15 of the recovery period, both con-trols and mad2RNAi ISCs increased their mitotic rate signifi-cantly (Fig. 4 F). This is expected as increased ISC proliferation is a known phenotype associated with aging in the Drosophila midgut (Biteau et al., 2008; Choi et al., 2008; Park et al., 2009). In addition to maintaining a high proliferation rate, dysplasia was also maintained during this period as evaluated based on DAPI or Armadillo (Arm)/Pros staining.
To determine whether dysplasia could be observed by induc-ing aneuploidy through impairment of mitosis via other mecha-nisms alternative to SAC, we disrupted kinetochore function or induced centrosome amplification. Successful induction of an-euploidy in Drosophila and mammalian cells has been previously achieved by knockdown of the centromeric-associated protein meta (Cenp-meta; Cenp-E in mice), a kinesin-like motor protein required for efficient end-on attachment of kinetochores to the spindle microtubules (Yucel et al., 2000). We depleted Cenp-meta by expressing an RNAi construct in ISCs/EBs using the esgGAL4 driver as described previously and also observed an accumula-tion of ISCs/EBs and cells of the EE lineage, a phenotype in all re-spects identical to the one observed after loss of SAC genes (Fig. 4, G, H, J, and K). To analyze this further, we induced alterations in cell division of intestine progenitor cells through centrosome amplification since this has been associated with aneuploidy and tumor development in both Drosophila and humans (Gönczy, 2015; Marteil et al., 2018). Furthermore, centrosome amplifica-tion has also been shown to promote characteristics associated with transformed cells like invasiveness behavior (Godinho et al., 2014). In Drosophila, overexpression of the SAK leads to centro-some amplification, mitotic disruption, and aneuploidy (Basto et al., 2008). Constitutive overexpression of SAK using a ubiquitin promoter resulted in a strong accumulation of ISCs/EBs and EEs, similar to what was observed for loss of SAC genes or cenp-meta knockdown (Fig. 4, I–K). To validate that aneuploidy was being induced after cenp-meta knockdown or SAK overexpression, we performed staining for the fourth chromosome as previously de-scribed for mad2RNAi and mps1RNAi conditions. As expected, the percentage of aneuploid cells detected with this method was higher in both cenp-meta–knockdown and SAK-overexpression conditions (Fig. S5, A–D). In addition, and similar to what was observed when aneuploidy was induced via SAC impairment, we could also detect higher proliferation levels and specific ISC accumulation after either cenp-meta knockdown or SAK
overex-pression (Fig. 4, L–O; and Fig. S5, E–H). Alterations in the angle of stem cell division were not detected upon SAK overexpression (Fig. S3, H and I). Thus, as previously addressed for SAC-impair-ment conditions, the orientation of stem cell division does not seem to be the cause for the observed phenotype. Therefore, we conclude that the dysplastic phenotype we observed in the mid-gut can be caused by impairment of different biological mecha-nisms/structures that result in the induction of aneuploidy.
Aneuploidy causes accumulation of overproliferative ISCs
Thus far, we have shown that aneuploidy induction in ISCs and EBs leads to aneuploidy, and this results in an accumulation of these progenitor cell types, higher tissue proliferation levels, and a higher number of EEs. Since the esgGAL4 driver is expressed in both ISCs and EBs, we determined the specific contribution of ISCs to this phenotype. For this, we used esgGAL4,UAS GFP that marks ISCs/EBs with the EB-specific reporter Su(H)GBE-LacZ (Zeng et al., 2010). Quantification of the two different cells types after expression of mad2RNAi or mps1RNAi showed that a specific increase of ISCs occurs (Fig. 5, A–E). To further validate these results, we performed an experiment in which only ISCs would express the RNAi constructs and a GFP reporter construct (Fig. 5, F–I). This was achieved by using a fly carrying an esgGAL4 driver expressed in both ISCs and EBs combined with a GAL8Ots
and, additionally, a Su(H)GBE-GAL80 that is not temperature sensitive, expressed only in EBs. Flies were kept at 18°C during development and were shifted to 29°C to activate the expres-sion of RNAi only in ISCs. Consistent with the results described above, we find a significant accumulation of ISCs. Therefore, we can conclude that the dysplasia we observed after induction of aneuploidy results in ISC accumulation.
A similar phenotype with an accumulation of ISCs/EBs and EEs has been described previously in other dysplastic conditions like Notch loss-of-function conditions. Mixed lineages were re-ported in Notch mutants, particularly the presence of cells coex-pressing the ISC/EB marker Escargot (Esg) and the EE marker Pros (Patel et al., 2015). To better characterize the accumulation of ISCs/EBs and EEs observed after SAC impairment, we evalu-ated whether Esg-positive/Pros-positive cells could be found in mad2RNAi and Mps1 flies. Although we could find Esg-positive cells expressing the EE marker Pros in dysplastic mad2RNAi and mps1RNAi intestines, the percentage of these cells was very low (1.65% in mad2RNAi and 1.36% in mps1RNAi). This contrasted with Notch loss-of-function dysplastic intestines, used in this where ISCs and EBs are marked based on esg expression (green). EEs can be identified by expression of Pros (nuclear red signal). Arm marks all cell membranes. DAPI marks cell nuclei. (F and G) Intestines where RNAi constructs against SAC genes mad2 or mps1 were expressed under the control of the esgGAL4 pro-moter during the first 20 d of the adult fly. Note accumulation of ISCs/EBs (compare F′ and G′ with E′ or green cells in the corresponding insets); note also the excess of EEs (compare F′′ and G′′ with E′′ or red nuclear signaling in corresponding insets). (H and I) Quantification of percentage of ISCs/EBs (GFP positive) or EEs (Pros positive) per total cell number in control, mad2RNAi, and mps1RNAi flies at different time points. Tukey boxplots; n = 28 (intestines) for controls at 10 d; n = 22 for mad2RNAi at 10 d; n = 25 for mps1RNAi at 10 d; n = 22 for mps1RNAi at 12 d; n = 21 (intestines) for controls at 20 d; n = 26 for mad2RNAi at 20 d; n = 21 for mps1RNAi at 20 d. (J) 20-d-old control intestine. Cell nuclei are marked by DAPI. (K and L) 20-d-old mad2RNAi and mps1RNAi intestines. Note high cell density (compare K1 or L1 with J1). In control and RNAi conditions, suppression of the GAL4-UAS system was performed during development by using the temperature-sensitive repressor GAL80ts and by raising the flies at 18°C. (M) Quantification of cell densities in J–L. n (intestines) = 20 for controls;
n (intestines) = 20 for mad2RNAi; n (intestines) = 18 for mps1RNAi. (N–P) Same genotypes/time points as in E–G or J–L but stained for pH3 to label mitotic cells (white circles or yellow arrows). Bars: 40 µm (main images); 20 µm (insets). (Q) Number of mitotic cells present in the first two fields of view of the posterior midgut after the pyloric ring (40× objective) from situations N–P. *, P < 0.05; **, P < 0.01; ****, P < 0.0001; Mann–Whitney U test. n = 39 flies for controls; n = 32 flies for mad2RNAi; n = 17 flies for mps1RNAi.
Figure 4. Aneuploidy promotes dysplasia. (A) Scheme illustrating temperature shifts performed in control and mad2RNAi flies. (B) Example of a 20-d-old control intestine subjected to temperature shifts as described in A (5 d recovery). In the majority of intestines, no GFP-positive cells could be detected (GAL4-UAS OFF). Only in a very small percentage of intestines could a couple of GFP-positive cells sometimes be detected (yellow arrow; inset B1). Cells undergoing
study as positive controls for conditions where the occurrence of these mixed lineages have been reported (Fig. 6, A–D and K). Although Esg-positive/Pros-positive cells are common in Notch loss-of-function conditions, they have been proposed to not be mitotically active and not play an important role the development of dysplasia (Patel et al., 2015). Likewise, we found that mitotically active cells of our aneuploidy dysplastic conditions are Pros neg-ative (Fig. 6, D–G and L), indicating that overproliferative cells in mad2RNAi and mps1RNAi intestines should be ISCs (Fig. S3, F–I). We also found that mitotically active cells are also negative for the EB marker Su(H)GBE-LacZ, providing additional supporting evidence that overproliferative cells are ISCs (Fig. 6, H–J and M).
Induction of aneuploidy is not associated with apoptosis of intestinal cells
In the posterior midgut, ISCs have been shown to be highly sensi-tive to signals secreted by neighboring cells undergoing cell death or damage, resulting in an increased proliferation rate as part of a dynamic regenerative process (Biteau et al., 2011). There-fore, we addressed the possibility that induction of aneuploidy in ISCs could result in the activation of apoptosis either in pro-genitor or differentiated cells, which subsequently could result in the activation of a regenerative response of the tissue. However, we found no evidence for pyknotic nuclei after aneuploidy in-duction, and in contrast with treatment with bleomycin, a drug known to induce apoptosis in ECs (Amcheslavsky et al., 2009; Tauc et al., 2017), the majority of control or mad2RNAi intestines had no cells positive for cleaved caspase-3 (Fig. 7, A–C). To better address a putative role for apoptosis in the dysplastic phenotype, we impaired the apoptotic response in ISCs/EBs by expressing the baculovirus protein P35 (Hay et al., 1994) under a UAS pro-moter. Coexpression of P35 together with mad2RNAi or mps1R-NAi did not have a significant effect on the dysplastic phenotype previously observed (Fig. 7, D–F, I, and J). To investigate a puta-tive contribution of death of differentiated cells to the dysplastic phenotype, we also impaired apoptosis in all intestinal cell types. This was achieved by inducing aneuploidy in flies heterozygous for chromosomal deletion Df(3L)H99 that lacks reaper, head in-volution defective, and grim, three apoptotic inducers. Hetero-zygous flies for this deletion have been shown to have severely compromised apoptotic response (White et al., 1994). The results were essentially the same as when P35 was coexpressed to block apoptosis, and this did not prevent the accumulation of ISCs/EBs and EEs (Fig. 7, D and G–J). These results indicate that although blocking apoptosis can lead to minor effects in the severity of
phenotypes observed, it clearly does not prevent the dysplastic phenotype. Taken together with the failure to detect apoptotic cells, these results strongly suggest that the dysplastic phenotype does not result from aneuploidy-driven cell death of either pro-genitor or differentiated cell types of the intestine.
Autonomous activation of JNK in ISCs/EBs modulates their response to aneuploidy induction
Epithelial damage or stress has been shown to cause JNK activa-tion in the Drosophila intestine (Biteau et al., 2008; Buchon et al., 2009; Jiang et al., 2009), a pathway that has also been shown to mediate the development of a tumorigenic phenotype after aneuploidy induction in Drosophila imaginal discs (Dekanty et al., 2012). Based on this, JNK represented a strong candidate to be implicated in the development of intestinal dysplasia after aneuploidy induction. To determine the level of JNK activation, we used the reporter line puckered-LacZ (Martín-Blanco et al., 1998). In control intestines, we observed a very low signal in very few cells per intestine (Fig. 8, A and B), in sharp contrast with intestines where aneuploidy was induced, where the majority of cells across the entire intestinal section showed strong activation of JNK in both progenitor and differentiated cells (Fig. 8, C–F). Expression of a dominant-negative form of the protein Basket (BskDN) within ISCs/EBs has been shown to be sufficient to
pre-vent JNK activation in these cells and rescue dysplastic pheno-types associated with cellular stress (Biteau et al., 2008; Buchon et al., 2009). Importantly, expression of BskDN per se does not
im-pact epithelia homeostasis or stem cell behavior. To test whether JNK autonomous inactivation within ISCs/EBs could rescue the dysplastic phenotype, BskDN was coexpressed together with
mad2RNAi (Fig. 8 G). Although at 10 d, down-regulation of JNK in ISCs/EBs leads to a partial rescue, at 20 d, we could observe a full rescue so that the percentage of ISC/EBs is not different from controls (Fig. 8, G and H). This suggests that JNK up-regulation within ISCs/EBs is required for the development of intestinal dysplasia after aneuploidy induction. Interestingly, high levels of accumulation of EEs were still observed even after 10 or 20 d expression of BskDN (Fig. 8, G and H). Further studies should
address which biological pathways drive the accumulation of EEs independent of the JNK after aneuploidy induction.
Discussion
We propose in this study a new model for the impact of aneuploidy in Drosophila ISCs. Contrary to published results (Gogendeau et
proliferation were labeled with pH3 (white circle; inset B1), and cell nuclei with DAPI. (C) Example of a mad2RNAi intestine after 5 d recovery as described in A. (D and E) Intestines from control and mad2RNAi after 10 d recovery. (F) Quantification of mitotic cells before and during recovery. (G) 20-d-old control intestine where ISCs and EBs are marked based on esg expression (green). EEs can be identified by expression of Pros (nuclear red). Arm marks cells membrane, and DAPI marks cell nuclei. (H) Example of an intestine where RNAi construct against cenp-meta was expressed under the control of the esgGAL4 driver during the first 20 d of the adult. (I) Example of a 20-d-old intestine where the protein SAK was constitutively overexpressed (OE). (J and K) Quantification of the percentage of ISCs/EBs (GFP positive) per total cell number or EEs (Pros positive) in situations G–I. Control data are the same as shown in Fig. 3. Tukey box-plots. n (intestines) = 21 flies for control; n (intestines) = 32 flies for cenp-metaRNAi; n (intestines) = 8 for SAK overexpression. (L–N) Same genetic conditions and time point as described for G–I but stained for pH3. Bars: 40 µm (main images); 20 µm (insets). White circles and yellow arrows show pH3-positive cells. (O) Number of mitotic cells present in the first two fields of view of the posterior midgut after the pyloric ring (40× objective) from L–N. Mean ± SD. *, P < 0.05; **, P < 0.01; ***, P < 0.0001; ****, P < 0.0001; Mann–Whitney U test. n (intestines) = 39 flies for control (control data are the same as in Fig. 3); n (intestines) = 18 flies for cenp-metaRNAi; n (intestines) = 24 for SAK overexpression.
al., 2015), where it was proposed that aneuploidy leads to pre-mature differentiation and consequent loss of Drosophila adult stem cells, we showed that aneuploidy induction in ISCs leads to intestinal dysplasia characterized by an accumulation of ISCs and EEs and high proliferation rates of ISCs. While the previous study addressing the impact of aneuploidy in ISCs was based on a single genetic condition (loss of function of the SAC gene bub3 through RNAi), we observed in this study a different phenotype when we impaired the SAC through loss of function of other SAC genes, namely five different genetic conditions (mad2 and mps1 mutants as well as Mad2, Mps1, and BubR1 RNAi-mediated knockdown). Furthermore, we showed that once aneuploidy is induced, the hyperproliferative status of ISCs is maintained over long periods even if the SAC function is restored. This suggests that once aneuploid genotypes are present, they can by them-selves promote an abnormal stem cell behavior. Moreover, the same dysplastic phenotype was observed when aneuploidy was induced independently of SAC activity, namely through impair-ment of kinetochore function or by centrosome amplification.
Therefore, our results suggest that aneuploidy induction in ISCs results in intestinal dysplasia.
The different phenotype observed with bub3RNAi might be explained by a SAC-independent role of Bub3, which has been shown to form a complex with histone deacetylases, and this interaction appears to confer transcriptional repressor ac-tivity during interphase (Yoon et al., 2004). It is possible that within the genes transcriptionally repressed by this complex, some might affect stem cell maintenance. Interesting parallels can be drawn between our findings and other studies on mam-malian models. Consistent with a model where SAC deficiency and aneuploidy induction potentiate tumor development, mad1 and mad2 heterozygous mice offspring showed increased inci-dence of spontaneous tumors (Michel et al., 2001; Iwanaga et al., 2007). However, haploinsufficiency of bub3 seems to contrast with other SAC gene loss-of-function phenotypes since it does not result in tumorigenesis in mice models (Kalitsis et al., 2005). It would be interesting to revisit these mice models to study how adult stem cells, in different organs, are affected.
Figure 5. Aneuploidy causes ISC accumula-tion. (A and B) Low (A) and high (B) magnifica-tions of a 20-d-old control intestine where ISCs and EBs can be distinguished based on expres-sion of Su(H)GBE-LacZ. esg marks ISCs and EBs, and β-Gal marks EBs. (C and D) Intestines where RNAi constructs against Mad2 or Mps1 were expressed under the control of the esgGAL4 pro-moter during the first 20 d of the adult and where ISCs and EBs can be distinguished as described in A and B. (E) Quantification of percentage of ISCs/ EBs (GFP positive), ISCs (GFP positive/β-Gal neg-ative), and EBs (GFP positive/β-Gal positive) per total cell number (DAPI) in control and SAC loss-of-function situations. n = 25 for controls; n = 25 for mad2RNAi; n = 21 for mps1RNAi (intestines). (F) Control intestine where ISCs can be identified by expression of YFP. (G and H) Intestines where RNAi against Mad2 or Mps1 were expressed spe-cifically in ISCs during the first 20 d after eclosion. Bars: 40 µm (A, C, and F); 10 µm (B). (I) Quanti-fication of ISCs in F–H. Tukey boxplots; **, P < 0.01; ****, P < 0.0001; Mann–Whitney U test. n (intestines) = 19 for control; n (intestines) = 23 for mad2RNAi; n (intestines) = 8 for mps1RNAi.
We and others have previously shown that in Drosophila ima-ginal cells, aneuploidy induction results in apoptosis, and only if apoptosis is blocked can a tumorigenic phenotype be observed
(Dekanty et al., 2012; Morais da Silva et al., 2013). Interestingly, the results described in this study indicate that ISCs do not acti-vate apoptotic pathways in response to aneuploidy, suggesting Figure 6. Dysplasia is driven by overproliferative ISCs. (A–D) 10–15-d-old control, mad2RNAi, mps1RNAi, and NotchRNAi intestines where ISCs/EBs and EEs are marked by Esg expression (esgGal4,UAS GFP) and Pros (antibody), respectively. Note that in NotchRNAi flies, the dysplastic regions are generally populated by cells that express both markers of ISCs/EBs and EE lineages, in contrast with mad2RNAi and mps1RNAi. Bar, 20 µm. (E–G) 10–15-d-old control, mad2RNAi, and mps1RNAi where mitotic cells are labeled with pH3 and EE cells are marked with Pros. (H–J) 10–15-d-old control, mad2RNAi, and mps1RNAi where mitotic cells are labeled with pH3 and EBs are evident by expression of Su(H)GBE-LacZ. Arrows indicate pH3-positive cells. (K–M) Quantifications of overlap between different indicated cell identity markers or mitotic markers in situations described in A–J.
that these cells are somewhat tolerant to genomic imbalance. Furthermore, ISCs seem to behave differently than stem cells in other Drosophila tissues such as the brain. Aneuploidy has been shown not to lead to overproliferation of neuroblasts (Castellanos et al., 2008; Poulton et al., 2017). In the Drosophila intestine, expression of the apoptotic inducer reaper (Jiang et al., 2009), exposure to ionizing radiation (Xing et al., 2015), or bleomycin feeding (Tauc et al., 2017) are examples on which the same ge-netic or chemical insult has been shown to lead to activation of cell death of most differentiated cells but not of ISCs/EBs. These studies and our findings highlight a need to better understand the molecular mechanism underlying the high resistance of in-testinal progenitor cells to apoptosis activation.
We observed in this study that aneuploidy induction results in general JNK activation across the intestinal epithelium and that down-regulation of JNK within progenitor cells is sufficient to prevent the accumulation of these cells. It would be important to investigate in future studies the details of how this general tissue response is regulated (in differentiated and nondifferentiated cells) and whether specific cytokines are produced differently by the different cell types.
Current knowledge strongly implies that the effect of an-euploidy on adult stem behavior is tissue specific; therefore, a cautioned extrapolation of our findings to other Drosophila or mammalian adult tissues should be performed. Mammalian and Drosophila intestinal epithelia share many common similarities that include cell type composition, anatomical compartmental-ization, and pathways governing tissue maintenance and regen-eration (Apidianakis and Rahme, 2011). As a model organism, Drosophila has given significant contributions to our under-standing of the development of different human pathologies including diseases that are characterized by an accumulation of progenitor cells and higher proliferation rates like cancer (Gonzalez, 2013). Thus, we provide in this study an in vivo model of how stem cell failure to maintain genomic stability can lead to tissue pathology that could help us understand how aneuploidy can impact mammalian tissue homeostasis.
Materials and methods
Fly husbandry and stocks
Flies were raised on standard cornmeal–molasses–agar medium. Female progeny from experimental crosses were collected and maintained with <30 flies per vial. Flies were turned onto fresh food vials every 2 d. The following fly stocks used were from the Bloomington Drosophila Stock Center, Vienna Drosophila Resource Center, or generous gifts from the fly community as
indicated: mad2Δ, aldG4422, UAS-mad2RNAi, UAS-mps1RNAi, and
UAS-cenp-metaRNAi (Bloomington Drosophila Stock Center); esgGal4,UAS-GFP;Gal80ts and Su(H)GBE-LacZ;esgGal4,UAS
GF-P;Gal80ts (gifts from L. Jones, University of California, Los Angeles,
Los Angeles, CA); esgGal4,2×YFP; Su(H)GBE-Gal80, tub-Gal80ts
(gift from S. Xou, National Institutes of Health, Bethesda, MD); ub-GFP-SAK (gift from R. Basto, Institut Curie, Paris, France); and mad2GFP and BubR1GFP (gifts from R. Karess, Université Paris Diderot, Paris, France). WT flies were Oregon R. More detailed information about these stocks can be found at Flybase.
Immunostaining, microscopy, and data analysis
Immunofluorescence (IF) microscopy was performed on whole-mount intestines dissected directly in 4% PFA and left overnight (ON) at 4°C for fixation. After fixation, three 10-min washes with PBST (PBS and 0.1% Triton X-100) were performed, and then samples were incubated for 1 h with a blocking solution of PBST/BSA (PBS, 0.1% Triton X-100, and 1% BSA). Then, sam-ples were incubated with primary antibodies ON at 4°C. Then, three 10-min washes with PBST were performed, and intestines were incubated for 2 h with secondary antibodies protected from light. Last, three 10-min washes with PBST were again per-formed, and intestines were mounted in Vectashield mounting medium with DAPI (Vector Laboratories). Images were obtained using a TCS SP5 II (Leica Microsystems) confocal microscope with a high-contrast Plan Apochromat CS 40× 1.10 NA objective and LAS 2.6 software. All images were acquired on the first two fields of view of the posterior midgut (after the pyloric ring) on a 40× water objective; based on recent anatomical and physio-logical characterizations of the Drosophila intestine, this corre-sponds with the P3–P4 (Marianes and Spradling, 2013) or R4–R5 region (Buchon et al., 2013). In this work, we adopted sample sizes that are typically used in the field and for the model system under study. As a general rule, at least 20 intestines were ana-lyzed from at least two biological replicates (progeny from dif-ferent crosses), and at least 10 of those intestines were used for quantifications. Images were taken from both the top and bot-tom layers of the intestines. The N mentioned in figure legends corresponds with the number of flies/intestines analyzed, and for each intestine, four images were taken and used for quan-tifications: two images from the first field of view on the 40× objective (top and bottom) plus two images from the second field of view (top and bottom). Images were analyzed and edited in the following software: LAS X (2.6; Leica Microsystems), Adobe Photoshop, and ImageJ (1.50i; National Institutes of Health). Sta-tistical analyses and graphical displays were performed using Prism 5 (GraphPad Software).
Figure 7. Aneuploidy induction does not result in activation of apoptosis. (A) 10-d-old WT intestine fed 24 h with bleomycin as a positive control for cleaved caspase-3 staining. Many apoptotic cells were detected. Examples are shown in the inset and are indicated by white arrows. (B and C) 10-d-old control and mad2RNAi intestines stained for cleaved caspase-3. No apoptotic cells were found in the control samples. n = 10 intestines. In a total of 17 intestines, apoptotic cells were only found in only two intestines for mad2RNAi (two apoptotic cells in one intestine and three in the other). (D–H) 20-d-old intestines from controls or flies where mad2RNAi or mps1RNAi constructs were expressed in ISCs/EBs; apoptosis was blocked either in ISCs/EBs specifically or in all cell types as indicated in respective genotypes. Bars: 40 µm (main images); 20 µm (insets). (I and J) Quantification of ISCs/EBs or EEs in conditions described in D–H. Control data are the same as shown in Fig. 3. Control, mad2RNAi, and mps1RNAi data are the same as shown in Fig. 2. n = 20 for 10-d mad2RNAi + P35; n = 22 for 10-d mad2RNAi + H99Df(3L); n = 10 for 20-d mad2RNAi + P35; n = 16 for 20-d mad2RNAi + H99Df(3L); n = 12 for 20-d mps1RNAi + P35; n = 16 for 20-d mps1RNAi + H99Df(3L). Tukey boxplots; *, P < 0.05; **, P < 0.01; ***, P < 0.001; ****, P < 0.0001; Mann–Whitney U test.
Antibodies
Intestines were stained with mouse anti-Arm (1:20) and mouse anti-Pros (1:100; Developmental Studies Hybridoma Bank; devel-oped under the auspices of the National Institute of Child Health and Human Development and maintained by the Department of Biological Sciences at The University of Iowa, Iowa City, IA), rabbit anti-phosphohistone H3 (pH3; 1:2,500; EMD Millipore), rabbit anti–
Painting of Fourth (POF; 1:500; gift from J. Larsson, Umeå University, Umeå, Sweden), rabbit anti-GFP (1:5,000; Molecular Probes), mouse anti–β-galactosidase (1:1,000; Cappel; 55976; MP Biomedical), rabbit anti-H2AvD (Rockland), rabbit anti-pERK antibody (phos-pho-p44/42 MAPK; 1:200; 4370; Cell Signaling Technology), and rabbit anti–cleaved caspase-3 (1:200; 9661; Cell Signaling Technol-ogy). Secondary antibodies were diluted 1:500 (Molecular Probes). Figure 8. JNK pathway modulates intestinal dysplasia. (A and B) 10- and 20-d-old control intestines where pucLacZ serves as readout of the activation status of JNK pathway. pucLacZ-positive cells were found in low intensity and in very reduced numbers (white arrows in the insets show examples of pucLacZ-positive cells). (C and D) 10- and 20-d-old intestines where mad2RNAi was expressed and where a strong up-regulation of pucLacZ can be noted (com-pare C’’ and D’’ with A’’ and B’’). Up-regulation was found in both progenitor cells (Esg positive; yellow arrows in the insets) and differentiated cells (Esg negative; white arrows in the insets). (E) 20-d-old intestine where mad2RNAi was expressed. Note that pucLacZ is up-regulated within midgut regions where dysplasia is more pronounced (yellow-dashed areas) as opposed to regions within the same gut where dyspla-sia is absent or less pronounced (green-dashed areas). (F) Quantification of pucLacZ signal intensity in ISCs/EBs (Esg positive) and differen-tiated cells (Esg negative) at 20 d. (G) 20-d-old intestine where mad2RNAi was coexpressed with BskDN in ISCs/EBs. Note the absence of
dys-plasia. Compare with control and mad2RNAi in
Fig. 2. Bars: 40 µm (main images); 20 µm (insets). (H) Quantification of the percentage ISCs/EBs and EEs in control, mad2RNAi, and mad2RNAi + BasketDN. Control and mad2RNAi data are
the same as shown in Fig. 3. n = 14 for 10-d mad2RNAi + basketDN; n = 21 for 20-d mad2RNAi
+ basketDN. Tukey boxplots; **, P < 0.01; ****,
P < 0.0001; Mann-Whitney U test. (I) Graphical abstract of results gathered on the impact of aneuploidy induction in the intestine epithelium. BM, basement membrane; VM, visceral muscle.
Colchicine treatments
Solutions of either (1) 0.2 mM colchicine with 5% sucrose (exper-iment) or (2) 5% sucrose only (control) were prepared fresh on each day of experiment, and 2,000 µl solution was applied to a filter paper that was placed at the bottom of each empty vial. Flies were transferred into these vials with soaked kimwipe after a pe-riod of feeding/aging in normal food: 4–6 d after eclosion in the case of mutants and WT (Fig. 1) and 2 d after eclosion in the case of the RNAi and control experiments (Figs. S1 and S3). After 24 h feeding in vials with control or colchicine solutions, intestines were fixed and subjected to IF in order to evaluate mitotic rates.
FACS analysis
Female intestines were dissected (30–50 per genotype) in 1× PBS/1% BSA solution in dissecting slides on ice for ≤2 h and then transferred to 1.5 ml Eppendorf, also on ice. After all intestines for different genotypes were dissected, initial sample prepara-tion was performed according to Lopes and Casares (2010). Once dissociation of cells was achieved, subsequent protocol steps were then performed as described by Gogendeau et al. (2015). 3.7% formaldehyde in 1× PBS was used for fixation, and propid-ium iodide (PI) and RNase incubation was done ON. PI fluores-cence was determined by flow cytometry using a BD FACS Canto II flow cytometer. DNA analysis (ploidy analysis) on single- fluorescence histograms was done using FlowJo (TreeStar). Experimental conditions were always compared with control samples dissected and FACs sorted in the same day. Multiple bio-logical replicates were always performed, and their numbers are indicated in the corresponding figure legends.
FISH
Oligonucleotides probe for dodecaheterochromatic repeats (Chromosome III), and 359 repeats (Chromosome X) were both synthesized with a 5′ CY3 by Integrated DNA Technologies. The following sequences were used: 5′-CY3-CCC GTA CTG GTC CCG TAC TGG TCC CG-3′ (Chromosome III) and 5′-CY3-GGG ATC GTT AGC ACT GGT AAT TAG CTGC-3′ (Chromosome X). Our FISH protocol was adapted from previously described methods (Dernburg, 2011; Joyce et al., 2012; Gogendeau et al., 2015). Identification of ISCs/EBs (GFP+) is required. Thus, intestines from female flies
were dissected and fixed ON in PFA 4%, washed three times in PBST (PBS and 0.3% Triton X-100), blocked for 30 min in 1× PBS/ BSA, incubated with an anti-GFP antibody (1:1,000) ON, washed three times in PBST, and incubated with secondary antibody for 2 h at room temperature. Intestines were then washed three times in PBST and fixed another time for 40 min in 4% PFA before proceeding with the probe hybridization. Intestines were then washed three times in PBST, 1× in 2×SSCT (2×SSC [EU0300; Eu-romedex]/0.1% Tween-20), and 1× in 2×SSCT/50% formamide (47671; Sigma-Aldrich). For the prehybridization step, intestines were transferred to a PCR tube containing 92°C prewarmed 2×SSCT/50% formamide and denaturated for 3 min at 92°C. In-testines were then hybridized for 5 min at 92°C with a previously denaturated DNA probe (40–80 ng) in hybridization buffer (20% dextran sulfate [D8906; Sigma-Aldrich]/2×SSCT/50% deionized formamide [F9037; Sigma-Aldrich] and 0.5 mg/ml salmon sperm DNA [D1626; Sigma-Aldrich]) 3 min after denaturation at 92°C,
tubes were left ON at 37°C. Samples were then washed with 60°C prewarmed 2×SSCT for 10 min and then for 1 × 5 min in 2×SSCT at room temperature. Probe hybridization in intestinal samples was performed in a thermocycler. Samples were then incubated in mounting medium for fluorescence with DAPI (H-1200; Vector Laboratories). In Drosophila, high levels of chromosome pairing can be present (Bosco, 2012). Therefore, for the two chromosome probes used, cells were scored as aneuploid only when more than two dots of the respective FISH probes were detected.
Loss of Chromosome IV
Immunostaining with the anti-POF antibody was used to label the fourth chromosome. ISCs/EBs were identified based on escargot-Gal4 expression cells, and cells without IF signal for the anti-POF antibody were considered to be cells that lost Chromosome IV.
Determination of mitotic angles
ISCs undergoing mitosis were identified by positive staining of the mitotic marker pH3. α-Tubulin was used in combination with pH3 and DAPI to determine the mitotic phase. Spindle orienta-tion in stem cells is dynamic, and mechanisms regulating its posi-tion can act until anaphase is initiated (Yadlapalli and Yamashita, 2012)((McNally, 2013). Therefore, in order to measure the final mitotic angle, cells in prometaphase and metaphase were ex-cluded from the analysis, and mitotic angle was only determined in cells at anaphase or telophase. Multiple confocal z stacks were acquired, and 3D reconstructions were performed using ImageJ. In these 3D reconstruction images, one line was drawn aligned with the basement membrane, and another was drawn intersect-ing the center of the two separatintersect-ing nuclei of the mitotic cell. The angle between these two lines was determined using ImageJ and was considered the angle of stem cell division.
Online supplemental material
Fig. S1 shows that Mps1 overexpression leads to ISC cell-cycle arrest. Fig. S2 shows that unlike Mad2, Mps1, or BubR1 deple-tion, Bub3 loss of function does not cause a dysplastic phenotype. Fig. S3 shows that SAC impairment and centrosome amplifica-tion do not affect the angle of stem cell division. Fig. S4 shows that SAC function is progressively restored in Mad2RNAi in-testines upon the shift to 18°C. Fig. S5 shows that kinetochore disruption or centrosome amplification induce aneuploidy and accumulation of ISCs.
Acknowledgments
The authors thank L. Jones, C. Lopes, B. Edgar, R. Basto, P. Pereira, J. Larsson, and S. Hou laboratories as well as the Vienna Drosoph-ila RNAi Center for reagents and stocks.
This article is a result of the project Norte Portugal Regional Operational Program (NOR TE 2020) Norte-01-0145-FED ER-000029 – Advancing Cancer Research: From basic knowledge to application, under the POR TUG AL 2020 Partnership Agreement through the European Regional Development Fund, and it is also funded by National Funds through Fundação para a Ciência e a Tecnologia under the project PTDC/BEX-BCM/1921/2014.
The authors declare no competing financial interests.
Author contributions: L.P. Resende and C.E. Sunkel planned experiments. L.P. Resende, A. Monteiro, R. Brás, and T. Lopes performed the experiments and, together with C.E. Sunkel, per-formed data analysis. L.P. Resende and C.E. Sunkel wrote and edited the manuscript.
Submitted: 3 May 2018 Revised: 1 August 2018 Accepted: 31 August 2018
References
Amcheslavsky, A., J. Jiang, and Y.T. Ip. 2009. Tissue damage-induced intestinal stem cell division in Drosophila. Cell Stem Cell. 4:49–61. https:// doi .org/ 10 .1016/ j .stem .2008 .10 .016
Amcheslavsky, A., W. Song, Q. Li, Y. Nie, I. Bragatto, D. Ferrandon, N. Perrimon, and Y.T. Ip. 2014. Enteroendocrine cells support intestinal stem-cell-me-diated homeostasis in Drosophila. Cell Reports. 9:32–39. https:// doi .org/ 10 .1016/ j .celrep .2014 .08 .052
Apidianakis, Y., and L.G. Rahme. 2011. Drosophila melanogaster as a model for human intestinal infection and pathology. Dis. Model. Mech. 4:21–30.
https:// doi .org/ 10 .1242/ dmm .003970
Basto, R., K. Brunk, T. Vinadogrova, N. Peel, A. Franz, A. Khodjakov, and J.W. Raff. 2008. Centrosome amplification can initiate tumorigenesis in flies.
Cell. 133:1032–1042. https:// doi .org/ 10 .1016/ j .cell .2008 .05 .039
Biteau, B., C.E. Hochmuth, and H. Jasper. 2008. JNK activity in somatic stem cells causes loss of tissue homeostasis in the aging Drosophila gut. Cell
Stem Cell. 3:442–455. https:// doi .org/ 10 .1016/ j .stem .2008 .07 .024
Biteau, B., C.E. Hochmuth, and H. Jasper. 2011. Maintaining tissue homeosta-sis: dynamic control of somatic stem cell activity. Cell Stem Cell. 9:402– 411. https:// doi .org/ 10 .1016/ j .stem .2011 .10 .004
Bosco, G. 2012. Chromosome pairing: a hidden treasure no more. PLoS Genet. 8:e1002737. https:// doi .org/ 10 .1371/ journal .pgen .1002737
Buchon, N., N.A. Broderick, S. Chakrabarti, and B. Lemaitre. 2009. Invasive and indigenous microbiota impact intestinal stem cell activity through multiple pathways in Drosophila. Genes Dev. 23:2333–2344. https:// doi .org/ 10 .1101/ gad .1827009
Buchon, N., D. Osman, F.P.A. David, H.Y. Fang, J.-P. Boquete, B. Deplancke, and B. Lemaitre. 2013. Morphological and molecular characterization of adult midgut compartmentalization in Drosophila. Cell Reports. 3:1725– 1738. https:// doi .org/ 10 .1016/ j .celrep .2013 .04 .001
Buffin, E., D. Emre, and R.E. Karess. 2007. Flies without a spindle checkpoint.
Nat. Cell Biol. 9:565–572. https:// doi .org/ 10 .1038/ ncb1570
Castellanos, E., P. Dominguez, and C. Gonzalez. 2008. Centrosome dysfunc-tion in Drosophila neural stem cells causes tumors that are not due to genome instability. Curr. Biol. 18:1209–1214. https:// doi .org/ 10 .1016/ j .cub .2008 .07 .029
Chen, J., A.-C. Sayadian, N. Lowe, H. Lovegrove, and D.S. Johnston. 2018. An alternative mode of epithelial polarity in the Drosophila midgut. bioRxiv. (preprint posted April 24, 2018)https:// doi .org/ 10 .1101/ 307579
Choi, N.-H., J.-G. Kim, D.-J. Yang, Y.-S. Kim, and M.-A. Yoo. 2008. Age-related changes in Drosophila midgut are associated with PVF2, a PDGF/VEGF-like growth factor. Aging Cell. 7:318–334. https:// doi .org/ 10 .1111/ j .1474 -9726 .2008 .00380 .x
Clemente-Ruiz, M., M. Muzzopappa, and M. Milán. 2014. Tumor suppres-sor roles of CENP-E and Nsl1 in Drosophila epithelial tissues. Cell Cycle. 13:1450–1455. https:// doi .org/ 10 .4161/ cc .28417
Conde, C., M. Osswald, J. Barbosa, T. Moutinho-Santos, D. Pinheiro, S. Guim-arães, I. Matos, H. Maiato, and C.E. Sunkel. 2013. Drosophila Polo regu-lates the spindle assembly checkpoint through Mps1-dependent BubR1 phosphorylation. EMBO J. 32:1761–1777. https:// doi .org/ 10 .1038/ emboj .2013 .109
Dekanty, A., L. Barrio, M. Muzzopappa, H. Auer, and M. Milán. 2012. Aneu-ploidy-induced delaminating cells drive tumorigenesis in Drosophila epithelia. Proc. Natl. Acad. Sci. USA. 109:20549–20554. https:// doi .org/ 10 .1073/ pnas .1206675109
de Navascués, J., C.N. Perdigoto, Y. Bian, M.H. Schneider, A.J. Bardin, A. Martínez-Arias, and B.D. Simons. 2012. Drosophila midgut homeostasis involves neutral competition between symmetrically dividing intes-tinal stem cells. EMBO J. 31:2473–2485. https:// doi .org/ 10 .1038/ emboj .2012 .106
Dernburg, A.F. 2011. Hybridization to tissues in suspension for whole-mount FISH in Drosophila. Cold Spring Harb. Protoc. 2011:1534–1537. https:// doi .org/ 10 .1101/ pdb .prot066902
Dobles, M., V. Liberal, M.L. Scott, R. Benezra, and P.K. Sorger. 2000. Chromo-some missegregation and apoptosis in mice lacking the mitotic check-point protein Mad2. Cell. 101:635–645. https:// doi .org/ 10 .1016/ S0092 -8674(00)80875 -2
Godinho, S.A., R. Picone, M. Burute, R. Dagher, Y. Su, C.T. Leung, K. Polyak, J.S. Brugge, M. Théry, and D. Pellman. 2014. Oncogene-like induction of cellular invasion from centrosome amplification. Nature. 510:167–171.
https:// doi .org/ 10 .1038/ nature13277
Gogendeau, D., K. Siudeja, D. Gambarotto, C. Pennetier, A.J. Bardin, and R. Basto. 2015. Aneuploidy causes premature differentiation of neural and intestinal stem cells. Nat. Commun. 6:8894. https:// doi .org/ 10 .1038/ ncomms9894
Gönczy, P. 2015. Centrosomes and cancer: revisiting a long-standing relation-ship. Nat. Rev. Cancer. 15:639–652. https:// doi .org/ 10 .1038/ nrc3995
Gonzalez, C. 2013. Drosophila melanogaster: a model and a tool to investigate malignancy and identify new therapeutics. Nat. Rev. Cancer. 13:172–183.
https:// doi .org/ 10 .1038/ nrc3461
Goulas, S., R. Conder, and J.A. Knoblich. 2012. The Par complex and integrins direct asymmetric cell division in adult intestinal stem cells. Cell Stem
Cell. 11:529–540. https:// doi .org/ 10 .1016/ j .stem .2012 .06 .017
Guo, Z., and B. Ohlstein. 2015. Bidirectional Notch signaling regulates Dro-sophila intestinal stem cell multipotency. Science. 350:aab0988. https:// doi .org/ 10 .1126/ science .aab0988
Guo, Z., I. Driver, and B. Ohlstein. 2013. Injury-induced BMP signaling nega-tively regulates Drosophila midgut homeostasis. J. Cell Biol. 201:945–961.
https:// doi .org/ 10 .1083/ jcb .201302049
Harper, L.J., D.E. Costea, L. Gammon, B. Fazil, A. Biddle, and I.C. Mackenzie. 2010. Normal and malignant epithelial cells with stem-like properties have an extended G2 cell cycle phase that is associated with apoptotic resistance. BMC Cancer. 10:166. https:// doi .org/ 10 .1186/ 1471 -2407 -10 -166
Hay, B.A., T. Wolff, and G.M. Rubin. 1994. Expression of baculovirus P35 pre-vents cell death in Drosophila. Development. 120:2121–2129.
Holland, A.J., and D.W. Cleveland. 2012. Losing balance: the origin and impact of aneuploidy in cancer. EMBO Rep. 13:501–514. https:// doi .org/ 10 .1038/ embor .2012 .55
Iwanaga, Y., Y.-H. Chi, A. Miyazato, S. Sheleg, K. Haller, J.-M. Peloponese Jr., Y. Li, J.M. Ward, R. Benezra, and K.-T. Jeang. 2007. Heterozygous deletion of mitotic arrest-deficient protein 1 (MAD1) increases the incidence of tumors in mice. Cancer Res. 67:160–166. https:// doi .org/ 10 .1158/ 0008 -5472 .CAN -06 -3326
Jiang, H., and B.A. Edgar. 2012. Intestinal stem cell function in Drosophila and mice. Curr. Opin. Genet. Dev. 22:354–360. https:// doi .org/ 10 .1016/ j .gde .2012 .04 .002
Jiang, H., P.H. Patel, A. Kohlmaier, M.O. Grenley, D.G. McEwen, and B.A. Edgar. 2009. Cytokine/Jak/Stat signaling mediates regeneration and homeo-stasis in the Drosophila midgut. Cell. 137:1343–1355. https:// doi .org/ 10 .1016/ j .cell .2009 .05 .014
Joyce, E.F., B.R. Williams, T. Xie, and C.-T. Wu. 2012. Identification of genes that promote or antagonize somatic homolog pairing using a high-through-put FISH-based screen. PLoS Genet. 8:e1002667. https:// doi .org/ 10 .1371/ journal .pgen .1002667
Kalitsis, P., K.J. Fowler, B. Griffiths, E. Earle, C.W. Chow, K. Jamsen, and K.H.A. Choo. 2005. Increased chromosome instability but not cancer predis-position in haploinsufficient Bub3 mice. Genes Chromosomes Cancer. 44:29–36. https:// doi .org/ 10 .1002/ gcc .20215
Knouse, K.A., T. Davoli, S.J. Elledge, and A. Amon. 2017. Aneuploidy in Can-cer: Seq-ing Answers to Old Questions. Annu. Rev. Cancer Biol. 1:335–354.
https:// doi .org/ 10 .1146/ annurev -cancerbio -042616 -072231
Larsson, J., J.D. Chen, V. Rasheva, A. Rasmuson-Lestander, and V. Pirrotta. 2001. Painting of fourth, a chromosome-specific protein in Drosophila.
Proc. Natl. Acad. Sci. USA. 98:6273–6278. https:// doi .org/ 10 .1073/ pnas .111581298
Lin, G., X. Zhang, J. Ren, Z. Pang, C. Wang, N. Xu, and R. Xi. 2013. Integrin signaling is required for maintenance and proliferation of intestinal stem cells in Drosophila. Dev. Biol. 377:177–187. https:// doi .org/ 10 .1016/ j .ydbio .2013 .01 .032
Lopes, C.S., and F. Casares. 2010. hth maintains the pool of eye progenitors and its downregulation by Dpp and Hh couples retinal fate acquisition with cell cycle exit. Dev. Biol. 339:78–88. https:// doi .org/ 10 .1016/ j .ydbio .2009 .12 .020
Mantel, C., Y. Guo, M.R. Lee, M.-K. Kim, M.-K. Han, H. Shibayama, S. Fukuda, M.C. Yoder, L.M. Pelus, K.-S. Kim, and H.E. Broxmeyer. 2007.
point-apoptosis uncoupling in human and mouse embryonic stem cells: a source of karyotpic instability. Blood. 109:4518–4527. https:// doi .org/ 10 .1182/ blood -2006 -10 -054247
Marianes, A., and A.C. Spradling. 2013. Physiological and stem cell compart-mentalization within the Drosophila midgut. eLife. 2:e00886. https:// doi .org/ 10 .7554/ eLife .00886
Markstein, M., S. Dettorre, J. Cho, R.A. Neumüller, S. Craig-Müller, and N. Perrimon. 2014. Systematic screen of chemotherapeutics in Drosophila stem cell tumors. Proc. Natl. Acad. Sci. USA. 111:4530–4535. https:// doi .org/ 10 .1073/ pnas .1401160111
Marteil, G., A. Guerrero, A.F. Vieira, B.P. de Almeida, P. Machado, S. Men-donça, M. Mesquita, B. Villarreal, I. Fonseca, M.E. Francia, et al. 2018. Over-elongation of centrioles in cancer promotes centriole amplifica-tion and chromosome missegregaamplifica-tion. Nat. Commun. 9:1258. https:// doi .org/ 10 .1038/ s41467 -018 -03641 -x
Martín-Blanco, E., A. Gampel, J. Ring, K. Virdee, N. Kirov, A.M. Tolkovsky, and A. Martinez-Arias. 1998. puckered encodes a phosphatase that me-diates a feedback loop regulating JNK activity during dorsal closure in Drosophila. Genes Dev. 12:557–570. https:// doi .org/ 10 .1101/ gad .12 .4 .557
McNally, F.J. 2013. Mechanisms of spindle positioning. J. Cell Biol. 200:131–140.
https:// doi .org/ 10 .1083/ jcb .201210007
Micchelli, C.A., and N. Perrimon. 2006. Evidence that stem cells reside in the adult Drosophila midgut epithelium. Nature. 439:475–479. https:// doi .org/ 10 .1038/ nature04371
Michel, L.S., V. Liberal, A. Chatterjee, R. Kirchwegger, B. Pasche, W. Gerald, M. Dobles, P.K. Sorger, V.V. Murty, and R. Benezra. 2001. MAD2 hap-lo-insufficiency causes premature anaphase and chromosome instabil-ity in mammalian cells. Nature. 409:355–359. https:// doi .org/ 10 .1038/ 35053094
Morais da Silva, S., T. Moutinho-Santos, and C.E. Sunkel. 2013. A tumor sup-pressor role of the Bub3 spindle checkpoint protein after apoptosis in-hibition. J. Cell Biol. 201:385–393. https:// doi .org/ 10 .1083/ jcb .201210018
Moura, M., M. Osswald, N. Leça, J. Barbosa, A.J. Pereira, H. Maiato, C.E. Sun-kel, and C. Conde. 2017. Protein Phosphatase 1 inactivates Mps1 to en-sure efficient Spindle Assembly Checkpoint silencing. eLife. 6:e25366.
https:// doi .org/ 10 .7554/ eLife .25366
Musacchio, A., and E.D. Salmon. 2007. The spindle-assembly checkpoint in space and time. Nat. Rev. Mol. Cell Biol. 8:379–393. https:// doi .org/ 10 .1038/ nrm2163
O’Brien, L.E., S.S. Soliman, X. Li, and D. Bilder. 2011. Altered modes of stem cell division drive adaptive intestinal growth. Cell. 147:603–614.
https:// doi .org/ 10 .1016/ j .cell .2011 .08 .048
Ohlstein, B., and A. Spradling. 2006. The adult Drosophila posterior midgut is maintained by pluripotent stem cells. Nature. 439:470–474. https:// doi .org/ 10 .1038/ nature04333
Park, J.-S., Y.-S. Kim, and M.-A. Yoo. 2009. The role of p38b MAPK in age-re-lated modulation of intestinal stem cell proliferation and differentiation in Drosophila. Aging (Albany N.Y.). 1:637–651.
Patel, P.H., D. Dutta, and B.A. Edgar. 2015. Niche appropriation by Drosophila intestinal stem cell tumours. Nat. Cell Biol. 17:1182–1192. https:// doi .org/ 10 .1038/ ncb3214
Poulton, J.S., J.C. Cuningham, and M. Peifer. 2017. Centrosome and spindle assembly checkpoint loss leads to neural apoptosis and reduced brain size. J. Cell Biol. 216:1255–1265. https:// doi .org/ 10 .1083/ jcb .201607022
Ricke, R.M., and J.M. van Deursen. 2013. Aneuploidy in health, disease, and aging. J. Cell Biol. 201:11–21. https:// doi .org/ 10 .1083/ jcb .201301061
Sheltzer, J.M., and A. Amon. 2011. The aneuploidy paradox: costs and benefits of an incorrect karyotype. Trends Genet. 27:446–453. https:// doi .org/ 10 .1016/ j .tig .2011 .07 .003
Tauc, H.M., A. Tasdogan, and P. Pandur. 2014. Isolating intestinal stem cells from adult Drosophila midguts by FACS to study stem cell behavior during aging. J. Vis. Exp. (94). https:// doi .org/ 10 .3791/ 52223
Tauc, H.M., A. Tasdogan, P. Meyer, and P. Pandur. 2017. Nipped-A regulates in-testinal stem cell proliferation in Drosophila. Development. 144:612–623.
https:// doi .org/ 10 .1242/ dev .142703
Wang, C., X. Guo, K. Dou, H. Chen, and R. Xi. 2015. Ttk69 acts as a master repressor of enteroendocrine cell specification in Drosophila intestinal stem cell lineages. Development. 142:3321–3331. https:// doi .org/ 10 .1242/ dev .123208
White, K., M.E. Grether, J.M. Abrams, L. Young, K. Farrell, and H. Steller. 1994. Genetic control of programmed cell death in Drosophila. Science. 264:677–683. https:// doi .org/ 10 .1126/ science .8171319
Xing, Y., T.T. Su, and H. Ruohola-Baker. 2015. Tie-mediated signal from apop-totic cells protects stem cells in Drosophila melanogaster. Nat. Commun. 6:7058. https:// doi .org/ 10 .1038/ ncomms8058
Yadlapalli, S., and Y.M. Yamashita. 2012. Spindle positioning in the stem cell niche. Wiley Interdiscip. Rev. Dev. Biol. 1:215–230. https:// doi .org/ 10 .1002/ wdev .16
Yin, C., and R. Xi. 2018. A Phyllopod-Mediated Feedback Loop Promotes Intes-tinal Stem Cell Enteroendocrine Commitment in Drosophila. Stem Cell
Reports. 10:43–57. https:// doi .org/ 10 .1016/ j .stemcr .2017 .11 .014
Yoon, Y.-M., K.-H. Baek, S.-J. Jeong, H.-J. Shin, G.-H. Ha, A.-H. Jeon, S.-G. Hwang, J.-S. Chun, and C.-W. Lee. 2004. WD repeat-containing mitotic checkpoint proteins act as transcriptional repressors during interphase.
FEBS Lett. 575:23–29. https:// doi .org/ 10 .1016/ j .febslet .2004 .07 .089
Yucel, J.K., J.D. Marszalek, J.R. McIntosh, L.S. Goldstein, D.W. Cleveland, and A.V. Philp. 2000. CENP-meta, an essential kinetochore kinesin required for the maintenance of metaphase chromosome alignment in Drosoph-ila. J. Cell Biol. 150:1–11. https:// doi .org/ 10 .1083/ jcb .150 .1 .1
Zeng, X., and S.X. Hou. 2015. Enteroendocrine cells are generated from stem cells through a distinct progenitor in the adult Drosophila posterior midgut. Development. 142:644–653. https:// doi .org/ 10 .1242/ dev .113357
Zeng, X., C. Chauhan, and S.X. Hou. 2010. Characterization of midgut stem cell- and enteroblast-specific Gal4 lines in drosophila. Genesis. 48:607– 611. https:// doi .org/ 10 .1002/ dvg .20661
Zhou, J., and P. Giannakakou. 2005. Targeting microtubules for cancer che-motherapy. Curr. Med. Chem. Anticancer Agents. 5:65–71. https:// doi .org/ 10 .2174/ 1568011053352569