PROGRAMA DE PÓS-GRADUAÇÃO EM BIOLOGIA NÍVEL DOUTORADO
LACINA MARIA FREITAS TEIXEIRA
INFLUÊNCIA DA HETEROGENEIDADE ESPACIAL E DA ESCALA DE TEMPO NA ESTRUTURA E DINÂMICA DA COMUNIDADE FITOPLANCTÔNICA EM UM LAGO
RASO SUBTROPICAL (LAGOA MANGUEIRA, RS)
LACINA MARIA FREITAS TEIXEIRA
INFLUÊNCIA DA HETEROGENEIDADE ESPACIAL E DA ESCALA DE TEMPO NA ESTRUTURA E DINÂMICA DA COMUNIDADE FITOPLANCTÔNICA EM UM LAGO
RASO SUBTROPICAL (LAGOA MANGUEIRA, RS)
Tese apresentada como requisito parcial para a obtenção do título de Doutor, pelo Programa de Pós-Graduação em Biologia da Universidade do Vale do Rio dos Sinos – UNISINOS.
Área de Concentração: Diversidade e Manejo da Vida Silvestre.
Orientador: Prof. Dr. Uwe Horst Schulz
Coorientadora: Profª. Dra. Luciane Oliveira Crossetti
F866i Freitas-Teixeira, Lacina Maria
Influência da heterogeneidade espacial e da escala de tempo na estrutura e dinâmica da comunidade fitoplanctônica em um lago raso subtropical (Lagoa Mangueira, RS) / por Lacina Maria Freitas-Teixeira. -- São Leopoldo, 2015.
89 f. : il. ; 30 cm.
Com: artigos “Temporal variability determines phytoplankton structure over spatial organization in a large shallow heterogeneous subtropical lake ; A influência da heterogeneidade espaço-temporal na abordagem funcional do fitoplâncton em lago raso subtropical (Lagoa Mangueira, sul do Brasil) ; Estados de equilíbrio da comunidade fitoplanctônica nas regiões pelágica e litoral de lago raso subtropical regido pela hidrodinâmica”.
Tese (doutorado) – Universidade do Vale do Rio dos Sinos, Programa de Pós-Graduação em Biologia, São Leopoldo, RS, 2015.
Área de concentração: Diversidade e Manejo de Vida Silvestre. Orientação: Prof. Dr. Uwe Horst Schulz, Escola Politécnica ; Coorientação: Profª. Drª. Luciane Oliveira Crossetti, Universidade Federal do Rio Grande do Sul.
1.Limnologia. 2.Plancto. 3.Plancto de água doce. 4.Alga de água doce – Rio Grande do Sul. 5.Hidrobiologia. I.Schulz, Uwe Horst. II.Crossetti, Luciane Oliveira. III.Título.
CDU 556.55 574.583 574.5
Catalogação na publicação:
AGRADECIMENTOS
Ao realizar um trabalho como este, que exige o melhor que temos, muita dedicação e, principalmente, “se puxar”, como dizem os meus alunos, tenho a certeza que sou como um grão de areia na imensidão do deserto. Quase nada represento, sei que nada sei, mas a rede de conhecimento coletivo em que nos entrelaçamos pelos caminhos da ciência, nos dá um pouco mais de luz e entendimento. A esta altura da minha vida, em que poderia estar em casa esperando pacientemente o entardecer da minha vida ou tomando chimarrão com os amigos, me vejo batalhando na limnologia, tentando entender e passar adiante, pelo menos um pouco do significado de fazer pesquisas. Para mim isto representa me afirmar como pessoa e tentar fazer com que a minha vida não tenha sido em vão. É isso que espero. Que alguém, em qualquer lugar deste mundo, possa aproveitar um pouquinho que deixo aqui, neste trabalho. Encho-me de alegria, quando constato, lendo Tagore, que nós “gostamos da sabedoria porque não temos sempre de a acabar”. É por isto que me sinto em paz! Após estas reflexões que achei legal compartilhar com todos, passo a agradecer.
Agradeço especialmente ao professor Dr. Uwe Horst Schulz, primeiramente por ter “reaceito” a orientação, faltando pouco mais de um ano para o término da tese e, depois, pela sua disponibilidade, permanente solicitude e pelo exemplo de determinação e competência.
Agradeço sobretudo à minha coorientadora, Luciane Oliveira Crossetti pelos ensinamentos e incentivos, pelo exemplo de dedicação à ciência, pela sua paciência e companheirismo. A Lu tem responsabilidade direta na construção desta Tese. O resultado deste processo criativo é que acabamos construindo uma fraternal e cada dia mais sólida amizade, que carregaremos para sempre.
Agradeço à Universidade do Vale do Rio dos Sinos – UNISINOS, ao seu corpo docente e funcionários do PPG de Biologia, especialmente à Fernanda Fraga pela atenção, disponibilidade e competência. Aos meus colegas do antigo laboratório de Ecologia Vegetal, especialmente à Andressa, Claudia, Tiziane, Mariane, Mônica, Gisele, Jaiana e Juliana pelo convívio fraterno e alegre, em meio ás identificações do fitoplâncton.
Ao Instituto Federal de Educação, Ciência e Tecnologia Sul-riograndense e aos meus queridos colegas do Campus Sapucaia do Sul, que me deram suporte para que eu realizasse o doutorado. À minha colega de Biologia, Daniele, que assumiu as minhas turmas, até o término desta empreitada.
Ao Instituto de Pesquisas Hidráulicas, da UFRGS, cujo projeto coordenado pelo Prof. Dr. David da Motta Marques, me forneceu a infraestrutura necessária para a realização deste estudo, o que me permitiu o uso de todas as suas facilidades, inclusive às análises laboratoriais que constam neste trabalho.
Às colegas de pesquisa, parceiras neste projeto, que me apoiaram com seu companheirismo e amizade, me auxiliando nas coletas na lagoa Mangueira, em especial às Dras. Lúcia Rodrigues, Luciana Cardoso, Luciane Crossetti e doutoranda Denise Matias de Farias, que muito enriqueceram este trabalho, com discussões, análises e sugestões. À Juliana Bohnenberger pela amizade, pela sua valiosa colaboração no desenrolar deste trabalho, pelo auxílio nas análises estatísticas e, principalmente pela atenção zelosa comigo e com o término da tese.
Agradeço a todos os membros da banca examinadora pelas sugestões no sentido de melhorar a qualidade deste trabalho.
A todos os amigos que, através de uma simples palavra, me incentivaram a continuar, me permitindo transpor os obstáculos que ainda estavam por vir. A todas as pessoas que de alguma forma contribuíram para o desfecho deste trabalho.
RESUMO
contribuição das espécies Chroococcus limneticus, Aphanocapsa conferta e Aphanothece smithii a partir do 9° dia na região pelágica e praticamente todo o período estudado na região litoral indicam que embora tenha se verificado a variação da precipitação e vento ao longo do tempo, estados de equilíbrio da comunidade fitoplanctônica em ambientes fortemente condicionados pela hidrodinâmica podem ocorrer.
ABSTRACT
limneticus, Aphanocapsa conferta and Aphanothece smithii from the 9th day in the pelagic region and practically the entire period studied in the coastal region indicate that despite the variation in precipitation and wind observed over time, steady-state of the phytoplankton community in environments strongly conditioned by hydrodynamics may occur.
SUMÁRIO
1 INTRODUÇÃO GERAL ... 11
2 ARTIGO 1 - TEMPORAL VARIABILITY DETERMINES PHYTOPLANKTON STRUCTURE OVER SPATIAL ORGANIZATION IN A LARGE SHALLOW HETEROGENEOUS SUBTROPICAL LAKE ... 14
3 ARTIGO 2 - A INFLUÊNCIA DA HETEROGENEIDADE ESPAÇO-TEMPORAL NA ABORDAGEM FUNCIONAL DO FITOPLÂNCTON EM LAGO RASO
SUBTROPICAL (LAGOA MANGUEIRA, SUL DO BRASIL) ... 42
4 ARTIGO 3 - ESTADOS DE EQUILÍBRIODA COMUNIDADE
FITOPLANCTÔNICA NAS REGIÕES PELÁGICA E LITORAL DE LAGO RASO SUBTROPICAL REGIDO PELA HIDRODINÂMICA ... 67
5 CONSIDERAÇÕES FINAIS ... 87
1 INTRODUÇÃO GERAL
O plâncton foi descoberto e caracterizado por volta dos séculos XVII e XVIII, porém foi Viktor Hensen, em 1887, que propôs o termo plâncton para designar as partículas vivas e levadas pelo movimento da água. É constituído pelo fitoplâncton, zooplâncton e bacterioplâncton. O fitoplâncton é formado por organismos bastante diversos, de origem polifilética, composto principalmente por seres unicelulares autótrofos, que não são capazes de vencer as correntes. (FALKOVISK ; RAVEN, 1997). A comunidade do fitoplâncton é, portanto, composta por organismos procariontes e eucariontes fotoautótrofos portadores de clorofila, suspensos na coluna de água e que não apresentam locomoção suficiente para vencer os movimentos da água. Embora microscópicas, as algas fitoplanctônicas possuem densidade ligeiramente superior a da água e, por este motivo, surgiram adaptações que impedem ou reduzem seu afundamento ou que, mesmo após afundarem, permitem que a célula sobreviva no escuro. Todas as espéciesdepositam algum tipo de amido como material de reserva, podem ou não possuir flagelos e apresentam uma parede celular composta por diferentes substâncias (celulose, sílica, calcáreo, etc.). As algas são os primeiros elementos da cadeia alimentar (BONILLA et al., 2005) constituindo, desta forma, a base da rede trófica que mantém o funcionamento e o equilíbrio dos ecossistemas aquáticos. Além do carbono, os organismos do fitoplâncton demandam vários nutrientes inorgânicos, dentre eles, nitrogênio inorgânico, fósforo, sílica e outros elementos em menor quantidade. Assim, tendem a variar de acordo com as características ambientais. A variabilidade dos recursos no espaço e no tempo determina a estrutura da comunidade fitoplanctônica.
especiação, diminuem ou evitam a competição entre as espécies e, como consequência, ocorre o aumento da diversidade de espécies. (BAZZAZ, 1975).
De acordo com Scheffer e De Boer (1995) existem vários mecanismos que podem causar heterogeneidade espacial no fitoplâncton em lagos rasos. Pode ser por pastagem realizada pelo zooplâncton, pela cobertura de macrófitas aquáticas, especialmente na região litorânea, pela presença de sedimentos e pedras.
Para grandes lagos rasos, o vento pode ser um fator dominante que leva a acentuada heterogeneidade espacial e temporal do fitoplâncton (CARRICK; ALDRIDGE; SCHELSKE, 1993), quer indiretamente, por afetar as concentrações locais de nutrientes, devido à ressuspensão de partículas. O vento também altera o nível da água em diferentes compartimentos do lago e desta forma, modifica a disponibilidade de microhabitats e recursos no ecossistema. Sendo assim, em grandes lagos rasos com heterogeneidade espacial, fatores hidrodinâmicos tendem a ser ainda mais importantes para a distribuição do plâncton. (CARDOSO et al., 2012). Além disso, ecossistemas que muitas vezes são influenciados por variações no nível da água podem mostrar alterações na estrutura do fitoplâncton, que se reflete em condições abióticas, como luz e disponibilidade de nutrientes (CROSSETTI et al., 2007).
Para Naselli-Flores et al. (2003) a perturbação aumenta a conectividade entre as diferentes camadas da mesma massa de água ou entre diferentes ambientes (por exemplo, lagos de várzea, reservatórios em cascata, sistemas alagados) e reabre a competição para diferentes espécies, influenciando a possibilidade da ocorrência de estados de equilíbrio da comunidade fitoplanctônica e a contribuição de diferentes grupos funcionais.
abordagens funcionais já provaram serem capazes de explicar alguma fração da variância observada nos padrões de distribuição espacial e temporal de assembleias de algas, embora a sua eficácia varie muito, dependendo do número de traços e características funcionais utilizados. (SALMASO; NASELLI-FLORES; PADISAK, 2014).
Tendo em vista que a comunidade fitoplanctônica tende a variar em função do tempo e do espaço em grandes lagos rasos, o presente estudo teve por principal objetivo avaliar a influência da heterogeneidade espacial e da escala de tempo na estrutura e dinâmica da comunidade fitoplanctônica em um lago raso subtropical (Lagoa Mangueira, RS). Dessa forma, essa temática foi trabalhada em três artigos.
O 1º artigo intitula-se “Temporal variability determines phytoplankton structure over spatial organization in a large shallow heterogeneous subtropical lake”, onde se buscou compreender o papel da heterogeneidade ambiental na estruturação da comunidade fitoplanctônica, considerando-se a variação no tempo (trimestralmente por dois anos) e no espaço (ao longo de 19 pontos amostrais, por toda a lagoa).
O 2º artigo: “A influência da heterogeneidade espaço-temporal na diversidade funcional do fitoplâncton em lago raso subtropical (Lagoa Mangueira, sul do Brasil))”. Este artigo teve como objetivo analisar a influência da heterogeneidade espaço-temporal na diversidade funcional do fitoplâncton na Lagoa Mangueira.
2 ARTIGO 1
TEMPORAL VARIABILITY DETERMINES PHYTOPLANKTON STRUCTURE OVER SPATIAL ORGANIZATION IN A LARGE SHALLOW HETEROGENEOUS
SUBTROPICAL LAKE
Temporal variability determines phytoplankton structure over spatial organization in a
large shallow heterogeneous subtropical lake
LACINA MARIA FREITAS-TEIXEIRA1,, JULIANA ELISA BOHNENBERGER2, LÚCIA
HELENA RIBEIRO RODRIGUES2, UWE HORST.SCHULZ1, DAVID DA
MOTTA-MARQUES2, LUCIANE OLIVEIRA CROSSETTI3*
1University of Vale do Rio dos Sinos, Av. Unisinos, 950, Cristo Rei, São Leopoldo,
93022-000, RS, Brazil
2Institute of Hydraulic Research, Federal University of Rio Grande do Sul, Post office box
15029, Agronomia, Porto Alegre, 91501-970, RS, Brazil
3Ecology Department, Institute of Biosciences, Federal University of Rio Grande do Sul, Post
office box 15007, Agronomia, 91501-970, Porto Alegre, RS, Brazil, [email protected]
ABSTRACT
Key words: heterogeneity, spatial, temporal, coast region, pelagic region, cyanobacteria.
INTRODUCTION
Biological dynamics, distribution and community structure can be explained by a variety of biotic and abiotic factors related to environmental heterogeneity. Diversity patterns in biological communities can also be explained by environmental heterogeneity (Simpson 1949; MacArthur & MacArthur 1961; Bazzaz 1975). It is hypothesized that more complex habitats promote more microhabitats, favoring different resource exploitation forms and thus increasing the diversity of species (Bazzaz 1975). For example, sites that differ in environmental heterogeneity may have similar species richness, but composition may be unequal due to differing niche requirements for each species (Vasconcelos et al. 2009).
2007), and the structure and dynamics of the phytoplankton community (Crossetti & Bicudo 2008a, 2008b; Fonseca & Bicudo 2010, 2011; Villamagna & Murphy 2010).
Temporally, the occurrence of disorders and seasonal events may further complicate the spatial structure of an ecosystem (Nogueira et al. 1999), especially in tropical and subtropical ecosystems where these temporal changes are highly influenced by precipitation and wind patterns (Berkley et al., 2010).
Regarding phytoplankton, the combination of hydrodynamic processes at different spatial and temporal scales can control the dynamics of the community (Borges et al. 2008; Schneck 2011; Moura et al. 2012), especially in heterogeneous environments where dynamic variations imply changes in the specific composition of algae depending on their surviving strategies (Reynolds 1994; 1997). Studies have indicated the importance of the environmental scenery, the spatial variability of resources and the high temporal variability of the phytoplankton community organization both within reservoirs (Becker et al. 2008; Borges et al. 2008; Schneck et al. 2011) and in shallow lakes (Cardoso et al. 2012; Crossetti et al. 2013; 2014).
lake, which increase the richness and diversity, independent of temporal variations, compared to the pelagic area.
METHODS
Area of study
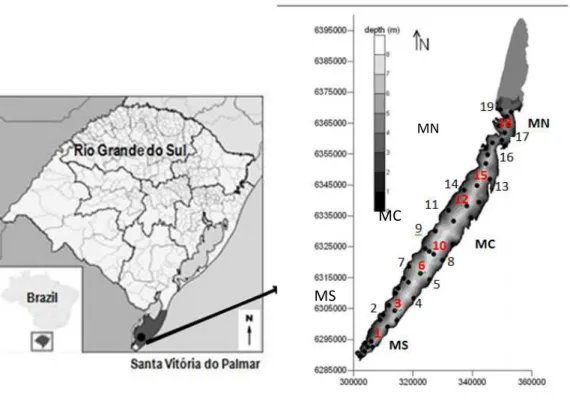
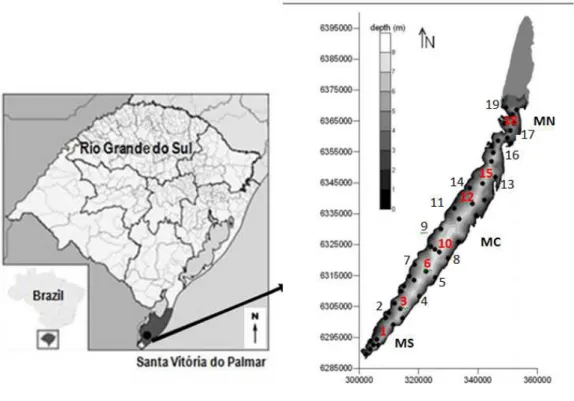
The study was conducted in Lake Mangueira, which is located in the Taim Hydrological System (SHT), in Rio Grande do Sul state, southern Brazil (32°20' and 33°00'S; 52°20' and 52°45'W). The 2.254 km2 area of the system contains the Ecological Station of
Taim (33.935 ha), is situated on a narrow strip of land between the Atlantic Ocean and Mirim Lake and has a subtropical climate (Cfa, Kottek et al. 2006). Lake Mangueira is a large coastal, shallow lake (Zmax =7 m, Zmean = 2.6 m), that is 90 km long and 3-10 km wide (Fig. 1). The lake covers a total area of 820 km2. The main axis of the lake is situated in the
northeast-southwest direction (Fragoso et al. 2008). The system is classified as continuous warm polymictic lake according to Lewis (1983), with daily mixing through heavy winds and rare periods of stratification. The lake is under the influence of the THS wetland on the north and intense bank of macrophytes (Potamogeton illinoensis, Cabomba caroliniana, Egeria densa, Myriophyllum spicatumicatum, Nitella sp., Potamogeton pectinatus, Ceratophyllum demersum, Utricularia sp., Zizaniopsis bonariensis, Schoenoplectus californicus and
Myriophyllum aquaticum) on its margins, especially in the south. The trophic status ranges from oligotrophic to mesotrophic. The mesotrophic conditions occur in spring and summer when the lake undergoes a water withdrawal for rice crop irrigation (approximately 2 L ha-1 s -1 for 100 days), and a high intake of nutrients from its watershed (Fragoso et al. 2008), which
Samplings, Abiotic and Biological Variables
Water samples were collected in plastic pots of 200 ml from the subsurface of
Lake Mangueira from 2010 to 2011, on a seasonal scale (4 samples per year) and 19 points along the length of the ecosystem (including the south, center and north areas of the lake), comprising points in the pelagic (sampling points 1, 3, 6, 10, 12, 15, 18), left (2, 7, 9, 11, 14, 29) and right margin (4, 5, 8, 13, 16, 17) (Fig. 1) regions (Fig.1).
The analyzed nutrients were total phosphorus (TP), soluble reactive phosphorus (SRP), total nitrogen (NT), ammonium (N-NH4+) and nitrate (N-NO3-) (Mackeret et al. 1989);
soluble reactive silica (SRSi); and total suspended solids (TSS) (APHA 1992). Water transparency (determined using a Secchi disk), water temperature, pH, electrical conductivity and dissolved oxygen (determined using a YSI 6920 probe) were also measured. Turbidity was determined using spectrophotometr, (APHA 1992). Carbon forms were evalueted using TOC V equipment (Shimadzu 5000). Humic acids were evalueted using a spectrum-fluorometer (BBE-Moldaenke).
The considered biological variables were the chlorophyll-a (APHA 1992), qualitative analysis of phytoplankton expressed in biomass through biovolume measures using geometric formulas (µg.L -1; Sun & Liu 2003; Hillebrand et al. 1999). The samples were preserved with
1% acetic Lugol for the quantitative analysis following Utermöhl (1958) and the settling time of Lund et al. (1958).
Data Analysis
A descriptive statistical analysis of the environmental and biological variables was executed to explore their variation amplitudes.
A Principal Component Analysis (PCA) was perfomed to assess the primary spatial and temporal trends of abiotic variables by transforming the data by log (x + 1).
A DCA analysis was effectuated to indicate the unimodal or linear ordering method to be used in the integration of biological and abiotic variables (descriptor species). A Redundancy Analysis (RDA) of the transformed (log x + 1) environmental and biological variables was completed after retrieving the result of the DCA to observe their ordination, depending on the spatial and temporal variations. The statistical software PC-ORD, version 15.5 was used for these analyses (McCune & Mefford 2006).
RESULTS
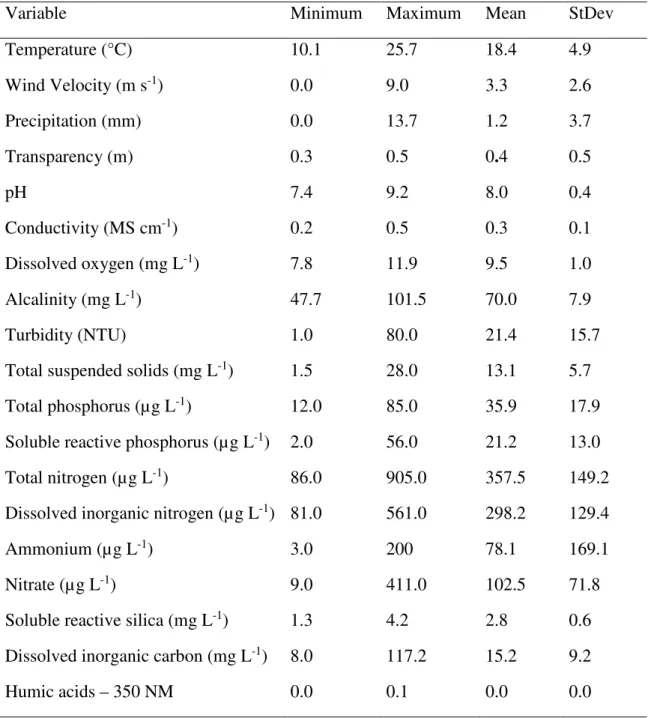
The average, minimum and maximum values of the abiotic variables found in two years of study are shown in Table 1. The northern region of Lake Mangueira showed the highest nutrients quantities, especially reactive soluble phosphorus and nitrate, and the highest values of turbidity and total suspended solids. A north to south spatial gradient of nutrients was observed, where the north showed the highest concentrations of dissolved nutrients and higher values of turbidity and total suspended solids. Temporally, a greater availability of reactive soluble phosphorus and nitrate was verified in summer and spring.
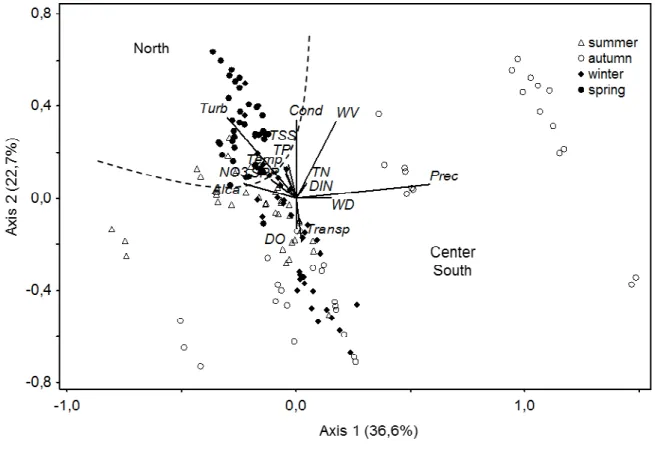
ordination of the first axis (r > 0.6) were turbidity and alkalinity; conductivity, turbidity and wind speed were the main contributors of axis two. The ordination diagram indicated a strong temporal variation, separating the sample units according to seasonality in the years studied. The PCA ordination showed no separation in the pelagic and coastal regions, although the northern part of the lake differentiated spatially from the central and southern regions due to higher values of turbidity, total suspended solids and dissolved nutrients (Fig. 2).
A total of 117 phytoplankton species from all of the analyzed sample units were identified and distributed into 7 algae classes (Bacillariophyceae, Chlorophyceae, Crysophyceae, Dinophyceae, Euglenophyceae and Zygnematophyceae). The Cyanobacteria group had the largest representation, presenting larger relative values of biomass in the southern (89.8%), central (88.3%) and northern (90.0%) areas, on the left and right margins (91.4% and 88.9%, respectively) and in the pelagic region (88.0%) of Lake Mangueira. In contrast, the Euglenophyceae group had the lowest values (< 0.1%).
Although the largest biomass amount (23 mg.L-¹) has been observed in the north of the
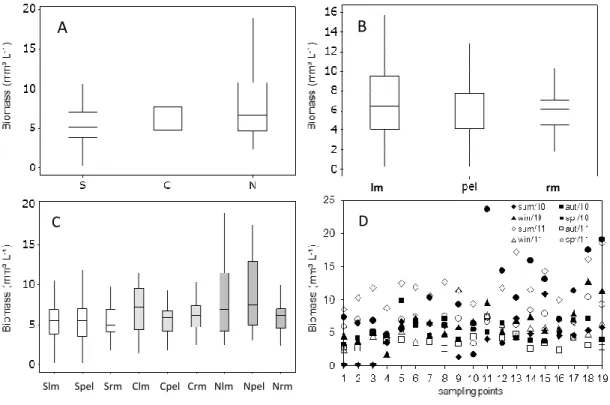
lake, on the left bank, in the spring of 2010, greater total biomass variation amplitudes were observed in the northern region of Lake Mangueira (Fig. 3). Similarly, the region on the left margin showed large amplitudes of variation in biomass values, followed by the pelagic region. A clear increasing biomass gradient was observed from the south to the north in this study.
A diversity of species was higher in the center and southern areas of Lake Mangueira and in all of the sites (banks and pelagic region) compared to those observed in the northern part of the ecosystem. The highest values of diversity were observed in the pelagic zone of the central region and on the right bank of the northern region of the lake (2.60 and 2.52 bits mg) (Fig. 5). The summer of 2011 presented high values of diversity following the same trend observed for the richness of species.
Chlorophyll-a concentrations exhibited a clear increasing spatial gradient in the south to north direction. The northern part of the lake showed markedly higher variation amplitudes of chlorophyll-a following the same trend verified for the total biomass values, with higher values in the pelagic region (9.01 µg.L-¹) (Fig. 6). Temporally, in general, the highest values
were recorded in the summer of 2010.
Sixteeen descriptor species were identified (Table 2) without a clear spatial or seasonal preference, which occurred for all of the sampled points. Most of these species belong to the Cyanobacteria group. Chroococcus limneticus and Aphanocapsa conferta were the species that primarily contributed to the total biomass found in the northern, central and southern regions of Lake Mangueira, regardless of zone (pelagic or margins) or sampling time.
The integrated analysis between the abiotic variables and biomass of the descriptor species was conducted using a RDA and indicated a strong correlation between the matrices considered for both axis 1 (r = 0,84) and axis 2 (r=0,85).
The Monte Carlo test used to evaluate the significance level of the first axis of the analysis indicated that the ordination of axes 1 and 2 was statistically significant (p < 0.01) and did not occur randomly (Fig. 7).
phosphorus (-0.465) were the most importan variables for the second axis. The formation of a guild associated with higher nitrate concentrations and high values of temperature and turbidity was observed in the summer period and was composed of the following species:
Aphanothece stagnina, Chroococcus dispersus, Chroococcus gigantus, Chroococcus limneticus, Coelomeron sp., Gomphosphaeria aponina, Planktolyngbya contorta, Synechocystis aquatilis, Oocystis lacustris and Scenedesmus obtusus. The Aphanocapsa conferta and Aphanothece smithii species were associated with the higher values of reactive soluble phosphorus. The Synedra acus, Aphanothece sp. and Chroococcus planktonicus
species were associated with the higher precipation amounts recorded in autumn. Tetraedron minimum was associated with the highest values of dissolved inorganic nitrogen in the sampling units located on the left margin, especially on the northern part of the lake. Generally, the integrated ordination of the abiotic and biological variables showed strong a temporal organization.
DISCUSSION
dynamic and heterogeneous ecosystems, such as shallow lakes, can offer different conditions and resources in time and space, for different phytoplankton species in the same ecosystem.
Shallow lakes are typically known for their numerous interfaces, especially the coastal regions that are configured into more physically and chemically variable regions (Howard-Williams & Lenton 1975), not only because they are generally inhabited by aquatic macrophytes that modify the environment (Lampert & Sommer 1997; They Hg et al. 2013), but also because they are the region with the highest external contact with other ecosystems and can be influenced by external factors (Crossetti et al 2013.). From the point of view of the interactions between macrophytes and the phytoplankton community in the coastal areas of shallow lakes, many studies found the limitation by shading or competition for nutrients, inhibiting phytoplankton growing (Crossetti & Bicudo 2008a; Fonseca & Bicudo 2010), which tends to establish a clear pattern of heterogeneous distribution of phytoplankton horizontally in shallow lakes (Reynolds 1984). In present study, there were no spatial differences in the structural attributes of the phytoplankton in pelagic and coastal regions, which can be explained by the wide, wind-conditioned water circulation of Lake Mangueira (Cardoso et al. 2012). While classical patterns of negative interactions between macrophytes and planktonic algae were not observed in this study, Lake Mangueira has previously presented a strong gradient of phytoplankton productivity from the coast to the pelagic zones according to Cardoso et al. (2012) suggesting a significant transport of phytoplankton and nutrients through hydrodynamic processes.
the highest values of turbidity and suspended solids. However, the largest concentrations of nitrate and turbudity, as shown by the statistical analysis, were primarily associated with the descriptor species, capable of strategically overcoming the reduced availability of light by utilizing the larger concentration of dissolved nutrients. Historically, Lake Mangueira has low nutrient concentrations, limiting phytoplamkton (Crossetti et al. 2013).
Many processes can explain the higher environmental dissimilarity of the communities over time, such as a result of extinction and colonization events or the different responses of populations to environmental fluctuations (Schneck 2011). In contrast, many studies showed repeated seasonal patterns of phytoplankton specially conditioned by temperature and variations of abiotic parameters in the water (eg Komárková & Tavera 2003; Becker et al. 2009). However, the abiotic scenario is especially susceptible to constant change by recruiting species from the local pool in shalow, aquatic, coastal ecosystems that are strongly influenced of wind, as in the case of Lake Mangueira.This susceptibility would justify the strong temporality in the phytoplankton organization patterns in the studied environment. Many studies have already demonstrated the importance of wind in the dynamics of subtropical, shallow, aquatic ecosystems (CARRICK; ALDRIDGE; SCHELSKE; 1993;. Cardoso et al. 2012), highlighting their
importance for the planktonic communities. According to Reynolds (1994), the level of turbulence is less important in the organization of distinct algal composition in kinetic systems intensively mixed than its spatial extent or temporal permanence.
observed in Lake Mangueira in this study were structured in response to a turbulent environment, with periods and sites of reduced transparency and the ability to survive with limited nutrients, as was the case, for example, for Aphanocapsa conferta, Chroococcus limneticus, Planktolyngbya limnetica, Synechocystis aquatilis, and others. The fact that temporal or spatial differences were not observed among the descriptor indicated that this extensive, shallow lake appears to be a homogeneous environment, possibly conditioned by the highly hydrodynamic regime, as already shown in previous studies (Fragoso, et al. 2008; 2011; Cardoso et al. 2012).
In short, the spatial heterogeneity analyzed from the various sampling points along the length of Lake Mangueira, including the pelagic and coastal regions, did not affect biomass, richness, diversity and biomass of descriptors species. However, the northern section of Lake Mangueira presented higher values of these phytoplankton attributes, especially due to the greater availability of dissolved nutrients, which can be explained by the strong of the contribution of metabolic processes arising from the adjacent wetland (Fragoso et al. 2008). The high degree of temporal variability as a result of the local hydrodynamics reflected in the observed seasonal patterns, where their influence on abiotic water patterns were the main drivers of the phytoplankton community in Lake Mangueira.
ACKNOWLEDGMENTS
REFERENCES
American Public Health Association (APHA) (1992) Standard methods for examination of water and waste water. Byrd Prepress Springfield, Washington.
Barko J. W., Gunnison D. & Carpenter S. R. (1991) Sediment interactions with submersed macrophyte growth and community dynamics. Aquatic Botany41, 41-65.
Bazzaz F. A. (1975) Plant species diversity in old-fi eld successional ecosystems in southern Illinois. Ecology56, 485-488.
Becker V., Huszar V. L. M., Naselli-Flores L. & Padisák J. (2008) Phytoplankton equilibrium phases during thermal stratification in a deep subtropical reservoir. Freshwater Biology 53, 952-963.
Becker V., Huszar V. L. M. & Crossetti L. O. (2009) Responses of phytoplankton functional groups to the mixing regime in a deep subtropical reservoir. Hydrobiologia 628, 137-151.
ZBerkley H. A., Kendall B. E., Mitarai S. & Siegel D. A. (2010) Turbulent dispersal promotes species coexistence. Ecology Letters13, 360–371.
Borges P. A. F., Train S. & Rodrigues L. C. (2008) Spatial and temporal variation of phytoplankton in two subtropical Brazilian reservoirs. Hydrobiologia607 63–74.
Brown B. L. (2007) Habitat heterogeneity and disturbance influence patterns of community temporal variability in a small temperate stream. Hydrobiologia586, 93–106.
Calijuri M. C., Dos Santos A. C. A. & Jati S. (2002) Temporal changes in the phytoplankton community structure in a tropical and eutrophic reservoir (Barra Bonita, SP, Brazil).
Cardoso L. S., Fragoso C. R. J. , Souza R. S. & Motta-Marques D. (2012) Hydrodynamic Control of Plankton Spatial and Temporal Heterogeneity in Subtropical Shallow Lakes,
Hydrodynamics - Natural Water Bodies, Harry Schulz (Ed.), ISBN: 978-953-307-893-9, InTech.
Carrick H. L., Aldridge F. J. & Schelske C. L. (1993) Wind influences phytoplankton biomass and composition in a shallow, productive lake. Limnol. Oceanogr. 38, 1179-1192. Crossetti L. O., Schneck F., Freitas-Teixeira L. M. & Motta-Marques D. (2014) The influence
of environmental variables on spatial and temporal phytoplankton dissimilarity in a large shallow subtropical lake (Lake Mangueira, southern Brazil. Acta Limnologica Brasiliensia26, 111-118.
Crossetti L. O. & Bicudo C. E. M. (2008a) Adaptations in phytoplankton life strategies to imposed change in a shallow urban tropical eutrophic reservoir, Garças Reservoir, over 8 years. Hydrobiologia614, 91-105.
Crossetti L. O., Bicudo D. C., Bicudo C. E. M. & Bini L. M. (2008b) Phytoplankton biodiversity changes in a shallow tropical reservoir during the hypertrophication process. Braz. J. Biol.68, 1061-1068.
Crossetti L. O., Becker V., Cardoso L. S., Rodrigues L. R., Costa L. S., Motta-Marques D. (2013). Is phytoplankton functional classification a suitable tool to investigate spatial heterogeneity in a subtropical shallow lake? Limnologica43, 157–163.
Figueredo C. C. & Giani A. (2001) Seasonal variation in the diversity and species richness of phytoplankton in a tropical eutrophic reservoir. Hydrobiologia 445, 165-174.
Fonseca B. M. & Bicudo C. E. M. (2011) Phytoplankton seasonal and vertical variations in a tropical shallow reservoir with abundant macrophytes (Ninféias Pond, Brazil).
Hydrobiologia665, 229–245.
Fragoso, C. R. J., Motta-Marques, D., Ferreira, T. F., Janse J. H. & van Nes E H. (2011) Potential effects of climate change and eutrophication on a large subtropical shallow lake. Environmental Modelling & Software26, 1337-1348.
Fragoso C. R. J., Motta-Marques D., Collischonn W., Tucci C. E. M. & van Nes E. H. (2008) Modelling spatial heterogeneity of phytoplankton in Lake Mangueira, a large shallow subtropical lake in South Brazil. Ecol. Model. 219, 125–137.
Genkai-Kato M. (2012). Macrophyte refuges, prey behaviour and trophic interactions: consequences for lake water clarity. Ecology Letters10, 105–114.
Gumbricht T. (1993) Nutrient removal processes in freshwater submersed macrophyte systems. Ecological Engineering2, 1-30.
Hillebrand H., Dürseken D., Kirschiel D., Pollingher U. & Zohary T. (1999) Biovolume calculation for pelagic and benthic microalgae. Journal of Phycology35, 403-424. Howard-Williams C. & Lenton G. M. (1975) The role of the littoral zone in the functioning of
a shallow tropical lake ecosystem. Freshwater Biology5, 445-459.
Komárková J. & Tavera R. (2003) Steady state of phytoplankton in a tropical Lake Catemaco (Mexico). Hydrobiologia502, 187-196.
Kottek M., Grieser J., Beck C., Rudolf B. & Rubel F. (2006) World Map of the Köppen-Geiger climate classification updated. Meteorol. Z. 15, 259–263.
Lewis Jr. W. M. (1983) A revised classification of lakes based on mixing. Canadian Journal of Fisheries and Aquatic Science40, 1779-1787.
Lund J. W. G., Kipling C. & LeCren E. D. (1958) The invert microscope method of estimating algal numbers and the statistical basis of estimations by counting.
Hydrobiologia11, 143-170.
MacArthur R. H. & MacArthur J. W. (1961) On bird species diversity. Ecology42, 594-598. Mackeret, F. J. H., Heron, J. & Talling, J. F. (1989) Water analysis: some revised methods for
limnologists. Freshwater Biological Association, Scientific Publication, Ambleside. Madsen J. D., Chambers P. A., James W. F., Koch E. W. & Westlake D. F. (2001) The
interaction between water movement, sediment dynamics and submersed macrophytes.
Hydrobiologia444, 71–84.
McCune B. & Mefford M. J. (2011) PC-ORD. Multivariate Analysis of Ecological Data. Version 6.0 MjM Software. Gleneden Beach, Oregon.
Moura, A. D., Nascimento, E. C. & Dantas E.W. (2012) Temporal and spatial dynamics of phytoplankton near farm fish in eutrophic reservoir in Pernambuco, Brazil. Rev. Biol. Trop.60, 581-597.
Nogueira M. G., Henry R. & Maricatto F. E. (1999) Spatial and temporal heterogeneity in the Jurumirim Reservoir, São Paulo, Brazil. Lakes & Reservoirs: Research and Management 4, 107–120.
Reynolds C. S. (1984) The ecology of freshwater phytoplankton. Cambridge University Press. Cambridge.
Reynolds C. S. (1997) Vegetation in the pelagic: a model for ecosystem theory. In: Kinne, O. (ed.). Excellence in Ecology. Ecology Institute. Germany
Scheffer M. (1998) Ecology of Shallow Lakes. Chapman and Hall. London.
Schneck F., Schwarzbold A., Rodrigues S. C. & Mello A. S. (2011) Environmental variability drives phytoplankton assemblage persistence in a subtropical reservoir. Austral Ecology 36, 839–848.
Shannon C. E. & Weaver W. (1963) The mathematical theory of communication. University of Illinois Press, Urbana.
Simpson E. H. (1949) Measurement of diversity. Nature163, 688.
Sun J. & Liu D. (2003) Geometric models for calculating cell biovolume and surface area for phytoplankton. Journal of Plankton Research25, 1331-1346.
They Ng. H., Motta-Marques D. & Souza R. S. (2013) Lower respiration in the littoral zone of a subtropical shallow lake. Frontiers in Microbiology3, 1-10.
Thomaz S. M., Dibble E. D., Evangelista L. R., Higuti J. & Bini L. M. (2008) Influence of aquatic macrophyte habitat complexity on invertebrate abundance and richness in tropical lagoons. Freshwater Biology53, 358–367.
Ütermöhl H. (1958) Zur Vervolkomnung der quantitative Phytoplankton: Methodik Mitteilung Internationale Vereinigung Theoretische und Angewandte Limnologie9, 1-38.
Vasconcelos T. S., Santos T. G., Rossa-Feres D. C. & Haddad C. F. B. (2011) Spatial and temporal distribution of tadpole assemblages (Amphibia, Anura) in a seasonal dry tropical forest of southeastern Brazil. Hydrobiologia673, 93-104.
Table 1. Mean, standard deviation and minimum and maximum values of the environmental variables sampled in the four seasons (2010 and 2011), at 19 sampling locations in Lake Mangueira (Rio Grande do Sul, Brazil).
Variable Minimum Maximum Mean StDev
Temperature (°C) 10.1 25.7 18.4 4.9
Wind Velocity (m s-1) 0.0 9.0 3.3 2.6
Precipitation (mm) 0.0 13.7 1.2 3.7
Transparency (m) 0.3 0.5 0.4 0.5
pH 7.4 9.2 8.0 0.4
Conductivity (MS cm-1) 0.2 0.5 0.3 0.1
Dissolved oxygen (mg L-1) 7.8 11.9 9.5 1.0
Alcalinity (mg L-1) 47.7 101.5 70.0 7.9
Turbidity (NTU) 1.0 80.0 21.4 15.7
Total suspended solids (mg L-1) 1.5 28.0 13.1 5.7
Total phosphorus (µg L-1) 12.0 85.0 35.9 17.9
Soluble reactive phosphorus (µg L-1) 2.0 56.0 21.2 13.0
Total nitrogen (µg L-1) 86.0 905.0 357.5 149.2
Dissolved inorganic nitrogen (µg L-1) 81.0 561.0 298.2 129.4
Ammonium (µg L-1) 3.0 200 78.1 169.1
Nitrate (µg L-1) 9.0 411.0 102.5 71.8
Soluble reactive silica (mg L-1) 1.3 4.2 2.8 0.6
Dissolved inorganic carbon (mg L-1) 8.0 117.2 15.2 9.2
Table 2. Percentage of descriptor species that contributed at least 1% of the total biomass of Lake Mangueira, Rio Grande do Sul, Brazil.
Legends: S = South, C = Center, North = N, LM= left margin, PEL = pelagic region, RM= right margin, SPR=spring, SUM=summer, AUT=autumn, WIN=winter
Descriptors species S C N LM PEL RM SPR SUM AUT WIN
Cyanobacteria
Aphanocapsa conferta (West & G.S.West) Komárková-Legnerová & Cronberg 28,4 30,9 36,3 38,4 28,9 28,8 35,4 40,0 14,5 30,1
Aphanothece smithii Komárková-Legnerová & G.Cronberg 7,0 6,9 8,2 7,5 7,5 7,3 8,3 6,2 6,1 8,9
Aphanothece sp. 0,5 0,3 0,4 0,3 0,3 0,6 0,0 0,1 2,4 0,0
Aphanothece stagnina (Sprengel) A.Braun 0,5 0,6 0,5 0,5 0,5 0,5 0,1 1,2 0,7 0,1
Chroococcus dispersus (Keissler) Lemmermann 1,3 2,4 1,6 2,1 1,5 1,8 1,7 2,8 1,1 1,0
Chroococcus giganteus West 0,6 0,6 1,0 0,6 0,8 0,8 0,8 1,4 0,2 0,1
Chroococcus limneticus Lemmermann 41,1 35,7 34,4 33,3 38,8 38,7 38,5 21,4 51,4 44,4
Chroococcus planctonicus Bethge 1,6 1,4 0,2 0,9 1,1 1,1 0,7 0,2 3,1 1,2
Coelomeron sp. 0,5 0,5 0,4 0,3 0,5 0,6 0,0 1,2 0,2 0,2
Gomphosphaeria aponina Kützing 0,6 0,9 1,7 0,9 1,0 1,3 0,6 2,9 0,2 0,1
Planktolyngbya contorta (Lemmermann) Anagnostidis & Komárek 1,3 1,6 0,9 1,0 1,4 1,3 1,3 1,5 0,9 0,9
Synechocystis aquatilis Sauvageau 3,5 3,5 3,3 3,3 3,5 3,6 2,2 3,0 5,1 4,6
Chlorophyceae
Oocystis lacustris Chodat 0,7 2,2 2,6 1,7 2,1 1,7 1,8 4,2 0,1 0,1
Scenedesmus obtusus Meyen 1,2 2,0 0,9 0,6 2,1 1,3 0,9 3,4 0,3 0,2
Tetraëdron minimum (A.Braun) Hansgirg 2,9 2,6 2,5 2,5 2,6 2,9 1,9 1,7 4,1 4,0
Bacillariophyceae
1,0 0,3 0,5 0,5 0,7 0,5 0,3 0,1 2,4 0,2
Fragilaria acus (Kützing) Lange-Bertalot
Figure 1. Map of Lake Mangueira, comprising the northern (MN), central (MC) and southern (MS) regions, highlighting the 19 sampling points throughout the extent of the ecosystem in the pelagic area (red points: 1, 3, 6, 10, 12, 15, 18) and coastal (black dots): left margin (2, 7, 9 , 11, 14, 19) and right margin (4, 5, 8, 13, 16, 17).
MN
MC
Figure 2. Ordination by PCA (axes 1 and 2) of the sample units according to the abiotic variables in Lake Mangueira during the period of study. Legends: Turb = turbidity, Cond = conductivity, TSS = dissolved suspended solids, TP = total phosphorus, Temp = temperature, NO3 = nitrate, TN = total nitrogen, SRP = reactive soluble phosphorus, DIN = dissolved
Figure 3. Biomass (mm³.L-1) along the temporal and spatial gradient of Lake Mangueira (19
points). Legends: S = south (n=56), C = center (n=48) and North = N (n=48), lm = left margin (n=48), pel = pelagic region (n=56), rm = right margin (n=48), Sme = south left margin(n=16), Spel = south pelagic region (n=24), Smd = southern right margin (n=16), Clm = center left margin (n=16) Cpel = center pelagic region (n=16), Crm = center right margin (n = 16), Nlm = north left margin (n=16), Npel = north pelagic region (n=16), Nrm = north right margin (n=16).
lm rm
Slm Spel Srm Clm Cpel Crm Nlm Npel Nrm
A B
Figure 4. Richness (number of taxa) along the spatial and temporal gradient of Lake Mangueira (19 points). See Figure 3 for the legend of abiotics variables.
Slm Spel Srm Clm Cpel Crm Nlm Npel Nrm
A B
Figure 5. Diversity (bits.mm-³) along spatial and temporal gradient of Lake Mangueira (19
points). See Figure 3 for the legend of abiotic variables.
Slm Spel Srm Clm Cpel Crm Nlm Npel Nrm
A B
Figure 6. Chlorophyll-a (µg.L-1) along the spatial gradient of Lake Mangueira (19 points).
See Figure 3 for the legend of abiotic variables.
Slm Spel Srm Clm Cpel Crm Nlm Npel Nrm
A B
V
Sacu Acon Apsp Asmi Asta Cdis Cgig Clim Cpla Cosp Gapo Pcon Saqu Olac Sobt Tmin Temp Alca Turb PT SRP DIN NO3 DIC WV Prec
-10 -6 -2 2
-4 0 4 8 summer autumn winter spring
(p1 = 0,005)
( p2 = 0 ,0 0 5 ) North Sacu Acon Apsp Asmi Asta Cdis Cgig Clim Cpla Cosp Gapo Pcon Saqu Olac Sobt Tmin Temp Alca Turb PT SRP DIN NO3 DIC WV Prec
-10 -6 -2 2
-4 0 4 8 summer autumn winter spring
(p1 = 0,005)
( p2 = 0 ,0 0 5 ) North
Figure 7. Ranking by RDA (axes 1 and 2) of descriptor species according to abiotic variables in Lake Mangueira during the period of study. Legend of abiotic variables: Turb = turbidity, Cond = conductivity, TSS = dissolved suspended solids, TP = total phosphorus, Temp = temperature, NO3 = nitrate, TN = total nitrogen, SRP = reactive soluble phosphorus, DIN =
dissolved inorganic nitrogen, Alca = alkalinity, Transp = transparency, DO = dissolved oxygen, Prec = precipitation, WD = wind direction, WV = wind speed. Legends of the descriptor species: Sacu = Synedra acus, Acon = Aphanocapsaconferta, Apsp = Aphanothece
sp., Asmi = Aphanothece smithii, Asta = Aphanothece stagnina, Dcis = Chroococcus dispersus, Cgig = Chroococcus gigantus, Clim = Chroococcus limneticus, Cpla =
Chroococcus planktonicus, Cosp. = Coelomeron sp., Gapo = Gomphosphaeria aponina, Pcon = Planktolyngbya contorta, Saqu = Synechocystis aquatilis, Olac = Oocystis lacustris, Sobt =
3 ARTIGO 2
A INFLUÊNCIA DA HETEROGENEIDADE ESPAÇO-TEMPORAL NA ABORDAGEM FUNCIONAL DO FITOPLÂNCTON EM LAGO RASO
A INFLUÊNCIA DA HETEROGENEIDADE ESPAÇO-TEMPORAL NA ABORDAGEM FUNCIONAL DO FITOPLÂNCTON EM LAGO RASO
SUBTROPICAL (LAGOA MANGUEIRA, SUL DO BRASIL)
Lacina Maria Freitas-Teixeira1
Juliana Elisa Bohnenberger2
Uwe Horst Schulz3
David da Motta-Marques4
Luciane Oliveira Crossetti5
Resumo: A classificação de organismos em grupos a partir de seus atributos é essencial para a descrição de comunidades. Este trabalho teve como objetivo analisar a influência da heterogeneidade espaço-temporal na estrutura funcional da comunidade fitoplanctônica em um extenso lago raso subtropical. Foram realizadas amostragens durante as quatro estações, nos anos de 2010 e 2011, em 19 pontos amostrais superficiais em toda extensão da lagoa Mangueira, nas regiões litorânea Sul, Pelágica (centro) e litorânea Norte. Foram analisadas variáveis físico-químicas,atributos da estrutura de tamanho do fitoplâncton e grupos funcionais como medidas de diversidade funcional. Os resultados demonstraram que não houve organização espacial considerando-se as formas de vida e a estrutura de tamanho da comunidade fitoplanctônica. Os grupos funcionais responderam à variação nos recursos, especialmente na primavera e no verão, segregando o norte da lagoa, demonstrando serem mais adequados à predição da composição das comunidades em função das variações ambientais.
Palavras-chave: Heterogeneidade. Tamanho. Volume celular. Máxima dimensão linear. Grupo funcional.
1 INTRODUÇÃO
Abordagens baseadas em traços funcionais são cada vez mais utilizadas na área da ecologia (LITCHMAN; KLAUSMEIER, 2008) e, uma vez aplicadas em ecologia de
1 Doutoranda em Biologia, pelo Curso de Pós-Graduação em Biologia Programa de Pós-Graduação em Biologia,
Universidade do Vale do Rio dos Sinos, Av. Unisinos, 950, Cristo Rei, 93022-000. São Leopoldo, RS, Brasil. E-mail: [email protected]
2 Doutoranda em Recursos Hídricos e Saneamento Ambiental, pelo Instituto de Pesquisas Hidráulicas -
IPH/UFRGS, Universidade Federal do Rio Grande do Sul, Caixa Postal 15029, Agronomia, 91501-970. Porto Alegre, RS, Brasil. E-mail: [email protected]
3 Professor Pós Doutor do Programa de Pós-Graduação em Biologia, Universidade do Vale do Rio dos Sinos,
Av. Unisinos, 950, Cristo Rei, 93022-000. São Leopoldo, RS, Brasil. E-mail: [email protected]
4 Professor Doutor do Programa de Pós-Graduação em Recursos Hídricos e Saneamento Ambiental, pelo
Instituto de Pesquisas Hidráulicas - IPH/UFRGS, Universidade Federal do Rio Grande do Sul, Caixa Postal 15029, Agronomia, 91501-970. Porto Alegre, RS, Brasil. E-mail: [email protected]
5 Professora Pós Doutora do Programa de Pós-Graduação em Ecologia, Instituto de Biociências, Universidade
comunidades, têm levado a um considerável avanço no entendimento dos efeitos dos filtros ambientais na organização das espécies. (JUNG et al., 2010).
Diversidade funcional é a amplitude e distribuição de valores de traços funcionais nas comunidades. (LAVOREL et al., 2008). Em sua mais simples definição, um traço é um substituto do desempenho do organismo (VIOLLE et al., 2007), mas traço funcional pode também ser definido como características morfofisiofenolológicas que impactam no fitness
indiretamente através de seus impactos no crescimento, reprodução e sobrevivência, que são os três componentes da performance do indivíduo. (VIOLLE et al., 2007).
Interpretar a diversidade funcional da vegetação é importante para revelar as relações entre mudanças ambientais, composição da comunidade e processos ecosssistêmicos (LAVOREL et al., 2008). A classificação de organismos em grupos a partir de seus atributos é essencial para a descrição de comunidades. Atualmente, tem sido cada vez mais explorado o uso de atributos e ou tipos funcionais para o melhor entendimento da estrutura e dinâmica das comunidades e suas relações com processos ecossistêmicos especialmente considerando-se plantas terrestres. (CORNELISSEN et al., 2003; DÍAZ; CABIDO, 2001; LAVOREL; GARNIER, 2002; LAVOREL et al., 1997; LOUAULT et al., 2005).
Considerando-se a vegetação pelágica, muitas tentativas em classificar o fitoplâncton a partir de características funcionais têm sido feitas. (CROSSETTI; BICUDO, 2008a; KRUK et al., 2011; LITCHMAN; KLAUSMEIER, 2008; MARGALEF, 1978; REYNOLDS, 1980, 1997; REYNOLDS et al., 2002; SALMASO; PADISÁK, 2007). O fitoplâncton consiste um sistema ideal para testar as abordagens baseadas em traços funcionais devido à sua simplicidade e atributos muito bem definidos que determinam seu nicho ecológico. (LITCHMAN; KLAUSMEIER, 2008).
Dentre as abordagens mais utilizadas, o sistema de agrupamentos funcionais de Reynolds (REYNOLDS et al., 2002) é um dos mais aceitos e utilizados (PADISÁK; CROSSETTI; NASELLI-FLORES, 2009), e apresenta vantagens em relação à classificação filogenética tradicional, visto que reúne os organismos com base em suas sensibilidades e tolerâncias às condições ambientais. (SALMASO; PADISÁK, 2007).
as variáveis mais importantes na determinação do fitoplâncton local. (MARGALEF, 1978; REYNOLDS, 2006). Além disso, ecossistemas que muitas vezes são influenciados por variações no nível de água podem mostrar alterações na estrutura do fitoplâncton, que se reflete em condições abióticas, como luz e disponibilidade de nutrientes. (CROSSETTI et al., 2007). A distribuição desigual de recursos, como luz e nutrientes, em ambientes espacialmente heterogêneos têm sido relacionados com a diversidade funcional fitoplanctônica. (CAPUTO et al., 2008; CROSSETTI et al., 2014; NOGUEIRA; HENRY; MARICATTO, 1999; RYCHTECKÝ; ZNACHOR, 2011).
Abordagens a partir de atributos funcionais corroboram o potencial preditivo da comunidade fitoplanctônica, e têm sido extensivamente validado em comunidades pelágicas de clima temperado (BECKER et al., 2010; HUSZAR; KRUK; CARACO, 2003; LEITÃO et al., 2003), tropical (COSTA; HUSZAR; OVALLE, 2009; CROSSETTI; BICUDO, 2008a; GEMELGO; MUCCI; NAVAS-PEREIRA, 2009; LOPES; BICUDO; FERRAGUT, 2005; SARMENTO et al., 2007;) e subtropical. (BECKER; CARDOSO; HUSZAR, 2009; BONILLA et al., 2005; FABBRO; DUIVENVOORDEN, 2000; KRUK et al., 2002).
Nesse sentido, foram utilizadas diferentes abordagens funcionais e morfológicas com o objetivo de avaliar a influência da heterogeneidade espaço-temporal na diversidade funcional da comunidade fitoplanctônica em um lago raso subtropical heterogêneo.
Hipotetiza-se que haverá uma alta diversidade funcional expressa pelas categorias de tamanho, máxima dimensão linear e grupos funcionais fitoplanctônicos acompanhado a heterogeneidade ambiental no ecossistema estudado.
2 MATERIAIS E MÉTODOS
O estudo foi realizado na Lagoa Mangueira situada no Sistema Hidrológico do Taim (SHT), RS. Foram coletadas amostras da subsuperfície da água, em 19 pontos ao longo de toda a extensão da lagoa, nas regiões pelágicas e litorâneas, no Sul, Centro e Norte, nos meses de verão, outono, inverno e primavera nos anos de 2010 e 2011. Foram efetuadas análises das variáveis abióticas e das variáveis bióticas do fitoplâncton.
2.1 Área de Estudo
é 2.254 km2, contendo a Estação Ecológica do Taim (33.935 ha), e está situada em uma
estreita faixa de terra entre o Oceano Atlântico e a Lagoa Mirim. A região tem um clima subtropical (tipo Cfa ); (KOTTEK et al., 2006). A Lagoa Mangueira é um grande lago raso costeiro com 90 km de comprimento e 3-10 km de largura (Figura 1), com profundidade média de 2,6 m e máxima de 7 m. (CARDOSO et al., 2012; CROSSETTI et al., 2007). Abrange uma área total de 820 km2. O sistema é classificado como polimíctico quente
segundo Lewis (1983), com misturas diárias devido à ação dos ventos que ressuspende constantemente o sedimento na coluna d´água, afetando diretamente a comunidade planctônica. (RODRIGUES, 2009). O eixo principal do lago é nordeste-sudoeste, alinhado com os ventos predominantes. (FRAGOSO JÚNIOR et al., 2008).
Figura 1 – Mapa da Lagoa Mangueira, com as regiões sul (MS), centro (MC) e norte (MN), destacando-se os 19 pontos de amostragem ao longo de toda a extensão do ecossistema, na região pelágica (pontos em vermelho: 1, 3, 6, 10, 12, 15, 18) e litorânea: margem esquerda (2, 7, 9, 11, 14, 19) e margem direita (4, 5, 8, 13, 16, 17).
O sul e o norte da lagoa caracterizam-se pela presença de um extenso banco de macrófitas nas suas margens, (Potamogeton illinoensis Morong, Cabomba caroliniana A. Gray, Egeria densa Planch, Myriophyllum spicatumicatum L., Nitella sp. C. Agardh,
bonariensis Bal. & Poitr, Schoenoplectus californicus (C.A. Mey), Soják e Myriophyllum aquaticum (Vell.) Verdc).
As condições mesotróficas acontecem na primavera e no verão, quando há um maior consumo de água (CROSSETTI et al., 2013). Para o Sistema Hidrológico do Taim como um todo, o consumo de água na época de irrigação das lavouras de arroz pode atingir o valor de 100m3.s-1 (MOTTA MARQUES; VILLANUEVA, 2000), sendo que o ecossistema mais
afetado devido ao intenso bombeamento de água (estruturas com capacidade individual de até 11 m3 .s-1) é a Lagoa Mangueira, em cujo entorno existem grandes extensões de lavouras, principalmente à oeste. A manutenção da alta produtividade dessa cultura requer a permanência de uma lâmina d’água sobre o plantio por um período de aproximadamente 100 dias. (MOTTA MARQUES et al., 2002). A retirada de água aliada às perdas por evaporação provocam a diminuição drástica dos níveis da água, determinando seu hidroperíodo, composto por períodos de seca (geralmente na primavera e verão) e cheia (geralmente no outono e inverno).
2.2 Amostragens
Amostras de água da subsuperfície foram coletadas em 2010 e 2011, em escala sazonal (4 amostragens por ano), em 19 pontos ao longo de toda a extensão do ecossistema, compreendendo pontos nas regiões pelágica (pontos 1, 3, 6, 10, 12, 15, 18) e litorânea na margem esquerda (2, 7, 9, 11, 14, 29) e margem direita (4, 5, 8, 13, 16, 17) (Figura 1).
2.3 Variáveis Abióticas
Foram analisados os nutrientes (fósforo total - PT, fósforo reativo solúvel - SRP, nitrogênio total – NT, amônio-N-NH4+ e N-NO3- (MACKERET; HERON; TALLING, 1989);
2.4 Variáveis Biológicas
Para a análise quantitativa da comunidade fitoplanctônica as amostras foram fixadas com solução de lugol acético a 1%. A quantificação do fitoplâncton seguiu a metodologia descrita em Utermöhl (1958) e o tempo de sedimentação Lund et al. (1958). A biomassa (mg.L-¹) foi expressa através de medidas de biovolume calculado para cada espécie tomando como base sólidos geométricos que mais se aproximassem da forma celular, isolados ou combinados, segundo Sun e Liu (2003), Hillebrand et al. (1999), dentre outros, a partir de valores médios das medidas de 20 a 30 indivíduos, quando possível.
A estrutura funcional da comunidade fitoplanctônica foi acessada através da abordagem de grupos funcionais e atributos funcionais referentes à estrutura de tamanho e forma de vida. Assim, as espécies fitoplanctônicas, neste estudo, foram classificadas em grupos funcionais de acordo com a abordagem de Reynolds et al. (2002) e revisado por Padisák, Crossetti e Naselli-Flores (2009). Desta forma, a classificação foi baseada em seu hábito ou forma de vida (UF = unicelular flagelado, CF = colonial flagelado, UNF = unicelular não flagelado, CNF = colonial não flagelado, incluindo cenóbios e FI = filamentoso) em sua estrutura de tamanho, avaliada pela maior dimensão linear axial (MDL) organizada nas seguintes classes: classe I (< 10 µm), classe II (entre 11 e 20 µm), classe III (entre 21 e 50 µm) e classe IV (> 50 µm) e em seu volume celular (µm3), representado pelas classes: classe I (< 10 µm3), classe II (entre 102 e 103 µm3), classe III (entre 103 e 104µm3) e classe IV (> 104µm3).
2.5 Análise dos Dados
Análises estatísticas descritivas das variáveis ambientais e biológicas foram realizadas para exploração da amplitude de variação das mesmas.
3 RESULTADOS
Os valores médios, mínimos e máximos das variáveis abióticas encontrados nos dois anos de estudos constam nas tabelas 1, 2 e 3. Não foi observada diferença entre os padrões observados para as variáveis abióticas considerando-se as zonas marginais e pelágica da Lagoa Mangueira (Tabela 1). Contudo, considerando-se o sul, centro e norte, maiores valores de turbidez, fósforo solúvel reativo e nitrogênio total foram verificados no norte da lagoa (Tabela 2). Temporalmente, foram registrados valores limitantes ao crescimento fitoplanctônico de nitrato e amônio em todas as estações do ano, embora os valores médios de nitrogênio inorgânico dissolvido tenham sido elevados (Tabela 3).
Tabela 1 - Valores mínimos (min), máximos (max), média (med) e desvio-padrão (dp) das varáveis ambientais amostradas na margem esquerda (n=48), zona pelágica (n=56) e margem direita (n=48) na Lagoa Mangueira.
margem esquerda pelágica margem direita
Variáveis min max med dp min max med dp min max med dp Temperatura ° C 10,1 25,7 18,6 5 10,4 25,4 18,4 4,9 10,5 24,9 18,4 4,8 Tranparência (m) 0,3 2,7 1,5 0,7 0,4 2,7 1,1 0,5 0,4 2,4 1,1 0,5
pH 7,4 9 8 0,5 7,4 9,2 8 0,4 7,4 9,1 8 0,5
Condutividade (µS cm -1) 0,2 0,5 0,3 0,1 0,3 0,5 0,3 0,1 0,3 0,5 0,3 0,1
Oxigênio dissolvido (mg L-1) 7,8 11,7 9,5 0,9 7,8 11,9 9,5 1 8 11,8 9,5 0,9
Alcalinidade (mg L -1) 47,7 101,5 69 9,2 57,8 84,4 70,2 7 57,3 85,8 70,8 7,4
Turbidez (NTU) 1 80 22,5 16,5 3 59 20,6 15,4 4 55 21,4 15,4 Sólidos suaspensos totais (mg L-1) 1,5 28 13,3 5,7 3 25,5 13,2 5,4 2 28 12,7 6,3
Fósforo total (ug L -1) 14 82 35 18 12 82 36 19 16 85 37 17
Fósforo solúvel reativo (μg L -1) 2 56 21 13 7 55 20 12 7 54 23 14
Nitrogênio total (µg L -1) 110 598 360 145 105 722 352 152 86 905 361 154
Nitrogênio înorgânico dissolvido (µg L -1) 98 512 304 136 81 551 292 132 95 561 300 122
Amônia (µg L -1) 8 264 62 63 3 200 95 64 10 301 75 66
Nitrato (µg L -1) 10 411 107 80 10 294 97 69 9 300 104 68 Sílica solúvel reativa (mg L-1 ) 1,3 4,2 2,8 0,7 1,5 4,2 2,9 0,6 1,6 4,2 2,8 0,6
Carbono inorgânico dissolvido (mg L-1 ) 9,4 23,3 14,5 3,9 9,4 24 14,6 3,8 8 117,2 16,5 15,4
Ácidos húmicos - 350 nm 0 0 0 0 0 0 0 0 0 0,1 0 0
Direção do vento (°) 0 32 13,6 7,5 0 32 13,4 7,1 0 36 13,6 7,8 Velocidade do vento (m s-1 ) 0 9 3,4 2,6 0 9 3,4 2,6 0 9 3,4 2,6
Tabela 2 – Valores mínimos (min), máximos (max), média (med) e desvio-padrão (dp) das variáveis ambientais amostradas na região sul (n=56), centro (n=48) e norte (n=48) na Lagoa Mangueira.
Sul Centro Norte
Variáveis min max med dp min max med dp min max med dp
Temperatura ° C
10,
1 24,6 17,8 5 11 25,1 18,6 4,9 11,8 25,7 19 4,8 Tranparência (m) 0,6 2,7 1,3 0,5 0,3 2,4 1 0,4 0,4 2,4 1,1 0,5
pH 7,4 8,9 8 0,4 7,4 9,1 8 0,5 7,4 9,2 8 0,5
Condutividade (µS cm -1) 0,3 0,5 0,3 0,1 0,3 0,5 0,3 0,1 0,2 0,5 0,3 0,1
Oxigênio dissolvido (mg L-1) 7,8 11,8 9,3 1,1 8,1 11,8 9,5 1 8 11,9 9,6 0,8
Alcalinidade (mg L -1)
47,
7 84,7 69,1 8,2 58,4 84,4 70 6,4 58,6 101,5 71,1 8,8 Turbidez (NTU) 3 39 17,8 14,3 6 52 22 14,3 1 80 25,1 17,7 Sólidos suaspensos totais (mg L-1) 4 28 13 5,9 5 25 13,2 5,2 1,5 27,5 13 6,1
Fósforo total (ug L -1) 12 85 31 20 15 81 36 17 14 75 42 15
Fósforo solúvel reativo (μg L -1) 7 56 19 14 2 52 20 11 9 55 25 13
Nitrogênio total (µg L -1) 110 561 345 132 105 563 349 132 86 905 380 182
Nitrogênio înorgânico dissolvido (µg L -1) 98 551 294 126 81 561 297 130 95 524 304 136
Amônia (µg L -1) 10 2000 107 269 3 235 58 54 8 277 64 54
Nitrato (µg L -1) 10 294 96 66 10 325 107 73 9 411 105 78 Sílica solúvel reativa (mg L-1 ) 1 4 3 1 2 4 3 1 1 4 3 1
Carbono inorgânico dissolvido (mg L-1 ) 9,4 26,9 14,8 4,1 8 117,2 16,1 15,4 9,6 24 14,6 3
Ácidos húmicos - 350 nm 0 0 0,1 0 0 0 0 0 0 0 0 0
Direção do vento (°) 5 18 12,4 4,6 0 36 13 8,2 5 3,2 15,4 8,9 Velocidade do vento (m s-1 ) 1 9 2,8 2,5 0 8 3,1 2,5 1 8 4,2 2,7
Tabela 3 - Valores mínimos (min), máximos (max), média (med) e desvio-padrão (dp) das variáveis ambientais amostradas na primavera (n=38), verão (n=38), outono (n=38) e inverno (n=38) na Lagoa Mangueira.
Va ri á vei s min max med dp min ma x med dp min ma x med dp mi n max med dp
Tempera tura ° C 20 24,7 22,3 0,9 13,5 18,5 16,6 1,5 10 13,2 11,6 0,8 21 26 23,4 1,4
Tranpa rência (m) 0,7 2,1 1,1 0,4 0,6 2,4 1,2 0,4 0,3 4,7 2,4 0,7 0,5 1,6 0,9 0,3
pH 7,4 9,2 8,4 0,5 7,4 8,3 7,9 0,2 7,4 8 7,6 0,2 7,4 8,6 8 0,3
Conduti vidade (µS cm -1) 0,2 0,4 0,3 0 0,3 0,4 0,3 0,1 0,3 0,3 0,3 0 0,3 0,5 0,4 0,1
Oxi gênio di s s ol vi do (mg L-1) 8,6 9,9 9,1 0,4 8,8 10 9,6 0,3 10 11,9 10,7 0,8 7,8 9 8,5 0,4 Al ca li ni da de (mg L -1) 60 84,7 72,1 10,4 57,3 70,2 64,5 3,5 48 74,8 68,8 5,9 69 101 74,6 4,2
Turbi dez (NTU) 5 55 24,1 12,6 1 17 8,2 3,6 3 41 15,5 9,6 18 80 38 15
Sól i dos s us pens os tota i s (mg L-1) 7,5 23 12,9 3,5 1,5 25,5 11,5 6,6 5 28 14,8 6,8 2 28 13 5,2
Fós foro tota l (ug L -1) 17 53 34 9 12 48 26 9 13 81 35 17 15 85 50 23
Fós foro s ol úvel rea ti vo (μg L -1) 7 38 17 8 2 45 18 8 8 37 18 8 9 56 32 18
Ni trogênio total (µg L -1) 161 722 370 126 110 543 325 134 206 905 394 167 86 617 340 162 Ni trogênio înorgâ ni co di s s ol vido (µg L -1) 125 561 312 118 95 512 284 118 140 513 303 138 81 524 294 146
Amôni a (µg L -1) 9 129 44 31 10 2000 84 320 3 230 75 56 11 348 110 90
Ni trato (µg L -1) 10 325 127 96 9 73 40 21 14 192 117 33 36 411 125 70
Síli ca s ol úvel reati va (mg L-1 ) 2,7 2,5 3,1 0,3 1,7 3,3 2,8 0,4 1,3 2,8 2,2 0,4 2,4 4,2 3,3 0,7 Carbono i norgâni co di s s ol vi do (mg L-1 ) 8,9 16,9 13 1,8 9,4 15,5 13,1 1,3 8 117 17,9 17 8,9 23 16,7 5,6
Áci dos húmi cos - 350 nm 0 0 0 0 0 0 0 0 0 0,1 0 0 0 0 0 0
Di reção do vento (°) 0 32 17,3 8,3 0 36 14,5 9,2 5 18 12,3 4,7 5 14 10 4,1
Veloci da de do vento (m s-1 ) 0 2 1,3 0,7 0 9 4,5 3,3 1 8 2,8 1,8 2 8 4,7 2,2
Preci pi ta ção (mm) 0 0 0 0 0 13,7 4,7 6,2 0 0,1 0 0 0 0 0 0
Profundidade (m) 0,9 5,3 2,6 1,3 0,8 6,3 2,6 1,5 1,2 6,8 3 1,5 1,1 1,7 3,2 1,6
Pri mavera Verão Outono Inverno
Fonte: Elaborada pela autora.
No inverno foram verificadas maiores concentrações de fósforo total, fósforo solúvel reativo e maior turbidez. No verão foram observados os menores valores de turbidez na Lagoa Mangueira (Tabela 3).