Procedia Engineering 147 ( 2016 ) 2 – 6
1877-7058 © 2016 The Authors. Published by Elsevier Ltd. This is an open access article under the CC BY-NC-ND license (http://creativecommons.org/licenses/by-nc-nd/4.0/).
Peer-review under responsibility of the organizing committee of ISEA 2016 doi: 10.1016/j.proeng.2016.06.180
ScienceDirect
* Corresponding author. Tel.: +65-6219-6213; fax: +65-6896-9260. E-mail address: [email protected]
11th conference of the International Sports Engineering Association, ISEA 2016
Analysis of the Aerodynamics by Experimental Testing of an Elite
Wheelchair Sprinter
Tiago M. Barbosa
a,b,c*, Pedro Forte
c,d, Jorge E. Estrela
b,c, Eduarda Coelho
c,eaNanyang Technologic University, 637616 Singapore, Singapore bPolytechnic Institute of Braganca, 5300 Braganca, Portugal
cResearch Centre in Sports, Health and Human Development, 5001 Vila Real, Portugal dUnivesity of Beira Interior, 6200 Covilha, Portugal
eUnivesity of Tras-os-Montes and Alto Douro, 5001 Vila Real, Portugal
Abstract
The aim was to compare the resistive forces acting upon an European wheelchair medallist. The coast-down technique was selected to estimate the resistance in the upright position and racing positions with the neck in hyperextension and flexion, respectively. In the upright position, racing position with the neck in flexion and hyperextension the effective surface area was 0.1747, 0.1482 and 0.1456m2, respectively. The coefficient of rolling friction was 0.00119, 0.00489, 0.00618 and the power to overcome drag 26.62, 22.59, 22.19W for the same positions. As a conclusion, the resistance acting upon the sprinter is different according to his position on the chair. Slight changes in the head position over the race can affect by almost 2% the power output.
© 2016 The Authors. Published by Elsevier Ltd.
Peer-review under responsibility of the organizing committee of ISEA 2016 Keywords: Sprinting; Race time; Kinetics; Aerodynamics; Power
1. Introduction
Despite not as popular as Olympic sports, Paralympic events have become very competitive in the last few decades. One of the highlights in the Paralympics Games, and other multi-sport events, are the wheelchair races in Athletics. As for the all-body counterparts, the support by sport science and technology are now quite common among Paralympic athletes. As far as wheelchair sprinting concern, the performance is strongly speed-dependent [1]:
m
E
v
2
kin (1)Where v is the wheelchair velocity, Ekin the kinetic energy and m the mass. The wheelchair-athlete system has an overall efficiency lower than 1.0. So, the kinetic energy of an athlete-wheelchair system is:
loss in
kin
E
E
E
(2)© 2016 The Authors. Published by Elsevier Ltd. This is an open access article under the CC BY-NC-ND license (http://creativecommons.org/licenses/by-nc-nd/4.0/).
Where Ekin is the kinetic energy, Ein the energy delivered by the athlete and Eloss the energy lost by the system. Therefore, combining equations 1 and 2:
m
E
E
v
2
in loss(3)
The rolling friction and the drag force are the main sources of losing energy [2]. The total resistance encompasses the sum of both external forces. To excel wheelchair racers should consider diminishing as much as possible the total resistance [3]. Hence, the total resistance acting on the athlete is the sum of drag and rolling friction. Depending on the pace, rolling friction may account up to 65-75% and drag 35-25% of total resistance in world-ranked wheelchair racers [3]. Over a stroke cycle, the athlete can assume an upright position or a racing position keeping the torso flexed. One concern for the athletes is the head’s alignment in the racing position. The advice is keeping the neck in hyperextension so that the helmet is properly aligned to the body. However, over an event often the athlete performs neck flexions, disrupting the body alignment. This misalignment may increase significantly the resistance acting upon the athlete just like in cycling [4], albeit, evidence on this is scarce in wheelchair racing. A feasible way to gather insight on the effects of the body position in the rolling friction and the drag force is the cost-down technique [4]. Indeed, this is an experimental testing procedure reported on regular basis in motor sports and cycling [4], besides other wheeled vehicles. Follow-up estimations can be run to compute the mechanical power and energy expenditure over an official race inputting the resistive forces obtained beforehand [4].
The aim was to compare the resistive forces acting upon an elite wheelchair racer, keeping different body positions. It was hypothesized that even slight changes in the body position would have an effect on the sprinter’s aerodynamics and rolling friction.
2. Methods
2.1. Sample
The subject was a male wheelchair sprinter with 43.0kg of mass, competing in the T52 category. He holds the national records at the 100m and 400m events, being also an European medallist at the 100m event and at the time of this research ranked 2nd in the world. All procedures carried out in this research are in accordance to the Declaration of Helsinki.
2.2. Procedures
The wheelchair sprinter was invited to perform 3 sets of 8 repetitions at different speeds, randomly assigned. He was advised to perform one lap on the track per repetition. By the end of the last curve, before the finish line, he should stop performing stroke cycles and keep the position coasting-down.
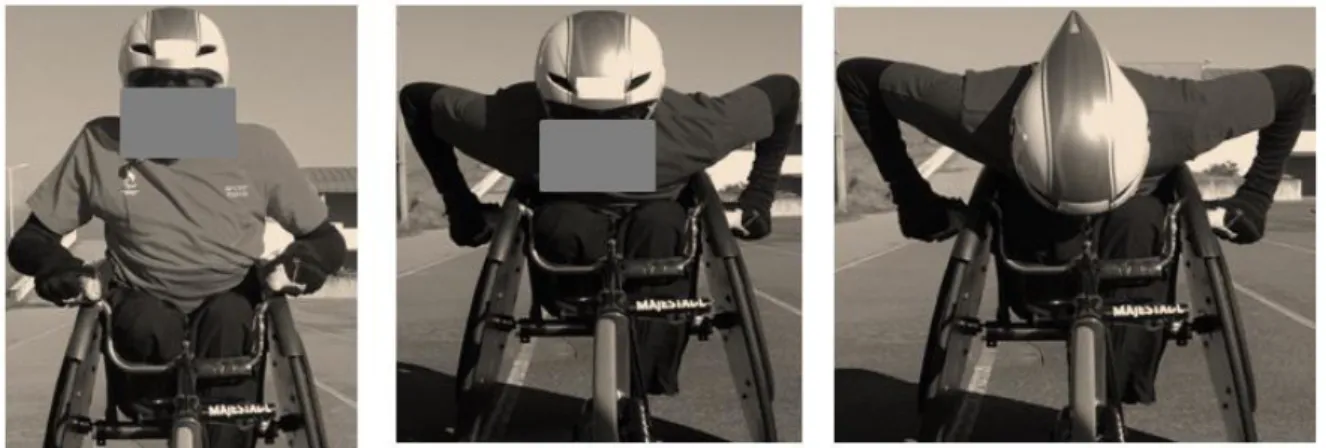
The 3 sets were performed keeping the: (i) torso in the upright position on the wheelchair; (ii) torso in the racing position (i.e. trunk bended in the horizontal position) and neck in hyperextension (so that the trailing edge of the helmet would be pointing backwards); (iii) racing position but the neck in flexion (i.e. trailing edge of the helmet pointing upwards) (fig 1.)
2.3. Resistive forces
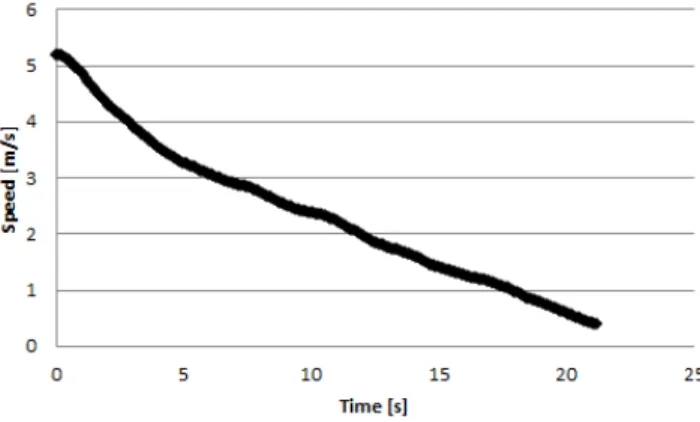
The coast-down technique was selected as experimental procedure to estimate the resistance. The speed decay (f=33Hz) was measured by Doppler-effect (Stalker Pro, Stalker Radar, Texas, USA) in the straight line before the finish line, during the coasting-down (fig 2.).
Surface area of the racer plus chair was measured by a photogrammetric technique [5]. The athlete was photographed by a digital camera (DSC-T7, Sony, Tokyo, Japan) in the frontal plane. He was seated on the wheelchair in one of the three position selected for this research. He was wearing the race suit and his competition helmet. The surface area was measured by an area measuring software (Udruler, AVPSoft, USA) after importing the digital picture.
Fig. 2. The speed-time plot coasting-down over one trial.
Resistive forces were estimated in accordance to what was reported as a simplified deceleration method [4]. In short, for a
wheeled vehicle moving on level ground, equation of motion can be derived from Newton’s second law:
2
2 1
x v Cd A g
m CR dt dv m
F x
x
¦
U
(4)Where Fx is the external mechanical force in the horizontal component, m the mass, vx the horizontal velocity, t the time, CR
the rolling coefficient, g the gravitational acceleration,ρ the air density, A the surface area and Cd the drag coefficient. One assumption by this method is that ACd and CR are not determined by the velocity. Equation 4 can be simplified to:
2
x v dt
dvx
D
E
(5)Hence, being respectively,
CR g
D
(6)m Cd A 2
U
E
(7)Follow-up procedures reported for this method have also been carried out whenever appropriate [4]. Resistive forces were calculated from non-linear least-squares fitting of the raw data. Thereafter it was computed the effective surface area (ACd) and coefficient of rolling friction (CR) through interactions minimizing the sum squared errors.
2.4. Mechanical energy and power
The power to overcome drag was calculated at the pace of his national record in the 400m event:
x v Fd
Where Pd is the power to overcome drag, Fd the drag force (Fd=1/2.ρ.A.Cd.v2) and vx the horizontal velocity (6.298 m/s). It
is assumed that the gross efficiency in elite wheelchair racer is 18% [6]. The power output (i.e. energy expenditure per unit of time), the energy cost (i.e., energy expenditure per unit of distance) and external mechanical power delivered over the entire race can be then estimated [4]:
K
U
32
/ A Cd v
v g m CR
Ptot (9)
K
U 2
2
/ ACd v
g m CR
C (10)
3
2
/ A Cd v
v g m CR
Pext U (11)
Where Ptot is the total power, CR the rolling coefficient, m the body mass of the wheelchair-sprinter system, g the gravitational acceleration, v the mean velocity over the race, ρ the air density, A the surface area and Cd the drag coefficient, C the energy cost, Pext the external mechanical power, η the gross efficiency.
3. Results
Table 1 reports the resistance acting upon the elite wheelchair sprinter adopting different body positions on the chair. The CR was 0.00119, 0.00489 and 0.00618 for the upright position, helmet pointing upwards and backwards, respectively.
The ACd in the upright position, racing position with helmet pointing upwards and backwards was 0.1747, 0.1482 and 0.1456m2 , respectively. Therefore, aerodynamics is higher in the upright than racing positions; albeit between the latter ones, the neck flexion pointing the trailing edge of the helmet upwards imposes the higher resistance.
Table 1. Comparison of coefficient of rolling friction (CR) and effective surface area (ACd) of an elite wheelchair sprinter in difference positions. Upright position Racing position with neck in flexion Racing position with neck in
hyperextension
CR [dimensionless] 0.0019 0.00489 0.00618
ACd [m2] 0.1747 0.1482 0.1456
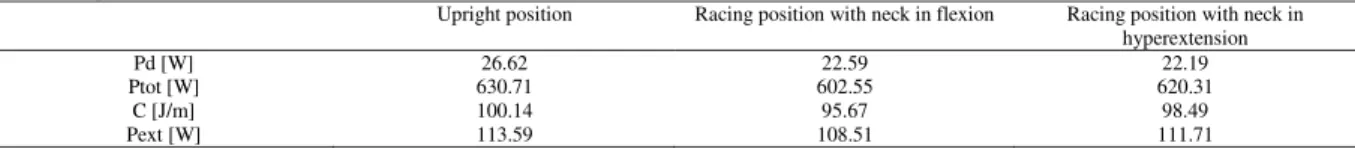
Table 2 provides the estimations of mechanical power and energy. The Pd was 26.62, 22.59 and 22.19W for the same positions, as well. This makes that in comparison to the racing position with helmet pointing backwards the power delivered was 1.75% higher having the trailing edge pointing upwards and 16.64% in the upright position.
The Ptot, C and Pext are estimations of the power and energy that might have been delivered over the 400m race when the sprinter broke his national record. On the event of keeping the upright position, the energy and power would have been higher than a racing position. Regarding the head alignment in the racing position, trivial changes can be found.
Altogether, different body positions have an impact on the resistance applied to a world-ranked wheelchair racer. Small shifts in the head position affect the drag force and therefore the power to overcome drag. A misalignment by the head can account at least 2% more in the power delivered.
Table 2. Comparison of power to overcome drag (Pd), power output (Ptot), energy cost (C) and externa mechanical power (Pext) of an elite wheelchair sprinter in difference positions.
Upright position Racing position with neck in flexion Racing position with neck in hyperextension
Pd [W] 26.62 22.59 22.19
Ptot [W] 630.71 602.55 620.31
C [J/m] 100.14 95.67 98.49
Pext [W] 113.59 108.51 111.71
4. Discussion
The aim was to compare the resistance acting upon an elite wheelchair sprinter keeping different body positions. It was verified that the resistance was different according to his position on the chair.
linoleum) [9]. Indeed, our data shows a good agreement with the results of the racing wheelchair on the linoleum. The upright position might affect the CR and hence the interaction between tires (notably the front one) with the surface, leading to a decrease of this coefficient in comparison to racing positions.
The ACd was prone to be lower in our elite sprinter than in comparison to literature. Most of the papers selected conventional wheelchairs being the subject in the upright position, exposing a higher surface area and hence ACd. When racing wheelchairs were used, yet our results are lower. E.g., Hoffman et al. [9] noted an ACd of 0.37m2 while we observed almost half of this value. This can be due to: (i) the chair used in this research is a cutting-edge piece of machinery designed to minimize the drag; (ii) our subject is a professional sprinter that is able to optimize his position on the chair; (iii) his anthropometrical features (being relatively small and light) can also help to explain the findings. As expected, the ACd is higher in the upright than any of the racing positions. Between these two, having the neck flexed will make the trailing edge of the helmet pointing upwards, disrupting a proper alignment with the subject’s body.
A comprehensive insight on the effect of the resistive forces over an official race can be obtained computing the power and energy delivered. Because the CR and ACd are not speed-dependent, it is possible to estimate the rolling friction, drag forces and ultimately estimate the mechanical power as well as the energy. Once more, benchmarking our results with literature, the subject delivered a lower Pd. Others have reported a Pd ranging from approximately 10W (at roughly 1.2 m/s) to 80W (at 5.5 m/s). Our sprinter raced the 400m event in 6.928 m/s when he broke the national record, delivering an estimated Pd of 22 to 26W, depending on the body position. Comparing the Pd across different postures and having the racing position with the helmet pointing backwards as base line or reference, the power was 1.75% higher keeping the trailing edge pointing upwards and 16.64% in the upright position. I.e., it should be noted that small changes in the head position can affect by almost 2% the aerodynamics. This has a significant effect on the performance in short-distance races that performances are timed up to 0.01s. In the event of keeping the upright position, the Ptot, C and Pext would have been higher in the upright than the racing position. Interestingly, the Ptot is similar to what was reported in cycling at similar paces by the same analytical approach [4]. Based on these findings, practitioners including coaches and sports scientists should develop an evidence-based practice featuring the testing of the resistance acting upon wheelchair sprinters on regular basis. In comparison to other procedures reported in the literature, coast-down techniques are affordable, less time-consuming and straightforward ways to gather such details. As far as resistance goes, this experimental procedure provides useful information on the athlete’s technique and should be part of a holistic battery tests monitoring wheelchair racers. Some of the data collected in a testing session because it is not speed-dependent (e.g. CR and ACd) can be input into analytical models to learn the sprinter’s biomechanics over an official race or to set a given target-time on the road to a major competition (e.g. Paralympic Games).
It can be addressed a few limitations to this study. The resistance verified by this elite sprinter may not be representative of counterparts with other competitive levels. It would be interesting to perform concurrently the assessment by numerical simulations (i.e. computer fluid dynamics) and/or other analytical procedures and/or other experimental tests (e.g. wind tunnel testing).
5. Conclusions
As a conclusion, the resistance acting upon the sprinter is different according to his position on the chair. Slight changes in the head position over the race can affect by almost 2% the power output. So, athletes should beware of this, keeping a good body alignment at all times.
References
[1] Fuss FK, Subic A. Sport Wheelchair technologies. In: Fuss FK, Subic A, Stragwood M, editors. Routledge Handbook of Sports Technology and Engineering. Oxon: Routledge; 2014. p. 156-68.
[2] Fuss FK. Influence of mass on the speed of wheelchair racing. Sports Engineering 2009; 12: 41-53.
[3] Barbosa TM, Forte P, Morais JE, Coelho E. Partial contribution of rolling friction and drag force to total resistance of an elite wheelchair athlete. Proceedings of the 1st International Conference in Sports Science & Technology. Singapore: Institute of Sports Research 2014. p. 749-53
[4] Candau RB, Grappe FR, Ménard MA, Barbier BR, Millet GY, Hoffman MD, Belli AR, Rouillon JD. Simplified deceleration method for assessment of resistive forces in cycling. Med Sci Sports Exerc 1999;31:1441-7.
[5] Morais JE, Costa MJ, Mejias EJ, Marinho DA, Silva AJ, Barbosa TM. Morphometric study for estimation and validation of trunk transverse surface area to assess human drag force in water. J Hum Kinetics 2011;28:5-13.
[6] Cooper RA, Boninger ML, Cooper R, Robertson RN, Baldini FD. Wheelchair racing efficiency. Disability and rehabilitation. 2003 1;25:207-12 [7] Chua JJ, Fuss FK, Subic A. Rolling friction of a rugby wheelchair. Procedia Eng 2010 Jun 30;2(2):3071-6
[8] Sauret C, Bascou J, de Saint Rémy N, Pillet H, Vaslin P, Lavaste F. Assessment of field rolling resistance of manual wheelchairs. J Rehab Res Development 2012;49(1):63-74