37
PERMEABILITY OF POLYMERIC MICROFILTRATION AND
ULTRAFILTRATION MEMBRANES USED IN THE TREATMENT OF
EFFLUENTS
PERMEABILIDADE DE MEMBRANAS POLIMÉRICAS DE MICROFILTRAÇÃO E ULTRAFILTRAÇÃO UTILIZADAS NO TRATAMENTO DE EFLUENTES
Devanir André Fappi, Juliana Bortoli Rodrigues Mees, Luiz Alberto Viera Sarmento, Eliane Rodrigues dos Santos Gomes
Federal Technological University of Paraná - UTFPR; Medianeira Campus, Brazil Avenue, 4232 Zip Code 85884-000 - Post Office Box 271 - Medianeira - PR – Brazil; General Phone +55 (45) 3240-8000 Fax Number +55 (45) 3240-8101; E-mails: [email protected]; [email protected]; [email protected];
ABSTRACT
The membrane separation processes are in full expansion, being used in numerous industrial segments, presenting several advantages when compared with the conventional separation processes. Membrane separation process may be influenced by the properties of the membrane’s constituting material, in addition to the power supply features, may influence the separation process. The purpose of this study is to characterize these membranes in terms of their permeability, monitoring the reduction of permeated flow caused by compression, obstruction, resistance to the mass flow due to concentration polarization and reversibility of the conditions after the compression of membranes (hysteresis). The results indicate that, in regards to the the compression of membranes (hysteresis) caused by pressure differentials applied to the microfiltration and ultrafiltration membranes using distilled water, there was no significant reduction of flow, with no influence of the following factors: concentration polarization, incrustation and clogging of pores, which is the opposite result, when compared with the use of wastewater samples. When the same operating conditions are employed, a significant difference occurs in the permeate flows using samples of distilled water and effluents.
Keywords: Hysteresis. Compression; Pressurization. Depressurization. Membrane Separation Processes. RESUMO
Os processos de separação por membranas estão em franca expansão, sendo utilizados em inúmeros segmentos industriais, apresentando diversas vantagens quando comparados com os processos de separação convencionais. Entretanto, as propriedades do material que compõem a membrana, além das características da corrente de alimentação podem influenciar o processo de separação. Deste modo, o objetivo deste trabalho foi caracterizar as membranas com relação às suas permeabilidades, monitorando a redução do fluxo permeado provocado pela compactação, pelo entupimento, resistência ao fluxo de massa devido à polarização de concentração e reversibilidade das condições após a compactação (histerese) das membranas. Os resultados indicam que, com relação ao comportamento quanto à compactação (histerese) provocada pelos diferenciais de pressão aplicados às membranas de microfiltração e ultrafiltração, utilizando água destilada, estas praticamente não tiveram redução de fluxo, indicando ausência da influência dos fatores: polarização da concentração, incrustração e entupimento de poros, resultado antagônico ao verificado quando utilizou-se amostras de efluentes. O fluxo de água destilada aumenta linearmente com o aumento da pressão aplicada a membrana para ambas as membranas avaliadas, ou seja, quanto maior a pressão aplicada a membrana, maior o fluxo permeado. Quando emprega-se as mesmas condições operacionais, ocorre uma diferença significativa nos fluxos permeados utilizando amostras de água destilada e efluentes.
Palavras-chave: Histerese. Compactação; Pressurização. Despressurização. Processos de Separação por
38 1. INTRODUCTION
Membrane separation processes are very recent technologies. Growing at significant speed, these processes have been applied in several industries, such as chemistry, pharmaceutical, food, beverages, mineral/metallurgical, petrochemical and, currently, in the treatment of wastewater.
The membrane filtration technology might replace some conventional separation processes, widely used in scale, especially because of the advantages it shows when compared with the conventional processes: they are more efficient, they are considered cleaner technologies, they occupy a smaller area and operate under low pressures and, additionally, there is a high level of flexibility in the process. However, there are some disadvantages, such as incrustation and wear of the membranes (SONI et al., 2009; LEE et al., 2011; PADAKI et al., 2015).
Membrane filtration technology is a process conducted under pressure, based on the separation of components from molar masses and specific forms, and in the interactions between the components and the membrane’s surface. When this irregular barrier is placed between two phases, the existing driving force results in the division of the feeding flow into solvent flow (permeated or filtered) and solute (concentrate/retentate). This driving force may originate in the difference of concentration, pressure, electrical potential and temperature. In operations conducted with the application of pressure differentials, such as classic filtration, microfiltration and ultrafiltration, the separation of particles and macromolecules occurs because of its dimensions or average molar masses. At nano-filtration and reverse osmosis, on the other hand, molecules with small molar masses are separated, also because of a solution-diffusion mechanism in the membrane’s material. The separation is determined particularly by the diffusivity and the solubility of the molecules of the membrane’s permeant material (SONI et al., 2009; PADAKI et al., 2015). However, in every case, there is always an interaction between the membrane’s material and the solute.
Certain characteristics must be analyzed in membrane separation processes. Two of them are the affinity between the elements present in the feeding solution and the membrane, which may interfere in the filtration, causing a certain selection of compounds, and the affinity between the membrane’s polymer and the feeding’s composition, which may cause alterations in the polymer’s chain, interfering in the performance of the membrane separation processes (GUO and CHUNG, 2005; SARMENTO, 2007; TRINDADE, 2010).
Guo and Chung (2005), Sarmento (2007) and Anderson et al. (2010) highlight that certain alterations in the membrane lead to irreversible changes due to the rearrangement of the polymer’s chain, distorting the density of the chain and the interstitial space. Consequently, the distention of the membrane in preliminary operations may affect the free volume and, thus, the distribution of the dense-selective layer, inducing the resistance to transportation and the efficiency of separation for further operations. Therefore, the behavior of a membrane is verified not only through the morphological structure and the material that constitutes the membrane, but is also related to the operational conditions and the possibility of interactions between the feeding components and the membrane’s primary structure.
Still, Trindade (2010) clarifies that the measurement of the permeated flow in porous membranes may be used to estimate the size of these membranes’ pores, where the transportation mechanism is the convective capillary flow, and each pore is assimilated to a capillary and the sum of all outflows provides the total flow. The membrane’s permeability with water is extremely important to its characterization because it allows the assessment of its superficial porosity and substructure, providing data about the hydrophilic and/or hydrophobic properties.
Anderson et al. (2010) and Lee et al. (2011), define hysteresis as the difference observed between the forces applied for the increase in trans-membrane pressure and, next, for its decrease. These phenomena is known as pressurization and depressurization.
39 Guo and Chung (2005), elucidate that three factors play significant roles in the hysteresis behavior: the interactions between the membrane’s molecules, the dense-selective layer and the feeding solution.
According to Lee et al. (2011), the evaluation of the membrane’s hysteresis may be an appropriate tool to characterize and evaluate the membrane’s obstruction phenomena.
Thus, the purpose of this study is to characterize the membranes in regards to their permeability both with distilled water and samples of wastewater from a pig slaughterhouse, monitoring the reduction of permeated flow caused by compression, obstruction, resistance to the mass flow due to concentration polarization or the reversibility of the conditions after compression of membranes (hysteresis).
2. MATERIAL AND METHODS
2.1. Description of the Sampling Location
The effluents sampling was conducted at a pig slaughterhouse located in the city of Medianeira, in the extreme west of the southern state of Paraná.
According to the data provided by the industry under study, approximately 6.000 pigs consume an average of 750 liters of water per pig and generate approximately 4.500 cubic meters of liquid waste every day. In addition, the industry employs around 5.000 workers, who consume approximately 70 liters per capita (BRAILE, 1993), contributing to the production of 350 cubic meters of sewage on a single day. After treatment, this sewage follows to the effluent treatment system, totalizing approximately 4.850 cubic meters of wastewater generated every day. The water volume that was used originated from a tube well (92%), a mountains slope (7%) and a concessionaire (1%).
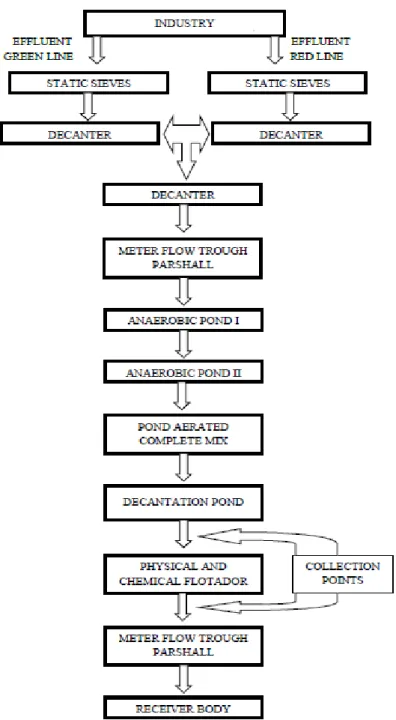
At the pig slaughterhouse under study, the effluents generated by the industrial process are separated in two different lines: a) green: effluents resulting from the reception of animals, the washing of trucks and entrails, and b) red: effluents resulting from the slaughter, meat and gut processing, boning and rendering.
After the industrial processing, the resulting wastewater is treated, each one at its particular line, with static sieves, followed by primary treatment, with decanters. Next, the lines are merged, following to the secondary stage (biological treatment), performed in serial stabilization ponds (two anaerobic ponds, one complete mix aerated pond and one settling basin). There is an additional post-treatment stage with a physical-chemical floater using an organic coagulant and cationic polymer to remove the remaining organic load.
Figure 1 illustrates the flowchart of the industry’s effluent treatment system.
2.2. Collection and Preservation of effluent samples
The samples were collected according to the Brazilian norm NBR 9898/1987 (sampling preservation and techniques for liquid effluents and recipients). The sampling locations were the settling basin (after secondary treatment) and the physical-chemical floater (after tertiary treatment), as shown in Figure 1.
40
Figure 1 – Flowchart of the industry’s effluent treatment system
2.3. Experimental Unit
2.3.1. Properties of the Microfiltration and Ultrafiltration Membranes
The microfiltration and ultrafiltration membranes have a low incrustation and a high flow, as they allow a superficial filtration with the exclusion by molecular size. The typical properties of the microfiltration and ultrafiltration used in this study can be seen in Table 1.
41
Table 1 – Properties of the microfiltration membrane
Identification MF 128 UF 162
Geometry Cylindrical with hollow fiber Cylindrical with hollow fiber
Material Polyetherimide (PEI) Polyethersulfone (PES)
Selective Layer External External
External Diameter (mm) 25 25
Molar Retention (MWCO - KDa) - 50
Pore Size (µm) 0.40 - Useful length (mm) 260 260 Packaging (m2.m-3) 650 650 Filtration Area (x10-3 m2) 59 59 Permeability (L h-1 m-2 Bar-1) 204.83 150.7 pH Limits 2 – 13 2 – 13
Source: PAM Membranas, 2012.
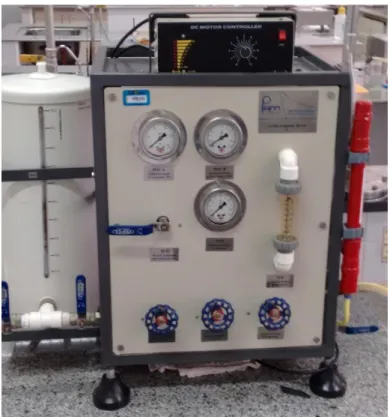
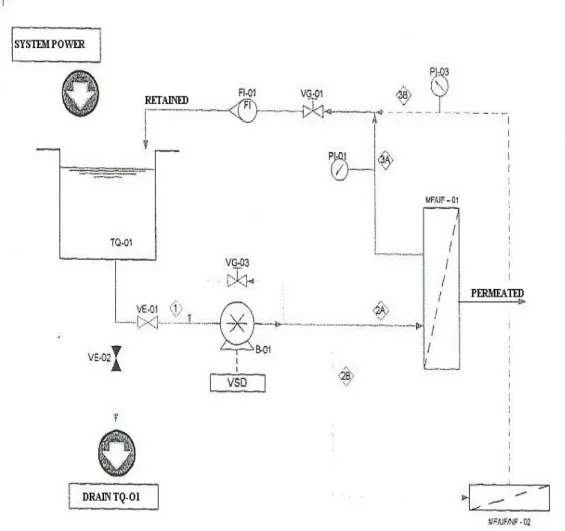
2.3.2. Membrane Filtration Module
Figure 2 shows a picture of the microfiltration and ultrafiltration bed system, and Figure 3 presents a representative scheme of the experimental unit, showing the main equipment used: pump, valves, tanks, flowmeter, membranes, etc.
42
Figure 3 – Representative scheme of the experimental unit showing the main equipment
(TQ-01: PP tank – 10 L; B-01: diaphragm pump, 150 psi (10 bar max.); MF/UF-01: hollow fiber membrane module for micro or ultrafiltration; MF/UF/NF-02: micro, ultra and nano-filtration flat membrane cell (stainless steel); 01 and PI-02: pressure indicators (0 – 5 bar); PI-03: pressure indicator (0 – 15 bar); FI-01: flow rate indicator (0.8 – 8 LPM); FI-PI-02:
Flow rate indicator (10 mL); VE: ball valve (brass ½’’); VG: gate valve (bronze ½”)).
The following procedure was used to operate the membrane filtration module (PAM MEMBRANAS, 2012):
1. Check if all the valves are closed;
2. Completely open the VE-01 feeding valve at the TQ-01 tank’s output to the system; 3. Completely open the VE-03 valve, for the permeated output;
4. Completely open the VG-01 valves, for concentrate pressure control and, in the case of micro or ultrafiltration, the VG-02 valve, for control of the permeated content;
5. Completely close the VG-03 by-pass valve at B-01 pump; 6. Turn on the B-01 pump, at minimum capacity;
7. Micro or ultrafiltration: control the pressure difference between the concentrate (read on PI-01) and permeated (read on PI-02), as well as the concentrate output (read on FI-PI-01), through; VG-01 gate valve (when closed, increased pressure on PI-01 and decreased output on FI-01); VG-02 gate valve (when closed, increased pressure on PI-02);
VG-03 gate valve (when open, decreased pressure on PI-01);
Or through the pump’s potentiometer (more speed caused pressure increase on 01 and PI-02);
43 In some cases, the combination of these controls was necessary to refine the control and stabilize the pressure gauge’s indicator (PI-01 and PI-02). The difference between the values of PI-01 and PI-02 corresponded to the different pressure applied to the membrane.
2.3.3. Control of the Permeated Flow
The permeated flow with distilled water in the clean membrane, at room temperature, was monitored as the parameter in order to guarantee that the membrane was always clean after each filtration rehearsal.
The trans-membrane pressure differentials applied in the tests to characterize the membranes with distilled water were 0.5; 0.75; 1.0; 1.25; 1.50 and 1.75 bar and the corresponding flow of distilled water, for each pressure variation, was measured until a steady value was reached.
The characterization rehearsals measured the permeability of the membranes for distilled water during a pressure increase from 0.5 to 1.75 bars, during the reduction of this pressure from 1.75 to 0.5 bar and, lastly, the permeability of the membrane with effluent samples.
The volumes of distilled water and effluents permeated were determined by flow measurement at the flow meter. These measurements were repeated until a stationary flow through the membranes was reached, which lasted approximately 1 hour for distilled water and around 100 minutes for effluent samples, for each pressure variation applied. The measurements for both the characterization of the membrane with distilled water and the effluent were performed every 5 minutes. At this experimental stage, the behavior of membranes in regards to their mechanical resistance to several pressure differentials was tested, in addition to the hysteresis by pressurization and depressurization of the system. These experiments were performed during a period of 11 hours in order to verify the flow stabilization with distilled water and effluent samples as well.
The incrustation was evaluated through the assessment of the profile of permeated flow of effluent in relationship to the permeated flow of distilled water for the new membrane.
3. RESULTS AND DISCUSSION
3.1. Permeability of the Membranes with Distilled Water
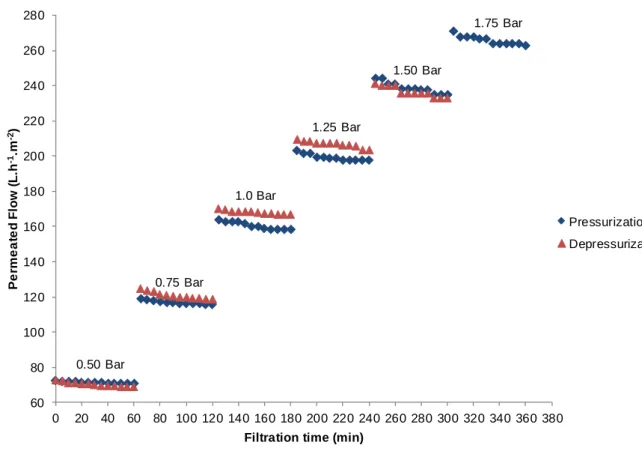
The rehearsals used to assess the permeability of the microfiltration and ultrafiltration membranes with distilled water were performed at room temperature, for both pressurization and depressurization. The trans-membrane pressure differential was adjusted from 0.5 to 1.75 bar (pressurization) in intervals of 0.25 bar and, next, reduced once again to 0.5 bar (depressurization). The flow of distilled water was measured for approximately 60 minutes for each pressure variation until a steady value was reached, with no replacement of membranes.
Figures 4 and 5 illustrate the results obtained with the variation of distilled water flow through the microfiltration and ultrafiltration membranes, with filtration time for each pressure variation, for both pressurization and depressurization.
According to Sarmento (2007) and Anderson et al. (2010), the gradual increase in pressure, followed by its reduction, allows the assessment of the hysteresis and/or compression that may influence the membrane’s behavior in regards to the mass flow and selectivity.
44
Figure 4 – Behavior of the permeated flow with distilled water in relation to the pressure differential applied over time at pressurization and depressurization of the microfiltration membrane.
Figure 5 - Behavior of the permeated flow with distilled water in relation to the pressure differential applied over time at pressurization and depressurization of the ultrafiltration membrane.
60 80 100 120 140 160 180 200 220 240 260 280 0 20 40 60 80 100 120 140 160 180 200 220 240 260 280 300 320 340 360 380 P e rm e a te d Fl ow ( L. h -1.m -2)
Filtration time (min)
Pressurization Depressurization 0.75 Bar 1.0 Bar 1.25 Bar 1.50 Bar 1.75 Bar 0.50 Bar 20 40 60 80 100 120 140 160 180 200 220 0 20 40 60 80 100 120 140 160 180 200 220 240 260 280 300 320 340 360 380 P e rm e a te d Fl ow ( L. h -1.m -2)
Filtration time (min)
Pressurization Depressurization 0.75 Bar 1.0 Bar 1.25 Bar 1.50 Bar 1.75 Bar 0.50 Bar
45 The results indicate that both microfiltration and ultrafiltration membranes had no significant reduction of flow, showing that there was no influence of the following factors: clogging of pores, incrustation and concentration polarization. In addition, for both membranes evaluated, the hysteresis phenomenon for the permeated flow was small, indicating good reversibility, evidencing, still, the increase of permeated flow at depressurization of microfiltration and ultrafiltration membranes. This small increase may indicate a small alteration in the structure of the polymer due to the output.
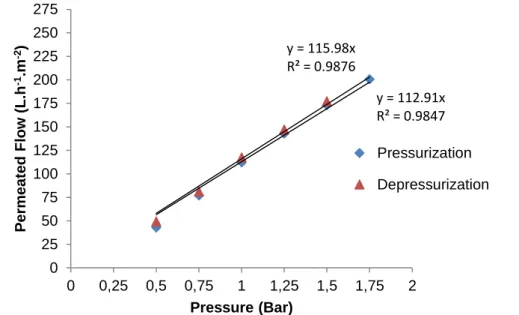
Figures 6 and 7 illustrate the results for permeability and the variation of the distilled water’s stationary flow according to the variation of pressure differential (pressurization and depressurization) applied on the membranes.
Initially, the linear variation of the permeated flow at the membrane’s pressurization is noteworthy. The results also show an increase of the permeability at the membrane’s reversibility to the initial condition (depressurization).
Figure 6 – Behavior of the stationary permeated flow of distilled water in relationship to the pressure differential applied during the pressurization and depressurization of the microfiltration membrane
Figure 7 - Behavior of the stationary permeated flow of distilled water in relationship to the pressure differential applied during the pressurization and depressurization of the ultrafiltration membrane
y = 154.37x R² = 0.9951 y = 159.04x R² = 0.9866 0 25 50 75 100 125 150 175 200 225 250 275 0 0,25 0,5 0,75 1 1,25 1,5 1,75 2 P er m ea ted F low ( L .h -1.m -2) Pressure (Bar) Pressurization Depressurization y = 112.91x R² = 0.9847 y = 115.98x R² = 0.9876 0 25 50 75 100 125 150 175 200 225 250 275 0 0,25 0,5 0,75 1 1,25 1,5 1,75 2 P er meat ed F low ( L .h -1.m -2) Pressure (Bar) Pressurization Depressurization
46 Comparing the permeability values found during these microfiltration and ultrafiltration rehearsals with the values presented in the installation, operation and maintenance manual of the membrane’s module, according to Table 1, the permeability values found are slightly lower, but close to the values recommended in the literature. It is worth to mention that the permeability tests in the manual used water that was previously submitted to microfiltration. In regards to the permeability rehearsals performed, distilled water was used.
3.2. Permeability of the Membranes with Effluent Samples
Similarly to the previous permeability stage with distilled water, the membranes were evaluated with effluent samples based on the same factors, collected after the secondary treatment (settling basin) and after the tertiary treatment (physical-chemical floater), with the purpose of examining the influence on the membranes.
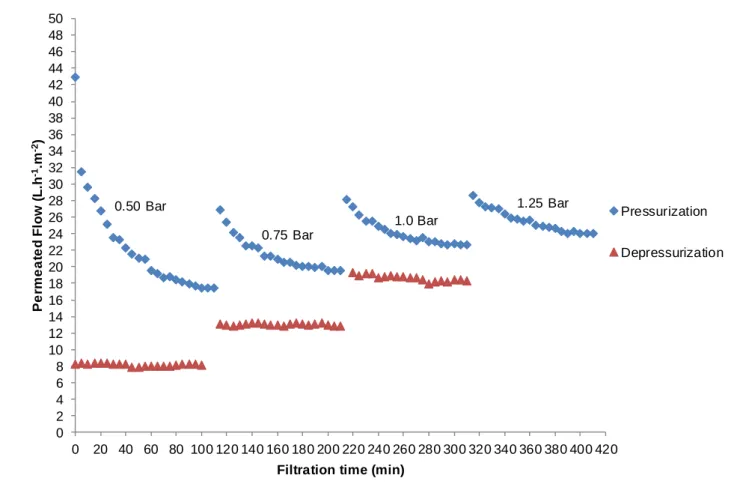
Figures 8 and 11 present the results for the permeated flows of samples originated after the secondary treatment (settling basin), AIF, and after the tertiary treatment (physical-chemical floater), AFF, in relation to the filtration time. At these rehearsals, the flows were measured during approximately 100 minutes for each pressure variation tested until a stationary flow was reached. The trans-membrane pressure differential was adjusted from 0.5 to 1.25 bar (pressurization) at intervals of 0.25 bar and, next, reduced again to 0.5 bar (depressurization).
Figure 8 – Behavior of the permeated flow of effluent sample collected after the settling basin in relationship to the pressure differential applied over time, for the microfiltration membrane.
0 2 4 6 8 10 12 14 16 18 20 22 24 26 28 30 32 34 36 38 40 42 44 46 48 50 0 20 40 60 80 100 120 140 160 180 200 220 240 260 280 300 320 340 360 380 400 420 P e rm e a te d F lo w ( L .h -1.m -2)
Filtration time (min)
Pressurization Depressurization 0.75 Bar 1.0 Bar 1.25 Bar 0.50 Bar
47
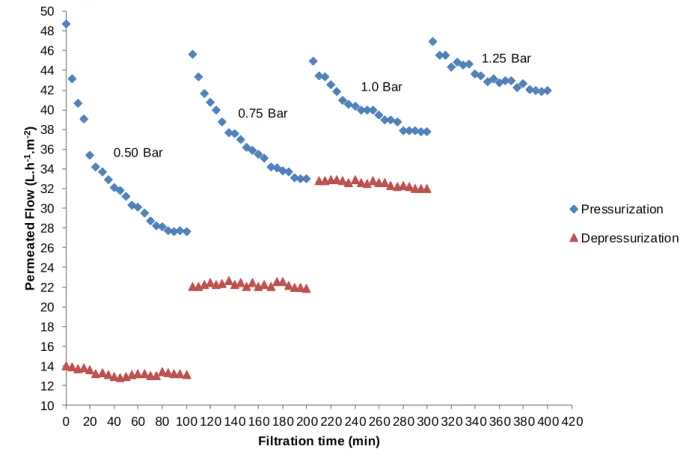
Figure 9 - Behavior of the permeated flow of effluent sample collected after the settling basin in relationship to the pressure differential applied over time, for the ultrafiltration membrane.
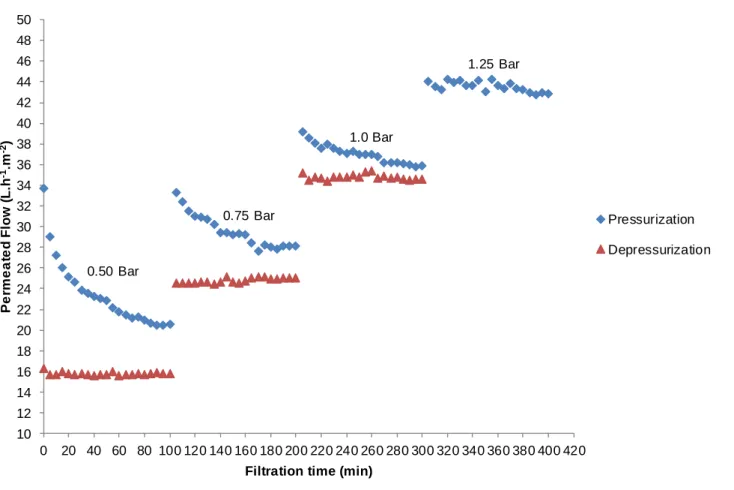
Figure 10 - Behavior of the permeated flow of effluent sample collected after the physical-chemical floater in relationship to the pressure differential applied over time, for the microfiltration membrane.
0 2 4 6 8 10 12 14 16 18 20 22 24 26 28 30 32 34 36 38 40 42 44 46 48 50 0 20 40 60 80 100 120 140 160 180 200 220 240 260 280 300 320 340 360 380 400 420 P e rm e a te d F lo w ( L .h -1.m -2)
Filtration time (min)
Pressurization Depressurization 0.75 Bar 1.0 Bar 1.25 Bar 0.50 Bar 10 12 14 16 18 20 22 24 26 28 30 32 34 36 38 40 42 44 46 48 50 0 20 40 60 80 100 120 140 160 180 200 220 240 260 280 300 320 340 360 380 400 420 P e rm e a te d F lo w ( L .h -1.m -2)
Filtration time (min)
Pressurization Depressurization 0.75 Bar 1.0 Bar 1.25 Bar 0.50 Bar
48
Figure 11 - Behavior of the permeated flow of effluent sample collected after the physical-chemical floater in relationship to the pressure differential applied over time, for the ultrafiltration membrane.
The results show that the reduction of the permeated flow with effluent samples collected after the settling basin and after the physical-chemical floater is significant when compared to the values found by the rehearsals where the permeability of the membranes was evaluated with distilled water. This indicates that the characteristics of the effluent samples used in the feeding of rehearsals favor the occurrence of incrustation and the formation of a pellicle on the membranes’ surface, allowing the occurrence of phenomena such as clogging and concentration polarization (LEE et al., 2011).
Figures 12 and 13 illustrate the results of the behavior of the stationary flow of distilled water and the effluent sample after the settling basin, AIF, and after the physical-chemical floater, AFF, in relationship to the pressure differential, using conditions similar to the tests performed with distilled water. The results, equivalent to the rehearsals using only distilled water, show that the flow variation occurs linearly and allow the evaluation of the permeability of membranes with effluent samples, through the evaluation of the inclination found on the lines.
10 12 14 16 18 20 22 24 26 28 30 32 34 36 38 40 42 44 46 48 50 0 20 40 60 80 100 120 140 160 180 200 220 240 260 280 300 320 340 360 380 400 420 P e rm e a te d F lo w ( L .h -1.m -2)
Filtration time (min)
Pressurization Depressurization 0.75 Bar 1.0 Bar 1.25 Bar 0.50 Bar
49
Figure 12 – Behavior of the stationary permeated flow of distilled water, effluent sample after the physical-chemical floater, and effluent sample after the settling basin in relation to the pressure differential applied to the microfiltration
membrane.
Figure 13 - Behavior of the stationary permeated flow of distilled water, effluent sample after the physical-chemical floater, and effluent sample after the settling basin in relation to the pressure differential applied to the ultrafiltration
membrane.
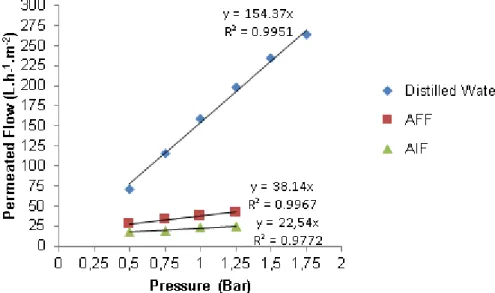
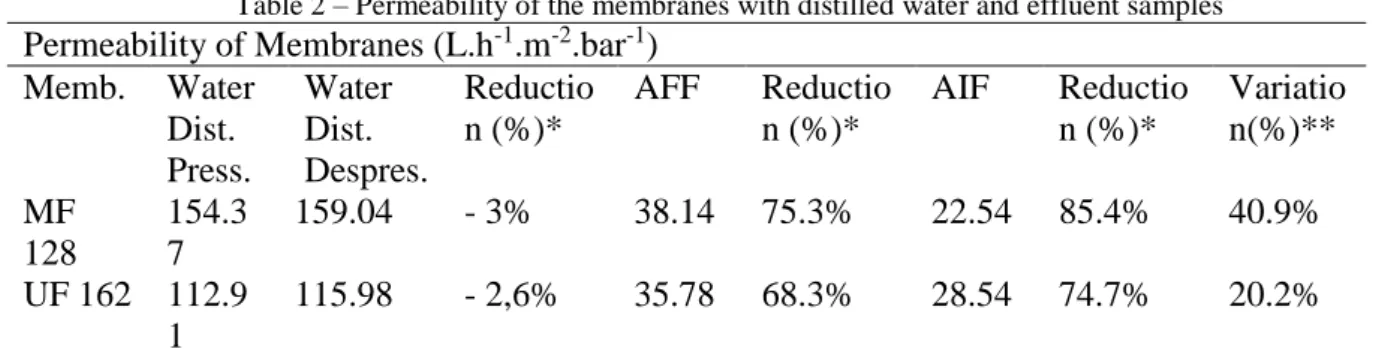
Table 2 presents a comparison of the permeability values for the membranes during the pressurization and depressurization with distilled water and effluent samples collected after the settling basin and after the physical-chemical floater. The table also shows a reduction of permeability compared with the values observed with distilled water during the pressurization, besides the variation of permeability for effluent samples. The permeability was calculated using the inclination of the lines obtained from the graphic dots of figures 12 and 13.
50
Table 2 – Permeability of the membranes with distilled water and effluent samples
Permeability of Membranes (L.h-1.m-2.bar-1)
Memb. Water Dist. Press. Water Dist. Despres. Reductio n (%)* AFF Reductio n (%)* AIF Reductio n (%)* Variatio n(%)** MF 128 154.3 7 159.04 - 3% 38.14 75.3% 22.54 85.4% 40.9% UF 162 112.9 1 115.98 - 2,6% 35.78 68.3% 28.54 74.7% 20.2%
* Reduction in relation to the permeability with distilled water during pressurization
** Variation of the permeability of samples collected after the settling basin and after the physical-chemical floater
The results shown on Table 2 demonstrate that the microfiltration membrane (MF 128) have more permeability in comparison with the ultrafiltration membrane (UF 162), when distilled water and effluent samples that were collected after the physical-chemical floater were used in these rehearsals. However, for the effluent samples collected after the settling basin, there was a higher permeability at ultrafiltration (UF 162), a fact that was also observed by the variation in permeability of effluent samples collected in both stages. In regards to the reduction of permeability, when rehearsals were done with distilled water and effluent samples, the ultrafiltration showed a higher percentage of reduction. 4. CONCLUSION
In relationship to the mechanical resistance behavior caused by the pressure differentials applied to the microfiltration and ultrafiltration membranes, using distilled water, both membranes showed no significant reduction of flow, with no influence of the following factors: concentration polarization, incrustation and clogging of pores. In addition, they were not significantly sensitive to the hysteresis and/or compression, due to the reversibility of the initial basic flow conditions, both at pressurization and depressurization. Nevertheless, when samples of effluents were used to evaluate the behavior in regards to mechanical resistance, the membranes suffered clogging, showing a reduction of the permeated flow.
The flow of distilled water increases linearly with the pressure increase applied to the membrane for both membranes evaluated. In other words, the higher the pressure applied to the membrane, the higher the permeated flow. When the same operational conditions are employed, there is a significant difference in the permeated flows when samples of distilled water and effluents are used. For both membranes, at microfiltration and ultrafiltration, the flow of distilled water higher than the permeated flow of effluent samples.
5. REFERENCES
ABNT - Brazilian Technical Standards Association, Rio de Janeiro: Preservation and sampling techniques of wastewater and receiving bodies. Procedure. NBR 9898. Rio de Janeiro. (1987).
ANDERSON, R; WILKINSON, D. P; BI, X; ZHANG, L. Two-phase flow pressure drop hysteresis in parallel channels of a proton exchange membrane fuel cell. Journal of Power Sources. Vol. 195. p. 4168-4176. (2010).
BRAILE, P. M; CAVALCANTI, J. E. W. A. Treatment Manual and Industrial Wastewater. Sao Paulo: CETESB. (1993).
51 GUO, W. F; CHUNG, T. S. Study and characterization of the hysteresis behavior of polyimide membranes in the thermal cycle process of pervaporation separation. Journal of Membrane Science 253. p. 13-22. (2005).
LEE, S; LEE, E; ELIMELECH, M; HONG, S. Membrane characterization by dynamic hysteresis: Measurements, mechanisms, and implications for membrane fouling. Journal of Membrane Science. 366. p. 17-24. (2011).
PADAKI, M; MURALI, R. S; ABDULLAH, M. S; MISDAN, N; MOSLEHYANI, A; KASSIM, M. A; HILAL, N; ISMAIL, A. F. Membrane technology enhancement in oil-water separation. A review. Desalination. Vol. 357. p. 197-207. (2015).
PAM MEMBRANAS. Installation, operation and maintenance. Unit of MF / UF / NF countertops. (2012).
SARMENTO, L. A. V. Collection and separation of cocoa beans by supercritical extraction of polyphenols associated with membranes. 2007. 103 p. Thesis (Doctorate in Chemical Engineering). Federal University of Santa Catarina, Florianópolis. (2007).
SONI, J. V; ABILDSKOV, J; JONSSON, G; GANI, R. A general model for membrane-based separation process. Computers and Chemical Engineering, Vol. 33. p. 644-659. (2009).
TRINDADE, R. S. Characterization of polymeric membranes applied to the microfiltration process. 2010. 74 p. Federal University of Rio Grande do Sul, Porto Alegre. (2010).