iii
Març o , 2016
João Carlos de Fraga Gião da Silva
Licenciado e m Ciências da
Enge nharia Eletro té cnica e de Computado res
A Framewo rk fo r Pro filing based o n Music and
Physio lo gic al State
Disse rtação para o btenção do Grau de Me stre em Enge nharia Eletro té cnica e de Computado res
Orie ntado r: Ricardo Go nçalve s, Profe sso r Asso ciado co m Agregação , FCT/UNL
Co -o rie ntado r: Jo ão Sarraipa, Inve stigado r, UNINOVA
Júri:
Presidente : João Francisco Alves Martins
Argue nte: João Pedro Abre u de Oliveira
iii
A Framework for Profiling based on Music and Physiological State
Copyright ©João Carlos de Fraga Gião da Silva, Faculdade de Ciências e Tecno-logia, Universidade Nova de Lisboa.
v
vii
A
CKNOWLEDGEMENTS
First of all, I would like to start by thanking Prof. João Sarraipa for his sup-port, commitment, advising and supervising, motivation and encouragement throughout the development of this dissertation. I also like to thank Fernando Ferreira, Francisco Xavier and Prof. Ricardo Gonçalves for the assistance pro-vided in the paper co-authored together and also helping on questions regarding this dissertation.
I also like to thank to all my close friends and colleagues for many interest-ing discussion, support and friendship. An enormous gratitude to all friends who subjected to several physiological tests in order to have good results for this dis-sertation.
ix
Abstract
The IoT (Internet of Things) is an emergent technological area with distinct chal-lenges, which has been addressed by the world research community. This disser-tation proposes the use of a knowledge-based framework capable of supporting the representation and handling of devices along with some autonomous inter-action with the human being, for creating added value and opportunities in IoT. With usability in mind, the objective lays in an attempt to characterize users’ physiological status mainly through music in a profiling approach. The idea is to produce a solution able to customize the environment by musical suggestions to the actual scenarios or mood that the users lie in. Such system can be trained to understand different physiological data to then infer musical suggestions to the users. One of the adopted methods in this work explores that thought, on whether the usage of a person’s physiological state can wield adequate sensorial stimulation to be usefully used thereafter. Another question considered in this work is whether it is possible to use such collected data to build user’s musical playlists and profile that tries to use the user’s physiological state to predict his or her emotional state with the objective to reach a well-being situation.
xi
Resumo
O IoT (Internet of Things) é uma área tecnológica emergente com desafios distin-tos, que tem sido utilizada pela comunidade mundial de investigação. Esta dis-sertação propõe o uso de uma base de conhecimento capaz de suportar a repre-sentação e a manipulação de dispositivos com alguma interação autónoma com o ser humano, para criar um valor acrescentado e oportunidades no IoT. Com o propósito da usabilidade, o objetivo reside na tentativa de caracterizar o estado fisiológico dos utilizadores através de uma abordagem de perfil. A ideia é pro-duzir uma solução capaz de personalizar o ambiente através de sugestões musi-cais para o cenário atual ou humor em que o utilizador se encontra. Este sistema pode ser treinado para entender diferente informação fisiológica para, posterior-mente, inferir sugestões musicais aos utilizadores. Um dos métodos adotados neste trabalho explora esta vertente, se o uso do estado fisiológico de uma pessoa pode exercer uma estimulação sensorial adequada para ser, subsequentemente, utilizada de forma útil. Outra questão considerada neste trabalho é a possibili-dade de se utilizar os dados recolhidos para criar uma lista de música pessoal do utilizador e um perfil que tenta prever o estado emocional do(a) utilizador(a) com base no seu estado fisiológico com o objetivo de se alcançar uma situação de bem-estar.
xiii
Contents
1. INTRODUCTION ... 1
1.1. RESEARCH METHOD ... 2
1.1.1. Research Question ... 4
1.1.2. Hypothesis ... 4
1.1.3. Dissertation Outline ... 4
2. STATE OF THE ART ... 7
2.1. EMOTIONS ... 7
2.1.1. Core Affect, Mood and Emotion ... 7
2.1.2. How to represent emotions ... 9
2.1.2.1. The Ortony, Clore and Collins (OCC) model ... 9
2.1.2.2. Wheel of Emotions ... 10
2.1.2.3. Arousal-valence Space... 11
2.1.3. Understanding the Emotional Information ...12
2.1.4. Self-report measurements to know the user’s emotional state – Psychological tools ...15
2.1.5. Summary - Emotional deduction ...15
2.2. PHYSIOLOGICAL SENSORS ... 16
2.2.1. Facial EMG ...17
2.2.2. GSR ...17
2.2.3. Skin temperature ...18
2.2.4. Oxygen saturation ...18
2.2.5. ECG...18
2.2.6. EEG ...19
2.2.7. Respiration ...20
2.2.8. BVP ...20
xiv
2.2.10. Summary of the most proper physiological sensors to use in this
dissertation ... 22
2.3. MUSIC USE AND ITS INFLUENCE IN EMOTIONAL STATES ... 23
2.3.1. R&D in Technology – The use of Music for our Well-being ... 23
2.3.2. Current applications ... 24
2.3.2.1. Controlling background music for a group use... 26
2.3.2.2. Controlling background music for Individual use ... 27
2.3.2.3. Investigation Use ... 28
2.4. SOME INTEROPERABILITY ISSUES AND RESOLUTION APPROACHES ... 29
2.4.1. Interoperability on Electronic Health Records (EHRs) ... 30
2.4.2. Health Informatics Standards ... 31
2.4.2.1. OpenEHR ... 31
2.4.2.2. HL7 - HL7 Messages ... 31
2.4.2.3. IHE ... 32
2.4.3. Syntax and Semantics ... 32
2.4.3.1. How to formalize knowledge ... 33
2.4.4. Ontology and Semantic Web ... 34
2.4.4.1. Protégé... 36
2.4.4.1.1. A language to query results from an ontology ... 36
2.5. RELATION TO IOT PARADIGM ... 36
2.5.1. Existing solutions ... 37
2.5.1.1. Sensors in Smart Cities ... 37
2.5.1.2. Wearable Devices ... 37
2.6. SUMMARY ... 38
3. FRAMEWORK FOR USER PROFILING ... 39
3.1. PHYSIOLOGICAL MEASUREMENTS ... 41
3.1.1. Libraries ... 42
3.1.2. Sensor functionality ... 42
3.1.2.1. Pulse and Oxygen in Blood ... 42
3.1.2.1.1. Code to get data from SPO2 sensor ... 43
3.1.2.2. Electrocardiogram ... 43
3.1.2.2.1. ECG frequency rate... 44
3.1.2.2.2. Code to get data from ECG sensor ... 45
3.1.2.3. Airflow: Breathing ... 45
3.1.2.3.1. Code to get data from Airflow sensor ... 45
3.1.2.4. Body temperature ... 45
3.1.2.4.1. Code to get data from Temperature sensor ... 46
3.1.2.4.2. Delays of temperature sensor ... 47
3.1.2.5. Blood pressure ... 47
3.1.2.5.1. Code to get data from blood pressure monitor ... 48
3.1.2.6. Patient positions and falls ... 48
3.1.2.6.1. Code to get data from patient position sensor... 48
3.1.2.7. GSR ... 48
xv
... 49
3.1.2.7.2. Code to get data from GSR sensor ... 49
3.1.2.8. EMG ... 49
3.1.2.8.1. Code to get data from EMG sensor ... 50
3.1.3. E-health physiological characteristics ...50
3.2. EXPERIMENT 1 - PHYSIOLOGICAL MEASUREMENTS ... 51
3.2.1. Method ...51
3.2.1.1. Material ... 51
3.2.1.2. Participants... 52
3.2.1.3. Apparatus ... 52
3.2.1.4. Procedure ... 52
3.2.1.5. Results ... 53
4. DEVELOPED ARCHITECTURE ... 55
4.1. SYSTEM ARCHITECTURE ... 56
4.1.1. Module (i) - physiological measurements ...56
4.1.2. Module (ii) – database ...57
4.1.3. Module (iii) - system’s engine ...58
4.1.3.1. Test Sensor ... 59
4.1.3.2. Measurements ... 59
4.1.3.3. Experiment ... 59
4.1.3.4. Music suggestion ... 60
4.1.3.5. Add Individual Info ... 60
4.1.3.6. History ... 60
4.1.3.7. Sensor position ... 60
4.1.3.8. Connections with the other components of the architecture ... 61
4.1.4. Module (iv) – ontology ...62
4.1.4.1. Ontology Model ... 63
4.1.5. Module (v) - data analysis ...64
4.1.6. Module (vi) - choose the appropriate music...65
4.1.7. Module (vii) - audio stimulus...65
4.2. SYSTEM DESCRIPTION ... 65
5. USE CASES AND ANALYS OF RESULTS ... 66
5.1. DATA ANALYSIS ... 66
5.1.1. Features that can be extracted through physiological signals and used in emotion deduction ...67
5.1.2. Signal processing ...68
5.1.2.1. Median Filter ... 70
5.1.2.2. Respiration signals ... 70
5.1.2.3. ECG signals ... 72
5.1.2.4. All used features ... 73
5.1.2.5. Feature Selection ... 73
5.1.3. Machine learning ...74
xvi
5.2.1. Scenario 1 ... 76
5.2.2. Scenario 2 ... 77
5.2.2.1. Experiment 2 – Training Machine Learning ... 79
5.2.2.1.1. Method ... 80
5.2.2.1.1.1. Material ... 80
5.2.2.1.1.2. Participants ... 80
5.2.2.1.1.3. Apparatus ... 81
5.2.2.1.1.4. Procedure ... 82
5.2.2.1.1.5. Results... 83
5.2.2.1.1.5.1. Relevant features for emotion deduction – from 14 days ... 83
5.2.2.1.1.5.2. Classifier using extracted features ... 87
5.2.2.1.1.6. Summary ... 88
5.2.3. Scenario 3 ... 89
5.2.3.1. Musical stimulus over test subjects ... 89
5.2.3.2. Search one physiological characteristic from all users ... 90
5.3. VALIDATION ... 91
6. CONCLUSIONS ... 93
6.1. FUTURE WORK... 94
7. ANNEXES ... 95
7.1. EXPERIMENT 1 ... 95
7.2. MANUALS ... 97
7.2.1. User Guide ... 98
7.2.2. Low Level Guide ... 118
xvii
List of Figures
FIGURE 2-1:STRUCTURE OF OCCMODEL [11]... 10
FIGURE 2-2:PLUTCHIK THREE-DIMENSIONAL CIRCUMPLEX MODEL [80] ... 11
FIGURE 2-3:AROUSAL-VALENCE SPACE MODEL ... 12
FIGURE 2-4:GROWTH OF THE GLOBAL MUSIC REVENUE BETWEEN 2013 AND 2018, BY CATEGORY [39] ... 25
FIGURE 2-5:GLOBAL DIGITAL MUSIC REVENUE FROM 2004 TO 2014[81] ... 25
FIGURE 2-6:GLOBAL MOBILE AUDIO STREAMING TRAFFIC FROM 2014 TO 2019(IN TERABYTES PER MONTH)[81] ... 27
FIGURE 2-7:DIGITAL SHARE OF OVERALL MUSIC SALES IN UNITED STATES,UK,GERMANY AND FRANCE FROM 2004 TO 2014[82] ... 29
FIGURE 2-8:KNOWLEDGE BASE REPRESENTATION [45]... 33
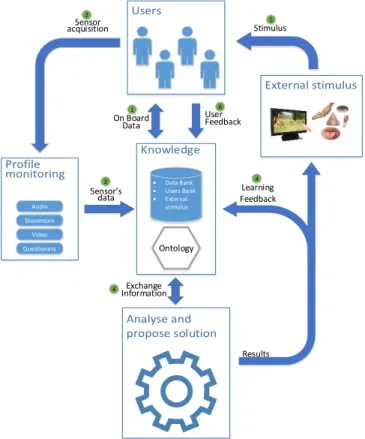
FIGURE 3-1:CONCEPTUAL FRAMEWORK OVERVIEW ... 40
FIGURE 3-2:E-HEALTH SHIELD, WHICH CONNECTS SEVERAL SENSORS TO THE SAME BOARD ... 41
FIGURE 3-3:DIFFERENCE BETWEEN 2ECG SIGNALS WITH DIFFERENT SAMPLING RATES FROM DIFFERENT HARDWARE.THE FIRST ECG SIGNAL HAS 37HZ AND THE OTHER HAS 53HZ ... 44
FIGURE 3-4:TEMPERATURE CALIBRATION SENSOR.TO MAKE THIS CALIBRATION IT IS NECESSARY TO KNOW THE VALUES OF THE FOLLOWING RESISTORS:REF,RB,RA AND RC ... 46
FIGURE 3-5:CALIBRATION OF THE GSR SENSOR.TO MAKE THE CORRECT CALIBRATION IT IS NECESSARY TO MEASURE THE VOLTAGE OF CONDU_GSR ... 49
FIGURE 3-6:EXPERIMENT 1– TIMES.FIRST IT WAS SHOWN A BLACK SCREEN FOLLOWED BY AN EMOTIONAL STIMULUS, USING ONE PICTURE.THE BLACK SCREEN AND EMOTIONAL STIMULUS HAD 4 AND 5 SECONDS, RESPECTIVELY.ALL PICTURES USED FOR THIS EXPERIMENT ARE PLACED ON SUB-SECTION 7.1 ... 52
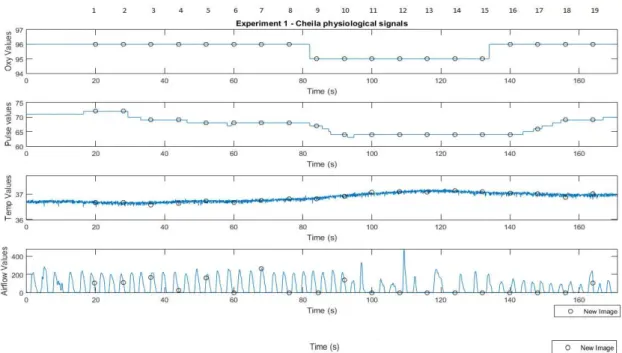
FIGURE 3-7:PHYSIOLOGICAL SIGNALS FROM 1 SUBJECT WITH EXPERIMENT 1.IT IS REPRESENTED FOUR PHYSIOLOGICAL MEASUREMENTS IN THEIR CORRESPONDENT TIMES.THE USED SENSORS WERE:OXYGEN IN BLOOD, PULSE, SKIN TEMPERATURE AND AIRFLOW.ON EACH SIGNAL IT IS REPRESENTED THE EXACT MOMENT AND PICTURE NUMBER.ALL PICTURES ARE ILLUSTRATED ON ANNEXES –SUB-SECTION 7.1 ... 53
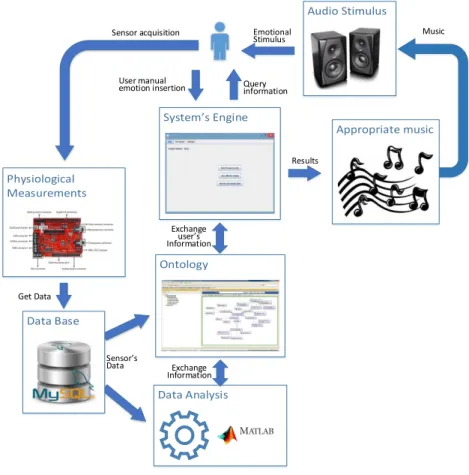
FIGURE 4-1:SYSTEM ARCHITECTURE ... 55
FIGURE 4-2:THIS IS ONE EXAMPLE OF ACQUIRE INDIVIDUAL INFORMATION.IN THIS EXAMPLE, IT WAS COMPUTED ALL CHARACTERISTICS FROM ONE EXPERIMENT WITH 8 DIFFERENT MUSIC USING 4 DIFFERENT SIGNALS ... 61
FIGURE 4-3:MUSIC ONTOLOGY ... 64
xviii
FIGURE 5-2:RESPIRATION FEATURES.THE ‘X’,‘O’ AND ‘+’ MEANS, RESPECTIVELY, SHORT BREATHS, RESPIRATION COUNT AND DEEP RESPIRATION.THE GREEN SIGNAL AND BLUE SIGNALS ARE, RESPECTIVELY, RAW AND
FILTERED SIGNAL ... 71
FIGURE 5-3:R-R DETECTION OF ONE ECG SIGNAL WITH 36HZ FREQUENCY RATE FROM 3 TO 20 SECONDS ... 72
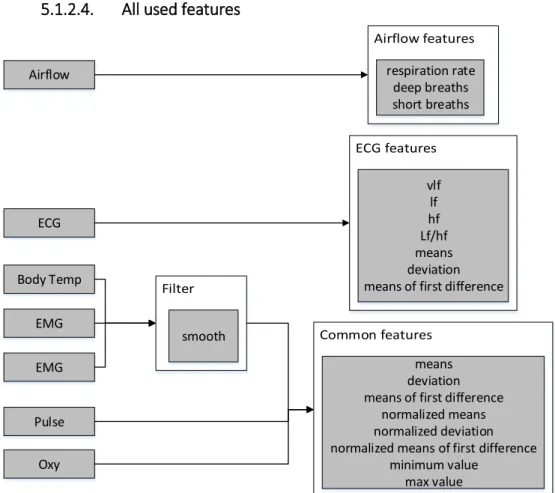
FIGURE 5-4:FEATURES ACQUIRED FROM EACH PHYSIOLOGICAL SIGNALS ... 73
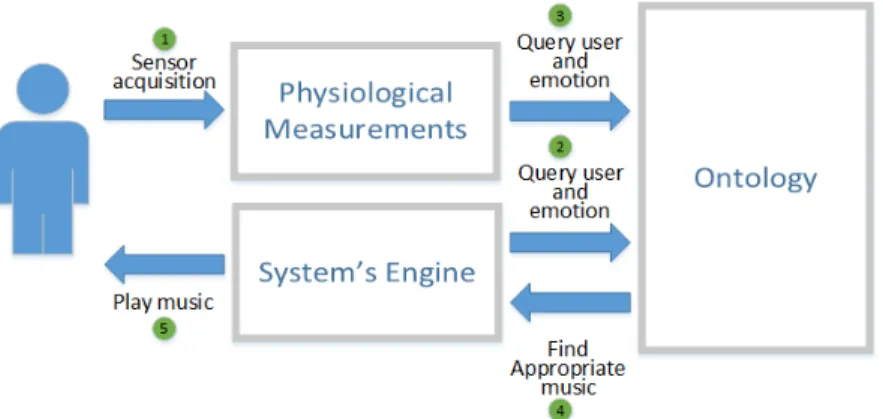
FIGURE 5-5:SCHEMATIC TO INFER ABOUT THE MOST APPROPRIATE MUSIC.1 REFERS TO ALL INFORMATION ABOUT ONE USER AND 2 REFERS TO ALL INFORMATION ABOUT ALL USERS WHICH USED THIS SYSTEM ... 75
FIGURE 5-6:SCENARIO 1 ... 76
FIGURE 5-7:FINDING THE MOST APPROPRIATE MUSIC ACCORDING TO THE USER'S CURRENT EMOTIONAL STATE AND NAME.A:SPARQL QUERY.B:RESULTS FROM QUERY ... 77
FIGURE 5-8:SCENARIO 2 ... 78
FIGURE 5-9:PHYSIOLOGICAL MEASUREMENTS ... 78
FIGURE 5-10:PULSE DIFFERENT MEASUREMENTS ... 79
FIGURE 5-11:TWO-DIMENSIONAL MODEL BY VALENCE AND AROUSAL [24] ... 79
FIGURE 5-12:APPARATUS FROM EXPERIMENT 2.I TIS POSSIBLE TO IDENTIFY 3 DIFFERENT SENSORS, ONE HEADPHONES IN ORDER TO LISTEN TO MUSIC AND DEVELOPED SYSTEM WHICH HAS ALL MUSIC USED IN THIS EXPERIMENT ... 81
FIGURE 5-13:EXPERIMENT 2- TIMES.FIRST IT WAS 15 SECONDS OF NO MUSIC FOLLOWED BY 30 SECONDS OF ONE MUSIC.THIS PROCEDURE OCCURS 8 TIMES DURING THIS EXPERIMENT ... 81
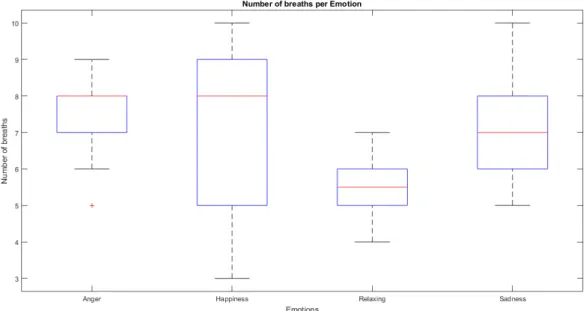
FIGURE 5-14:NUMBER OF BREATHS PER EMOTION.THIS PLOT REPRESENTS THE EMOTIONS ANGER, HAPPINESS, RELAXING AND SADNESS WITH THEIR NUMBER OF BREATHS ... 84
FIGURE 5-15:DEEP BREATHS PER EMOTION.THIS PLOT REPRESENTS THE EMOTIONS ANGER, HAPPINESS, RELAXING AND SADNESS WITH THEIR NUMBER OF DEEP BREATHS ... 84
FIGURE 5-16:DEVIATION OF OXYGEN IN BLOOD PER EMOTION.THIS PLOT REPRESENTS THE EMOTIONS ANGER, HAPPINESS, RELAXING AND SADNESS WITH THEIR DEVIATION OF OXYGEN IN BLOOD NUMBER ... 85
FIGURE 5-17:AN EXAMPLE OF THE PHYSIOLOGICAL FEATURES COLLECTED FROM EXPERIMENT 2 FROM 4 DIFFERENT SENSORS, ONLY FROM 1 DAY FROM 4 DIFFERENT MUSIC ... 86
FIGURE 5-18:NORMALIZED DEVIATION OF BODY TEMPERATURE.THIS PLOT REPRESENTS THE EMOTIONS ANGER, HAPPINESS, RELAXING AND SADNESS WITH THEIR VARIATIONS OF BODY TEMPERATURE ... 86
FIGURE 5-19:CONFUSION MATRIX WITH DECISION TREE CLASSIFIER WITH 9 OF 27 FEATURES.IMAGE ACQUIRED MATLAB TOOLBOX CLASSIFICATION LEARNER ... 87
FIGURE 5-20:USING PREDICTED MODEL FOR DEVELOPED SYSTEM ... 88
xix
List of Tables
TABLE 2-1:OVERVIEW OF SOME PHYSIOLOGICAL SENSORS AND WHAT FEATURES CAN BE EXTRACTED FROM THEM 21
TABLE 2-2:POSITIVE AND NEGATIVE ASPECTS REGARDING THE USE OF EACH PHYSIOLOGICAL MEASUREMENT ... 22
TABLE 3-1:SPECIFICATIONS OF THE PULSE OXIMETER SENSOR ... 43
TABLE 3-2:SPECIFICATIONS OF THE AIRFLOW SENSOR ... 45
TABLE 3-3:SPECIFICATIONS OF TEMPERATURE SENSOR [64] ... 46
TABLE 3-4:TIME TO REACH SKIN TEMPERATURE AFTER THE SENSOR IS IN CONTACT WITH SKIN.TIME DATA TAKES TO RETURN TO INITIAL TEMPERATURE.THESE VALUES WERE ACQUIRED AFTER SEVERAL TESTS. ... 47
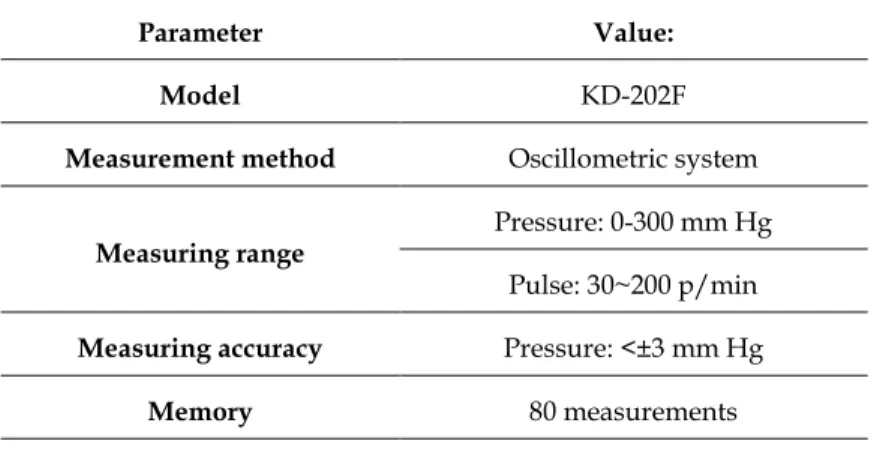
TABLE 3-5:SPECIFICATIONS OF BLOOD PRESSURE MONITOR ... 47
TABLE 3-6:SPECIFICATIONS OF PATIENT POSITION SENSOR ... 48
TABLE 3-7:SPECIFICATIONS OF GSR SENSOR ... 49
TABLE 3-8:SPECIFICATIONS OF EMG SENSOR ... 50
TABLE 3-9:E-HEALTH SENSORIAL INFORMATION [26] ... 50
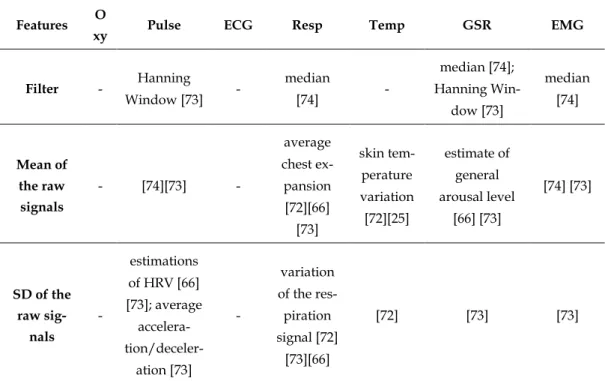
TABLE 5-1:SUMMARY OF FEATURES ACQUIRED FROM PHYSIOLOGICAL SIGNALS BY OTHER RESEARCHERS ... 67
TABLE 5-2:RESEARCHES REGARDING MACHINE LEARNING WITH PHYSIOLOGICAL SIGNALS... 75
xx
Acronyms
AIS Artificial Intelligence System
ANOVA Analysis of Variance
ANS Automatic Nervous System
ASCIIAmerican Standard Code for Information Interchange
BPM Beat Per Minute
BVP Blood Volume Pulse
ECG Electrocardiogram
EEG Electroencephalogram
EHR Electronic Health Records
EMG Electromyogram
FP Fisher projection
FP7 7th Framework programme
GA Genetic Algorithm
GSR Galvanic Skin Response
HF High Frequency
HL7 - Health Level Seven
xxi
HRV Heart Rate variability
HUD head-up display
I2C Inter-Integrated Circuit
IBI Interbeat Interval
ICT Information Technology and Communications
IHE Integrating the Healthcare Enterprise
IoT Internet of Things
JDBC Java Database Connectivity
LF Low Frequency
MAP Maximum a Posteriori
OCC Ortony, Clore and Collins
OWL Web Ontology Language
PSD Power Spectral Density
RDF Resource Description Framework
RDFS Resource Description Framework Schema
RFID Radio Frequency Identification
RMSSD Root Mean Square of the Successive Differences
SD Standard Deviation
SFFS Sequential floating forward search
SPO2 Peripheral Capillary Oxygen Saturation
SQL Structured Query Language
SVM Support Vector Machine
URI Uniform Resource Identifier
VLF Very Low Frequency
W3C World Wide Web Consortium
1
1.
Introduction
Technology is being used to improve citizen’s daily life. Through the crea-tion and improvement of new technologies, the comfort of people is becoming better every day. This technological progress has made possible to extend the use of Information Technology and Communications (ICT) to new applications to improve our quality of life. The ICT intends to make systems more intelligent, more energy-efficient and more comfortable in order to make the citizens a better use of cities’ resources. One example of this tendency is IoT, which increases in-telligence of the objects around us and connects them to the network to exchange data without requiring human interaction, because everything is connected and connected to the network. With the increase of sensors around us, it is possible to acquire useful physiological and psychological information about each person and data about the surrounding environment. This huge amount of personal in-formation can be useful to create new systems with the purpose of improving user’s wellbeing using, for instance, musical stimulus. Music is present is many public places we go. Trains, buses, elevators, restaurants or hospitals are some public areas that uses music as background music. And if it was possible to de-fine that music according to the majority of the emotional state of the users of these spaces? Could this simple change make the citizens happier? On [1] it was concluded that using music in a Smart Space had influence on reducing blood pressure, increased respiration (suggesting physiological responses to percep-tion and enjoyment of music) and lowest mean of electroencephalogram (sug-gesting the physiologically important aspects of appealing music therapy during
2
relaxation). Also experimental studies [2] showed that listening to positive mu-sic, when they try to improve their mood, was an effective way of improving happiness, experiencing greater gains in well-being, as measured by positive af-fect, subjective happiness and life satisfaction. Music is also used for an individ-ual use. Many people listens, individindivid-ually, to music while traveling, waiting or studying. It could be useful to choose music according to the current feeling state of the user, instead of a random selection. With the advance of technology and network communications, the use of mobile phones for listening music are in-creasing every day. In order to induce the correct stimulus on each person, it is necessary to define individual profiles because the same music can have different reactions on different users.
The integration of using music in our life result in one framework which has the objective of selecting the most appropriate music accordingly to user’s emotional state and user’s musical preferences. In order to have one system ca-pable of differentiate user’s physiological state is by understanding what physi-ological responses each user has while experiencing different emotions. An ex-ample of that is one person’s heart rate (HR) increase while he/she is experienc-ing a stressful moment, while in a relaxexperienc-ing moment the opposite behaviour can be identified. This work will focus on emotional changes that users have while listening to specific music defined by themselves. This fact is important because for one person one music can make him/her feel relax while the same music to other person can make him/her feel happy. With this knowledge, it is possible to express all relations between musical information and user emotional state, through their profile, in order to provide music recommendation according to each person’s physiological state and personal tastes.
1.1.
Research Method
The research method used to develop this dissertation was based on Clas-sical Method as proposed in [3]. This method is composed by seven steps, which are:
3
Background/Observation: It describes previous work, in the topic made by other researchers that are necessary to understand the mat-ter, before starting developing one possible solution for the research question. It is important to take into account the reliability of scien-tific documents, since their age, reliability and low experimentation can influence their scientific impact. This step is presented in section 2;
Formulate Hypothesis: In this step, the researcher identifies the re-sults that he is expecting to acquire. The hypothesis of this disserta-tion is presented in secdisserta-tion 1.1.2;
Design Experiment: It describes an architecture or solution proto-type for experimental testing and implementation. This proposed so-lution should be clearly enough described to allow other researchers to repeat the experiment. This design is described in sections 3 and 4 of this document;
Test hypothesis/Collect data: The researcher tests the presented sys-tem architecture or solution by executing their experiments. These experiments will generate data that will be analysed on next step. This step is presented in sub-sub-section 5.2.2.1.1;
Interpret/Analyse results: From the data acquired in the last step, the researcher needs to evaluate and analyse the obtained results. With these results, he can verify if the hypothesis that he presented above can be considered as valid or not. If the hypothesis is true, the researcher can make recommendations for further research. If the hy-pothesis is wrong, he can improve the initial approach in order to get different results. This interpretations are presented in sub-sub-sec-tion 5.2.2.1.1.5;
4
1.1.1. Research Question
Can a technological solution be capable of identifying users' emotion signs patterns, supported by music profiles definition, for further wellbeing state es-tablishment?
1.1.2. Hypothesis
If a Knowledge-based framework, that integrates devices like sensors with particular analytics algorithms, in order to identify specific users' physiological signs patterns is defined, then the establishment of personal music profiles asso-ciated to users' emotions is facilitated.
1.1.3. Dissertation Outline
This dissertation is divided in 7 sections, which are presented in the follow-ing:
Section 1 – Introduction: It is described the purpose of this disserta-tion as well as the motivadisserta-tion behind this research project. It also re-veals the adopted research method that was chosen. Finally, it is pre-sented the research question that motivated this dissertation and its hypothesis, in order to solve that question;
Section 2 – State of the Art: This section is used to present the state of the Art of this dissertation. It represents the information that was necessary to have in order to build one system capable of validate the defined hypothesis. To do that, first, it is presented several im-portant aspects of Emotions. Next, it is described several physiolog-ical sensors that are used to identify changes in different emotions felt by each use. After that, it is shown the importance of music for our well-being. Finally, it is described how to build one system, us-ing semantic, for the development of the solvus-ing methodology;
5
Section 4 – Implementation: This practical chapter is used to present to the reader the implementation of a prototype to prove the pro-posed hypothesis;
Section 5 – Use Cases and Analysis of Results: In this chapter it is defined three different use cases, which can be used with the devel-oped system made for this dissertation. This chapter also describes the applications already made with the developed system for the sci-entific community;
Section 6 – Conclusion: The dissertation is finalized by presenting the final thoughts and remarks as well as the presented hypothesis for solving of the research question and problems identified previ-ously. This chapter finish with a proposition for possible future work;
7
2.
State of the Art
This chapter provides a theoretical overview of important concepts on how to make a user’s profile, using music information, to help each individual to feel better. In order to do that, first it is necessary to differentiate emotions and how they can be represented. Second, there will be presented some sensors that are used in emotional deduction as well as the importance of music in our society. The last sub-section of this chapter intends to demonstrate the importance of knowledge representation to this dissertation.
2.1.
Emotions
2.1.1. Core Affect, Mood and Emotion
In order to understand the emotion it is necessary to define the similar definition of affective domain by differentiate emotion, mood and core affect. Since these definitions are very similar many researchers tend to do an individualistic ap-proach of this definitions.
Core Affect– is a neurophysiological state that is consciously accessible as a simple feeling. Some examples are feeling good or bad, pleasure and displeas-ure, tension and relaxation, energy and tiredness. Core affective feelings vary in intensity and everybody is always in some state of core affect, even if neutral [4]. In this matter, Russell and Barrett deduced that core affect and these feelings are part of moods and emotions. This deduction is based on the presence of these feelings in moods and emotions.
8
Mood – is subtler, lasts longer, is less intensive and endures over longer timescales. The mood only exists through the interaction between people [5]. There is a connection between mood and emotion. For instance, when a person has a negative effect (e.g. anger), that person also tends to have elevated levels of negative moods, like fear, sadness and/or guilt.
Emotion – According to Russel and Barrett [4] they defined emotion as a
complex set of interrelated sub-events concerned with a certain object, such as a person, an event, a thing, real or imagined that could have happened in past, can happen in present or will happen in future. Kleinginna and Kleinginna [6], after reviewing different definitions of emotions, compiled a list of more than 100 def-initions of emotion and proposed a working definition: Emotion is a complex set of interactions among subjective and objective factors, mediated by neural/hor-monal systems, which can (a) give rise to affective experiences such as feelings of arousal and pleasure/displeasure; (b) generate cognitive processes such as emotionally relevant perceptual effects, appraisals, labelling processes; (c) acti-vate widespread physiological adjustments to the arousing conditions; and (d) lead to behaviour that is often, but not always, expressive, goal directed, and adaptive. They concluded that psychologists couldn’t agree on many distin-guishing characteristics of emotions.
There are six perspectives of Emotions. They can be as:
Expressions, mostly using facial expressions where is analysed the facial expression of a person. This method is the most explored of affect’s detection. It can also be analysed through voice by analysing what is said and how it is said;
Embodiments, through physiological signals using sensors and re-late this data to emotions by analysing the results and assign a cor-respondent emotion. The heart-beat is one example of this physio-logical data;
9
Another example is the text analysis because a written text express the user’s emotion;
Social construct, by the use of social analysis where it can be use us-ers’ behavioural data or interaction with devices and asking the user how is he/she feeling and give a set of variables to choose;
Neuroscience, relating neurological process to emotions using, for example, through brain images that are detected by neurological cir-cuits and mapping the affective-states;
Psychological construct, using emotional theories to appoint the cor-rect emotion [7].
Both emotions and moods help people to process information and influence how they deal with situations presented to them [8]. However, there are facts that differentiate them. One difference between mood and emotion remains in the time domain. Emotion is related to punctuated events, so there is no connection between the moments in time in order to understand the sequence of emotions. This fact allows us to characterize any moment by a single emotion like a snap-shot [9]. For example, an emotion of anger might last for a few seconds, but an annoyed or irritable mood may persist for several hours or for some days. An-other difference is their focuses. On one hand, mood researchers have the atten-tion mainly and almost exclusively on subjective and phenomenological experi-ence. On the other hand, emotions have been viewed as multimodal psychophys-iological systems as shown above on the perspective of Emotions [10].
2.1.2. How to represent emotions
Emotion is a difficult concept to universally agree on. Therefore, in order to de-velop methods to determine what is the emotion of a given person, researchers created models, some of those are presented on the next sub-sections.
2.1.2.1. The Ortony, Clore and Collins (OCC) model
10
perceive the world. The supposition is that there are three major aspects or changes in the world, which are events, agents and objects. The base of their as-sumption is that emotions represent valence reactions of these perceptions of the world. This model hierarchically is described by 22 emotion type specifications. In this model there is a representation of emotions that can be induced by music such as soft, neutral and aggression and happy, neutral and sad [12]. They cre-ated a diagram of types of emotions which is represented by Figure 2-1.
2.1.2.2. Wheel of Emotions
11
centre. This wheel allows similar emotions to be grouped together and opposites one to be 180º apart.
This theory is interesting and it can be used in this thesis since we can iden-tify one emotion by sensing two basic emotions or deny an emotion because it was the opposite of the emotion that was expected. This model is represented on Figure 2-2.
2.1.2.3. Arousal-valence Space
12
2.1.3. Understanding the Emotional Information
To determine what the emotion of one person is, it is necessary to know what, when and how to measure.
What to measure - It is necessary to define how complex the emotions will be defined. Increasing the number of emotions will result on more complex and difficult to differentiate each emotion. The emotion theories or models can have:
One layer – Basic emotions: It only has basic emotions that can be easily distinguished. Pekrun examined the academic emotions and defined them into one layer. This emotions are divided into four pos-itive: joy, hope, pride and relief and five negative: boredom, anger, anxiety, shame and hopelessness;
13
Three layers – They have basic, secondary and tertiary emotions. Parrot model is one type of model which uses three layers of differ-ent emotion’s complexity. On his model he has defined a primary layer with the emotions: love, joy, surprise, anger, sadness and fear, a secondary or feeling layer with affection, pride, irritation, etc., and a third layer with desire, relief, depression, shock, ect..
Four and more layers: Kort and Reily [14] have attributed a 6x6 pos-sible emotion axes (anxiety-confidence, ennui-fascination, frustra-tion-euphoria, dispirited-enthusiasm, terror-excitement, humiliated-proud) that may fluctuate from the range of negative (-1) to positive (1) valence [5].
Instead of layers to define the complexity of emotional states, it can be used gradual emotion dimension. Hascher [15] has classified the following dimen-sions:
Arousal (deactivating/activating);
Valence (pleasant = positive, unpleasant = negative and ambivalent);
Intensity (low-intense);
Duration (short-long);
Frequency of its occurrence (seldom-frequent);
Time (retrospective like relief, actual like enjoyment, prospective like hope);
Point of reference (self-related like pride, orientated towards other people like sympathy or referring to an activity like boredom);
Context of an emotion (during learning, in achievement situations, during instruction, etc.).
When to Measure: -To know what the affective state of one person is, it can be known before, during or after performing one task. They can be measured:
14
and creative ways of thinking, but negative mood leads to a pessi-mistic perceptual attitude diverting a person to aspects irrelevant to the performing of one task;
During a task: The emotion is identified while a person is performing a task and can be done with psychological tools through self-report-ing, physiological sensors, through signalling and motor-behaviour through observation;
After a task: After the accomplishment of the task, it is perform an evaluation of the user’s affective state by the identification of the re-spondent’s emotional state in past sessions.
How to measure: -Researches indicate that emotion detection must be ob-jective, unobtrusive, non-invasive, in real time with the task, inexpensive, no need of special expertise and language and culture-free.
There are three areas of emotion measurement:
Psychological: The only way to measure user’s subjective feelings,
although it cannot be precise. Due to this fact it is avoid by research-ers because the subjects are often reluctant to show their inner feel-ings to avoid constraint. They are unobtrusive and non-invasive and employ verbal and non-verbal descriptions of emotions. It also has the problem to not be used in parallel with the task [5].
Behavioural: This strategies include evoking expressive gestures consistent with the emotion of the situation to cause the appropriate detection of it [16]. The studies of this affective state recognition fo-cuses on the audio-visual features like facial expressions and speech.
15
2.1.4. Self-report measurements to know the user’s emotional state –
Psy-chological tools
At the beginning of one system, it is important to know the emotion the user is feeling, in order to associate it to the physiological signals. With that infor-mation it is possible to know what physiological changes can identify the user’s emotion. In general, there are three main approaches to auto-evaluate the current emotion: self-assessment Manikin, categorical and dimensional. The self-assess-ment Manikin method is a non-verbal pictorial technique that directly measures the valence, arousal and dominance associated with a person’s affective state through a group of numerated pictures [19]. Categorical approach treats emotion as distinct class from each other using terms to describe emotions, for instance, sad, dreamy, happy, exciting and vigorous. There is no standard taxonomy sys-tem for this method. Dimensional approach uses positions on abstract dimen-sions to identify emotions, for example, in a valence and arousal dimension [20].
2.1.5. Summary - Emotional deduction
It is arguably not possible to measure the emotional state of one person, because it cannot be measured. There is, however, the possibility to deduct the emotional state based on physiological measures. However, some inaccuracies can happen as it is a very hard task to uniquely map physiological patterns (e.g. time, context, space, culture) onto specific emotional states. Thus such physiological patterns correspond uniquely to one individual and to a single situation. Then to record physiological measurements the user needs biosensors and sensing using surface electrodes which are attached to the body. Finally, the use of various biosensors at the same time, with specific characteristics becomes a complex multivariable task and requires knowledge of biological processes related to neuropsychologi-cal functions, which makes hard to identify emotions based only on collected sig-nals.
16
telling the truth or not. For instance, it is unusual that a person smiles and have a negative emotion [21].
2.2.
Physiological sensors
Sensors are used to provide a system with useful information concerning features of interest on the system’s environment. A sensor is defined as a device that con-verts a physical stimulus into a readable output, and usually they are used to know the occurrence of an event or when to end an action. There are some types of sensors, and they can be:
Mechanic: they detect movements, positions and presence, using me-chanic resources. This type of sensors are very used in the industry to know if a structure reaches the end of his route (through one end limit switch);
Magnetic: they detect the position of one piece or one part of a mecha-nism by putting one magnet to them. In the industry, where it is neces-sary to have quick responses, magnets are used because they have quick responses;
Photoelectric: they use light and have very fast responses. In addition, they also don’t have moving pieces that breaks or suffer detrition;
Encoders: they are used to measure the position of a swivel axis and its velocity;
Image: they are made from a big amount of photoelectric sensors that captures the shape, colour and other characteristics of one object. They are used, for instance, to detect defective objects on an assembly line;
Measuring Optical: they are used to detect optical characteristics, such as luminance, contrast and colour.
Thermal: they measure changes of temperature;
Presence: they detect persons by their body’s temperature or forest fires through their heat;
17
In this sub-section it is briefly introduced some physiological sensors that are used on emotional deduction by other researchers and which encloses various characteristics presented above. Based on previous literature, it was chosen the following physiological measurements: Facial electromyogram (EMG), Galvanic Skin Response (GSR), Skin Temperature, Oxygen Saturation, Electrocardiogram (ECG), Electroencephalogram (EEG), Respiration and Blood Volume Pulse (BVP). These sensors will be analysed in order to determine the most appropriate sensors in order to use in this dissertation.
2.2.1. Facial EMG
It is a type of electromyography which is related to muscle activity or fre-quency of muscular tension of one muscle, and it is measured with sensors [23]. Since EMG records muscle contraction, the higher the muscle strength due to emotion is, the higher is the amplitude recorded by EMG [24]. Facial EMG is fo-cused on muscles of face. It is commonly measured from a number of target sites, which can be the masseter (the muscle above the jaw), the corrugator (the muscle above the eye brow) and the zygomatic major (cheek). The masseter is associated with arousal and valence. The corrugator is associated with emotions with sig-nificant arousal such as anger or surprise. But Facial EMG cannot be precise be-cause one muscle movement is not for a specific affective state. For instance, there is higher activation of the masseter EMG when an individual is smiling and frowning and this can point to joy and grief [17].
2.2.2. GSR
18
some emotions such as fear and anger, fear and sadness, and happiness and sad-ness. It can also be used to detect both valence and arousal.
2.2.3. Skin temperature
Skin temperature measures the temperature at skin surface. Changes in skin temperature can be caused by vascular resistance or arterial blood pressure. Vas-cular resistance is inflected by smooth muscle tone that is mediated by sympa-thetic nervous system. Arterial blood pressure variation is resulting of cardiovas-cular regulation by automatic nervous system. Since skin temperature variation reflects activity from ANS, it is also an indicator of emotional stimuli [25].
2.2.4. Oxygen saturation
Oxygen saturation is defined as the amount of oxygen dissolved in blood, based on detection of Hemoglobin and Deoxyhemoglobin. To detect this, the sen-sor emits two different light wavelengths to measure the difference on the ab-sorption coefficients, because deoxygenated (deoxy-Hb) and oxygenated hemo-globin (oxy-Hb) absorb different wavelengths.
Normal ranges of oxygen saturation are from 95 to 99 %, those with a hy-poxic drive problem would expect values between 88 to 94 percent and values of 100 percent can indicate carbon monoxide poisoning [26].
Oxygen saturation is one parameter of pulmonary and cardiovascular func-tion, but some researchers couldn’t get patterns to identify emotions with this sensor [27][28]. However, this sensor is described to register changes on their readings with musical influence, with changes in oxygen-saturation levels when one person is subjected to musical stimulus [29].
2.2.5. ECG
19
biometric tool. Forsen [30] applied a less-invasive technique with only two elec-trodes that were attached to the index fingers without other lead. According to Silva and colleagues, using 12 –lead ECG and 63 seconds of recording, this method has an accuracy of 100% from a collection of 26 subjects. With the same recording, it was only analysed a single heart beat and it had an accuracy of 92%. The most useful features that can extract from an ECG to identify emotions are:
HR: reflects emotional activity. It has been used to differentiate be-tween positive and negative emotions, with the help of finger tem-perature;
Cardiac interbeat interval (IBI): Time between successive peaks of the R-wave of an ECG;
Heart Rate variability (HRV): oscillation of the interval between con-secutive heartbeats. It can show the mental effort and stress in adults. It can be a useful measure in high-stress environments [24].
2.2.6. EEG
20
2.2.7. Respiration
Breathing activity can be monitor through one latex rubber band. It can be worn either thoracically or abdominally. The most common measure is respira-tions rate and depth of breath. In the case of respiration’s slow rate, it can mean not only a relax situation, but also startling events and tense situations. But if occurs an irregularity in the measurement of respiration, if generally indicates a negative emotion. Because respiration system is linked to cardiac function, it can affect other measurements, like EMG and GSR measurements, and this influence must be take into account [24].
2.2.8. BVP
It measures the amount of blood that flows through human body with a photoplethysmograph. When heart beats, it causes a volume of blood to travel from the heart to the peripheral regions of human body. After a period of time, that blood volume will eventually return to the heart. Due to the relation between volume of blood and heart functionality, it is possible to determinate HRV, HR and cardiac IBI [31]. This physiological sensor as the inconvenient of change with room temperature where the person is and is very sensible with its installation and with movement [23].
2.2.9. Information of sensorial analysis
21
Table 2-1: Overview of some physiological sensors and what features can be extracted from them
Physiologic method to
detect an emotion
How to measure Placement of the sensors Features
Facial EMG
Small sensors are placed over a specific facial mus-cles and its electrical ac-tivity reflects changes in
muscle tension that re-sults in facial expressions
[32]
Facial EMG at the corru-gator supercilii and at the
zygomaticus [21]
Extract emotional valence [32]; Mean, SD corrugator supercilii (frowning); SD zygomaticus major
(smil-ing) [33]
GSR
Measured through the sweat glands - eccrine glands, usually on palms
and soles with surface electrodes sewn in Velcro
straps [23], [34]
Electrodes placed around two fingers on the same
hand [34]
Good response with emo-tional stimuli such as mu-sic; it is linearly correlated
with arousal changes in emotional ANS activities
while listening to music; can differentiate fear and anger, fear and sadness, and happiness and sadness
[17]
Skin Tem-perature
It measures the skin tem-perature [35]
Peripheral temperature at 3rd finger of
non-domi-nant hand [21]
Mean, SD Temperature [33]
Oxygen sa-turation
It has two different light wavelengths to measure the absorption spectra of Hemoglobin and
Deoxy-hemoglobin [26]
A pulse oximeter sensor is placed on one finger
Oxygen dissolved in blood [26]
ECG It records the electrical
activity of the heart [30]
It is placed three pre-gelled surface electrodes, two on the chest and one electrode on the
abdo-men [34]
HR; SD IBIs; RMSSD IBIs; LF power; HF power; VLF
power; Pulse transit time.[33]
EEG
It is used a cap with 18-256 scalp electrodes [30]
to capture the nervous system responses
Sensors over the scalp [30]
It was find correlations be-tween human emotions and significant EEG fea-tures extracted from raw
data [36]
Respiration
Sensors measures how deep and fast a person is
breathing [35]
It is applied a rubber band around the chest
[35]
Respiration Rate; ampli-tude respirations; respira-tory sinus Arrhythmia [33]
BVP
It measures the amount of blood that is running through vessels, e.g., in a
finger of one person [35]
It is applied a photople-thysmograph – light source and photo sensor
– attached to skin. The amount of reflected light
depends on the amount of blood passing through
it [35]
HR; SD IBIs; RMSSD IBIs; LF power; HF power; VLF power; Pulse transit time
22
Table 2-2: Positive and Negative aspects regarding the use of each physiological meas-urement
Physiologi-cal methods
to detect
emotions
Positive aspects Negative aspects
Facial EMG
It is able to measure changes in emotional va-lence [32]; Good results with other monitoring
systems
Limited information that can only in-form how positive or negative an emotional state is [32]; need other monitoring system [17]; invasive;
ob-trusive
GSR
Good with music stimuli; sensible to changes in arousal; it is correlated with arousal changes
in emotional ANS activities while listening to music [17]
Influenced by external factors
Skin
Tem-perature Emotions change skin temperature
Slow indicator of changes in emo-tional state [35]; influenced by
exter-nal factors
Oxygen
Sat-uration It is a non-invasive method and easy to read
There are studies that don’t get any
change with oxygen saturation [27]
ECG Can get 100% accuracy [30] Invasive when using all day
EEG
Since it’s measures are derived from central
nervous system, it is recognized as a superior metric when compared to the other physiolog-ical sensors in the emotional evaluation [36]
Only a small set of labeled samples is available to use; noisy channels [37];
invasive; obtrusive
Respiration Negative emotions usually cause irregularity
[24]
It can be inconclusive [24]; invasive when using all the day
BVP It can be used to measure vasoconstriction and
HR [35] Obtrusive
2.2.10.Summary of the most proper physiological sensors to use in this
dis-sertation
23
one emotion, and instead of it can be use HRV, because it provides better emotion information and is more constant in situations where someone is happy and re-laxed, whereas it shows high changes in more stressful situations [33]. To get better results, it can be necessary to combine more than one sensor to get other features, for instance, HR, HRV coupled with Respiration features could distin-guish between four basic emotions: anger, fear, happiness and sadness [17].
2.3.
Music use and its influence in emotional states
The use of physiological measurements is increasing. They can be presented in several devices and their connection with Internet is becoming more evident, which was already shown in section 1. This technology can be used to infer about user’s emotional state through the identification of changes in physiological sig-nals. This changes could be important to discover emotional stimulus that could be used for the user, to make him feel better. One example of an external element that could change a person’s emotional state is music. This sub-section has the objective to demonstrate the importance that music has in our technological so-ciety and different situations that music could be applied in order to make musi-cal stimulus over each person. This sub-section gives a brief analysis of invest-ments, made by European Union and United States, over projects related to mu-sic and its effects in our society. In this section it is also described several appli-cations with the same purpose of the developed system of this dissertation.
2.3.1. R&D in Technology – The use of Music for our Well-being
Under FP7 (7th Framework programme), there were many projects related to
24
project (project number 214901, funded under FP7-ICT). In this project, research-ers developed one framework to link fundamental sensing tasks to automated cognition processes. This goal was achieved using a network of heterogeneous sensors that monitor one environment or group of people, in order to understand human behaviour and different patterns. One example of that applicability is in the security, to detect abnormal behaviour in real time, for instance, when a per-son is caring a luggage and drops it.
For the next year, regarding the activities of 2016-2017, the European Com-mission, for the ICT in Horizon 2020, will give the following budgets:
SC1 – Health, demographic change and wellbeing: 124.2 M€. This sector is related to personalised medicine and the projects are related to active ageing and self-management of health, protection and health’s methods of data and coordination activities related to health and wellbeing;
SC6 – Europe in a changing world – Innovative, inclusive and reflec-tive societies: 70 M€. This social challenge include activities related to public sector modernization.
For the next year, the two of the three focus of the areas of the ICT working program will be:
IoT;
Smart and sustainable cities [38].
2.3.2. Current applications
25
Figure 2-4: Growth of the global music revenue between 2013 and 2018, by category [39]
26
As the population’s needs are listening more music and using more the dig-ital music, this system was developed taking into account two different cases: having the possibility to control the most appropriate music for an individual (or group of persons) or for investigation purpose.
2.3.2.1. Controlling background music for a group use
Music is present is many public places we go. Trains, buses, elevators, res-taurants or hospitals are some public areas that uses music as background music. And if it was possible to define that music according to the majority of the emo-tional state of the users of these spaces? Could this simple change make the citi-zens happier? On [1] it was concluded that using music in a Smart Space had influence on reducing blood pressure, increased respiration (suggesting physio-logical responses to perception and enjoyment of music) and lowest mean of EEG (suggesting the physiologically important aspects of appealing music therapy during relaxation). Also experimental studies [2] showed that listening to posi-tive music (the music had to be posiposi-tively valenced), when they try to improve their mood, was an effective way of improving happiness, experiencing greater gains in well-being, as measured by positive affect, subjective happiness and life satisfaction. The participants reported higher levels of happiness when listening to positive music while trying to feel happier, in a two weeks period. Imagining a public space where students or employees go for a coffee break. If it was possi-ble to know the generic emotional state of the group of people, it was possipossi-ble to play one music that could improve their feeling state and improve the citizens’ quality of life.
27
2.3.2.2. Controlling background music for Individual use
Instead of viewing the applicability of this dissertation for a group of per-sons, it can be used for an individual use. Many people individually listens to music while traveling, waiting or studying. It could be useful to choose the music according to the current feeling state of the user, instead of a random selection.
With the advance of technology and network communications, the use of mobile phones for listening music is increasing every day. Analysing Figure 2-6, which represents the use of internet for listening music, there are a huge increase of musical data acquired from the network, with global mobile audio streaming traffic from 2014 to 2019 having an increase of approximately 193 756 TB to 1 623 894 TB per month.
28
the movement during the sleep, to determine which sleep phase the user is in, and according to that information, the cell phone will turn on the alarm on the lightest sleep phase, to help the user feel rested and relaxed. Related to sleep quality sensing, other programs use the microphone of the smartphone to detect events that are related to sleep quality, including body movements, couch and snore [40]. Other study [41] analysed the influence of mobile phones while the users were using them to communicate with others. They use the information of the time of the mobile phone usage, phone and location data to give information of sociability and timing of calls, SMSs, emails, “screen on” to provide infor-mation of how often the users interact with phone during the day and the night. With all these sensors that most people already have with them every day, it is possible to use them, to deduct their emotional state and automatically propose the most appropriate music to make the user feel better while listen to that music.
2.3.2.3. Investigation Use
To understand the effects of music on our body and mind, it is necessary to measure it, through physiological sensors and see its information. This is pre-cisely what the system is capable of. One future work to be done with this system is the observation of physiological measurements of playing the same music but in different circumstances, for example, first is play only the music, then the mu-sic is played but with its videoclip, and finally the mumu-sic is played with a totally different video.
The investigation of the music area is a situation that is increasing with the technological evolution. This big global investment can be seen by Figure 2-7. Between 2004 and 2014 the digital share of music revenues grew for the analysed countries.
29
2.4.
Some Interoperability issues and resolution approaches
To be possible to infer about user emotional state, it is necessary to understand and use the information acquired by each sensor. The interpretation between this two different systems requires the so-called interoperability. Interoperability is the ability of two or more systems or components to exchange information and use the information that has been exchanged. A practical example addressing this issue can be presented through a scenario, which one of its systems (system 1) wants to communicate with another one (system 2). If system 1 uses data format A and system 2 uses data format B, they cannot understand each other. It is nec-essary, for example, to create a function or even another system to convert the data format A to B and B to A, or introduce a standard format in the middle for both systems use it [42].
30
At an organisational level, interoperability can be achieved when organiza-tions collaborate with each other in order to meet their business objectives, creat-ing new bonds within an enterprise and across the organizational borders that need to interoperate [43].
Another level that interoperability can be noticed is at a technical level, which takes place on the hardware and software. An interoperable software and hardware is created due to the existence of many systems (devices, sensors, etc.) that need to communicate and use each other data formats, as well as new sys-tems entering on the same environment which possesses new formats and stand-ards not foreseen in the environment. This connection between the systems ena-bles the exchange of data without the need of being remanufactured because the manufacturers only need to provide interoperability information of their own hardware allowing them to connect with other devices [42].
At a semantic level, interoperability ensures the exchange of information between two or more systems and having the meaning of sent information auto-matically and correctly interpreted by the receiving system. To have semantic interoperability, the semantic of the original message must be preserved. As a consequence, it is necessary to transfer a message that includes all the infor-mation required by the receiving system to interpret its meaning correctly what-ever the algorithms used by the receiving systems (which may be unknown to the sending system) [44] To have a semantic system, the system must have the capability to adapt the existent semantics to new acquired knowledge [45].
2.4.1. Interoperability on Electronic Health Records (EHRs)
This sub-chapter presents an example of interoperability resolution in the health domain. The variety of EHR makes interoperability an important trend in healthcare. In particular, semantic interoperability as a special attention since it ensures that different health information systems make the same interpretation of the exchanged information.
31
that defines integration guidelines based on established data standards (e.g., HL7).
But there are some problems with the existing standards to achieve seman-tic interoperability. Firstly, interoperability standards provide limited mecha-nisms to validate the information to be exchanged between the different systems. Secondly, they do not ensure the same interpretation of the exchanged infor-mation from one health inforinfor-mation system to another. Thirdly, the health in-teroperability standards require high effort, technical expertise as well as clinical domain knowledge. Finally, it is not possible to use all the standards together to achieve semantic interoperability.
2.4.2. Health Informatics Standards
System’s communications are usually adapted for exchanging data through one type of protocol. This fact represents one handicap, because it cannot be in-teroperable with other systems. To reduce this problem, communication proto-cols should be the same for all equipment, in order to one system understand information from any different system that connects with it. To show that im-portance, there will be exposed 3 different protocols to support clinical infor-mation.
2.4.2.1. OpenEHR
Consists on a generic information model, application-specific archetypes and context-specific templates. It has generic data structures for the health care domain (observation, evaluation and history). This archetypes allows the defini-tion of clinical concepts (e.g. HR), which are expressed on a generic reference model, define semantic rules that guarantee the correct and full interpretation of the clinical concept (e.g. HR constraints). It also templates package the archetypes in terms of forms that are useful to a particular clinical situation.
2.4.2.2. HL7 - HL7 Messages
32
required for seamless information integration among health information sys-tems. Each segment contains one specific category of information that use ASCII (American Standard Code for Information Interchange) on segments and one-character delimiters (e.g., |, ~). In every message the first segment of information defines the message type.
2.4.2.3. IHE
It is an initiative by healthcare professionals and industry to improve how the health system shares the clinical information. It promotes the coordinated use of established standards such as HL7 to address specific clinical need in support of optimal patient care. IHE proposes Integration Profiles to provide precise def-initions about the implementation of health standards to meet specific clinical needs with a common Framework. Research tells the systems develop according to IHE communicate with one another better, are easier to implement and enable care providers to use information more effectively [46].
2.4.3. Syntax and Semantics
The exchange of information can only be possible with semantic interoperability. Semantic is a verbal concept that allows differentiation from other concepts within a system of concepts. Semantic is informal when it creates meanings that people can understand or is formal when it creates meanings that machines can process [45].
To represent correctly one semantic system, it is necessary to define certain terms. Datacan be defined as symbols and alone it doesn’t have significance be-yond its existence. Data doesn’t have meaning of itself. An example of data is the output from a sensor, which can give a number, accordingly to the sensor or the situation, for example 19. This number alone does not have any meaning.
Infor-mation is data that are processed to be useful. Information has meaning by the
33
capability to build upon currently held information, knowledge and understand-ing. In computer parlance, an AIS (Artificial Intelligence System) possesses un-derstanding in the sense that they are able to create new information and knowledge from the previously stored information and knowledge. Wisdom is an extrapolative and non-deterministic, non-probabilistic process. Not only uses the previous levels of consciousness but also uses special types of human program-ming, e.g., moral and ethical codes. With these features, it asks questions, to which there are no answers, reason or judgement between right or wrong, good or bad. This characteristic isn’t present on computers [47].
2.4.3.1. How to formalize knowledge
In order to gather all the information about the health sensors, it is neces-sary to create one knowledge base, in order to gather all the knowledge of the system. This knowledge base can be represented based on Figure 2-8.
34
Instead of a glossary, it can be made a Dictionary. On a dictionary are listed words in a specific language with definitions, etymologies, pronunciations and other information. This component can also have listed words in one language with their equivalents in another language (lexicon). This tool is useful because it re-duces miscommunication and because users can search for new terms and abbre-viations in one local and lessens the mistake by homonym words [45]. The higher level is the classification system called taxonomy. It is the study of classification, including its basic principles, procedures and rules. It is grouped items scientifi-cally according to the purpose and codifying them with numerical identification according to certain principles [48]. Another type of classification system is the-saurus where its organization is based on concepts. It is a structure that manages the complexities of terminology and provides conceptual relationships through an embedded classification/ontology [49]. The highest level is ontology. Ontol-ogy is a common, shared and formal description for important concepts in a spe-cific domain. It has the possible inter-relationships between the constructs used in and it has consensual knowledge, where the knowledge is not from the point of view of one individual but a general view shared and accepted by a group. It is also a machine understandable giving the opportunity to be translated into some form of logic [45], [50]. The goal of ontology is to classify most complex and widespread knowledge system automatically. It was used to help with the rep-resentation, organization, acquisition, creation, usage and evolution of knowledge. With the Information Systems, ontology has been the most used in knowledge management [51].
2.4.4. Ontology and Semantic Web
35
or dependency. It can also be used to organize information in order to support information acquisition [52].
Semantic web is an extension of the current Web, which gives an easy way to find, share, reuse and combine information. It allows people to store data, build vocabularies and write rules for handling data, everything on the web. It has the objective to provide a better platform for knowledge representation of linked data to allow machine processing. This can be achieved by adding logic, inference and rules systems to the web, allowing data to be shared across differ-ent applications and everywhere [53]. It can be used the following methodolo-gies:
Resource Description Framework (RDF): It is the World Wide Web Consortium (W3C) standard model to describe metadata and ontol-ogy. It is usually used for representing and exchanging statements about information resources on the Web [54]. RDF is a XML-based standard (Extensible Markup Language) for describing resources that exist on the Web, intranets and extranets. It builds on existing XML and URI (Uniform Resource Identifier) technologies. RDF state-ments are often referred as “triples” that are composed by three parts: resources - subject, property – predicate and property value – object. Each triple encodes the binary relation predicate between subject and object, represented as a single knowledge fact [53];
Resource Description Framework Schema (RDFS): It is an exten-sion of RDF and has the capability of having vocabularies, taxono-mies and ontologies. It has the property of describing taxonotaxono-mies of classes and properties as well as defining the domain and range of RDF classes and their properties;
36
works also on OWL [56]. OWL is used to formally represent and in-tegrate activity-related information originated from different data sources [57].
2.4.4.1. Protégé
Protégé is a free, open-source ontology editor and knowledge-base frame-work. The concepts and theirs relations are described in an Ontology framework, which can be formalized by a program, for instance, Protégé. Ontologies can be exported into a variety of formats including RDF, RDFS and OWL [58].
To implement and validate an ontology it was used protégé and it was in-volved in the following steps: firstly it was defined classes, properties and their relations; secondly it was created instances for the built ontology in Protégé-OWL; thirdly querying the ontology instances with SPARQL; finally it was com-pared the queries results with the instances insert into the ontology and if the result were positive, then the ontology was validated.
2.4.4.1.1. A language to query results from an ontology
SPARQL is a query language to define data access protocol and a standard query language to use with RDS data. Since RDF databases are collections of tri-ples (subject, predicate and object), SPARQL searches each triple and return the desirable one [53]. To execute SPARQL queries it can be use Jena framework with ARQ (query engine) or protégé, which allows getting data from RDFS and OWL.
![Figure 2-4: Growth of the global music revenue between 2013 and 2018, by category [39]](https://thumb-eu.123doks.com/thumbv2/123dok_br/16572986.738097/47.892.179.757.136.467/figure-growth-global-music-revenue-category.webp)