Este artigo foi recebido em 3/4/2006 e aprovado em 22/4/2008. Correspondências devem ser enviadas para [email protected].
ISSN on-line: 1806-9290 www.sbz.org.br
Latent heat loss of Holstein cows in a tropical environment: a prediction model
Alex Sandro Campos Maia1, Roberto Gomes da Silva2, Cintia Maria Battiston Loureiro3
1Laboratório de Biometeorologia e Bem-Estar Animal, Departamento de Ciências Animais da Universidade Federal Rural do Semi-Árido, Mossoró, RN, Brasil.
2Departamento de Zootecnia, Faculdade de Ciências Agrárias e Veterinária, Universidade Estadual Paulista, Campus de Jaboticabal, Jaboticabal, SP, Brasil.
3Programa de Pós-graduação em Zootecnia, Faculdade de Ciências Agrárias e Veterinária, Universidade Estadual Paulista, Campus de Jaboticabal, Jaboticabal, SP, Brasil.
ABSTRACT - Nine lactating Holstein cows with average 526 ± 5 kg of BW, five predominantly black and four predominantly
white, bred in a tropical region and managed in open pasture were observed to measure cutaneous and respiratory evaporation rates under different environmental conditions. Cows were separated in three weight class: 1 (≤450 kg), 2 (450-500 kg) and 3 (>500 kg). Latent heat loss from cutaneous surface was measured using a ventilated capsule; evaporation in the respiratory system was measured using a facial mask. The results showed that heaviest cows (2 and 3 classes) presented the least evaporation rates. When air temperature increased from 10 to 36ºC the relative humidity decreased from 90 to 30%. In these conditions the heat loss by respiratory evaporation increased from 5 to 57 Wm-2, while the heat loss by cutaneous evaporation increased from 30 to 350 Wm-2. The results confirm that latent heat loss was the main way of thermal energy elimination under high air temperatures (>30ºC); cutaneous evaporation was the main mechanism of heat loss, responding for about 85% of the heat loss. A model was presented for the prediction of the latent heat loss that was based on physiological and environmental variables and could be used to estimate the contribution of evaporation to thermoregulation; a second, based on air temperature only, should be used to make a simple characterization of the evaporation process.
Key Words: evaporation rate, Holstein cows, tropical environment
Perda de calor latente em vacas Holandesas em ambiente tropical: um
modelo de predição
RESUMO - Nove vacas Holandesas lactantes com 526 ± 5 kg de peso corporal (cinco predominantemente pretas e quatro
predominantemente brancas), criadas em região tropical e manejadas em pastagens, foram observadas com os objetivos de determinar simultaneamente as taxas de evaporação cutânea e respiratória em ambiente tropical e desenvolver modelos de predição. Para a medição da perda de calor latente pela superfície corporal, utilizou-se uma cápsula ventilada e, para a perda por respiração, utilizou-se uma máscara facial. Os resultados mostraram que as vacas que tinham maior peso corporal (classe 2 e 3) apresentaram maiores taxas evaporativas. Quando a temperatura do ar aumentou de 10 para 36oC e a umidade relativa do ar caiu de 90 para 30%, a eliminação de calor por evaporação respiratória aumentou de aproximadamente 5 para 57 W m-2 e a evaporação na superfície corporal passou de 30 para 350 W m-2. Esses resultados confirmam que a eliminação de calor latente é o principal mecanismo de perda de energia térmica sob altas temperaturas (>30oC); a evaporação cutânea é a maior via e corresponde a aproximadamente 85% da perda total de calor, enquanto o restante é eliminado pelo sistema respiratório. O modelo para predizer o fluxo de perda de calor latente baseado em variáveis fisiológicas e ambientais pode ser utilizado para estimar a contribuição da evaporação na termorregulação, enquanto o modelo baseado somente na temperatura do ar deve ser usado apenas para a simples caracterização do processo evaporativo.
Palavras-chave: ambiente tropical, taxa de evaporação, vacas Holandesas
Introduction
Thermal equilibrium is achieved by cattle when the amount of heat produced by metabolic reactions equals the heat gained by the body from the environment. However, under too high environmental temperatures the thermal
equilibrium can hardly be attained and in these circumstances the heat excess can be stored in the body tissues (Finch, 1985; McLean et al., 1983), thus increasing body temperature.
© 2008 Sociedade Brasileira de Zootecnia
difference between the body surface and the environment (McLean 1963). In contrast, under high temperatures the
body can gain heat by convection (Gebremedhin & Binxin, 2001); if the environment is characterized by intense solar radiation the body gains large amounts of heat by radiation
(Curtis, 1982). In those conditions the ability of the animal to withstand its environment is proportional to its ability to dissipate heat by evaporation from the skin surface as a
result of sweating (Finch et al., 1982; McLean, 1963; Maia et al., 2005a) or from the respiratory system by panting (Stevens 1981; Maia et al., 2005b).
Knowledge about the latent heat flow from Holstein cows managed under natural conditions in a tropical environment would contribute to genetic improvement
programmes of dairy cattle in the tropics, by including fitness characteristics that are more favourable to the heat balance of animals. In addition, knowledge about latent
heat loss mechanisms can be used to develop mathematical and physical models as those proposed by Stevens (1981), McLean (1963), Gebremedhin et al. (1981), Turnpenny et al.
(2000) and McGovern & Bruce (2000) to explain thermal interaction between livestock and their environment.
These models have become valuable tools to determine
how climatic events, mainly due to the improvement of shelter and management practices, affect the animal. The present investigation aims to measure the latent heat loss from the
body surface and from the respiratory tract of Holstein cows managed under natural conditions in a tropical environment, with the objective of establish predicting models based on
simple physiological and environmental measurements.
Material and Methods
Nine lactating Holstein cows were used, five predominantly black and four predominantly white, with
average 526 ± 5 kg pf BW. Cows were separated in three
weight class: 1 (≤ 450 kg), 2 (450 - 500 kg) and 3 ( > 500 kg).
The cows were observed under the environmental
conditions of (21o15'22" South, 48o18'58" West, 595 m
altitude) during the period of July-September 2004. The observations were made 1 or 2 days per week in the time
period from 01:00 a.m. to 06:00 p.m. The cows were managed in open pasture and received silage ad libitum twice a day, always after milking (05:00 a.m. and 01:00 p.m. respectively).
Their average milk yield was 15 kg per day. The animals were observed after milking inside the milk parlour, where one cow at a time was kept standing inside an enclosure (1.2 x
3.0 m), while the other cows remained outside the milking parlour in a pen where they were exposed to direct sunlight.
Black globe, dry and wet-bulb temperatures and air velocity were taken near the animals inside the milking parlour
(approximately 1.0 m from each animal, 3.5 m from the roof and 1.0 m from the floor).
Dry and wet-bulb temperatures were measured with a
portable sling psychrometer; air velocity was determined by a thermo-anemometer (Alnor APM-360); for the black-globe temperature there was used a standard 0.15 m diameter
hollow copper painted matt black. The black-globe temperature was used to estimate the mean radiant
temperature (TRM, K) according to DaSilva (2000). All these
recordings were made as each cow was sampled.
The latent heat flow from the respiratory system and that from the cutaneous surface were determined at the
same time, by using a facial mask and a ventilated capsule respectively. The heat loss by respiratory evaporation
(ER, W m-2) was given by:
A VF
E E A
R
60 )
(Ψ −Ψ
= λ [1]
while the heat loss by cutaneous evaporation (ES, W m-2)
was given by:
C A C c S
A f
E = λ (Ψ −Ψ ) [2]
where λ = 2500.7879-2.3737tA is the latent heat of vaporisation
(Jg-1), A is the body surface area (A = 0.13w0.556, m2),
w is the body weight (kg), AC the area of skin covered by
the capsule (0.00724 m2) and ΨA, ΨE e ΨC (g m-3) are
absolute air humidity of the atmosphere, of the expired air and of the air outgoing the capsule; they are given respectively by:
A A
t
+ =
Ψ
15 . 273
} {t P 87 .
2166 P A
[3]
E E
t
+ =
Ψ
15 . 273
} {t P 87 .
2166 P E
[4]
C C
t
+ =
Ψ
15 . 273
} {t P 87 .
2166 P C
[5]
where PP{tA}, PP{tE} and PP{tC} are the partial vapour
pressures (kPa) of the air ambient, air expired and air
from the capsule, respectively; tA, tE and tC are the
temperatures (Celsius degree) of atmosphere, expired air
and the air from the capsule respectively. A CO2/H2O gas
analyzer (Li-Cor, mod. LI-6262) was connected by tubing to the mask’s outlet valve and to the capsule outlet tube,
in order to determine ΨE and ΨC.
Air flow rate (fC,m3 s-1) over the hair coat surface within
area (0.0003630 m2) at the air outlet tube of the capsule by the velocity (UC, m s-1) of the air passing over the hair coat surface; UC was measured by a precision thermo-anemometer (Alnor APM-360) set at the air outlet tube of the capsule (for more details see Maia et al., 2005a). Tidal volume (V, m3 breath-1) was determined as follows: the probe of a precision thermo-anemometer (Alnor APM-360) was set at the mask air inlet, in order to measure the speed of the air entering the mask during the respiration process; as the inspiration-expiration wave was known to be approximately a square wave, the air speed measured as above described was assumed to be the mean air velocity, UM (m.s-1). The radius (r) of the air inlet was 0.023 m, the volume of air entering the mask was πr2U
M =0.0016619UM m3s-1, thus the tidal volume can be given by:
1
0997141 .
0 −
= UF
V [6]
where F is the respiratory rate (breaths min-1). It was determined by counting the movements of the air inlet valve of the mask (for more details see Maia et al., 2005b). The total heat flux by evaporation (ET, W m-2) was ET = ER + EC.
Data were initially analysed by the least-squares method (Harvey 1960) using the Statistical Analysis System (SAS, 2001), according to Littell et al., (1991). The statistical model used to describe the total heat loss by evaporation was:
ijkl R R A A ik j i
ijkl α w r c bt b t bU bU ε
Y = + + + + + + + 2+
4 3 2 2
1 [7]
where Yijklis the total heat loss by evaporation (ET) in the lth cow; wi is the fixed effect of the ith weight class (i = 1,...,3); rjis the fixed effect of the jth repetition (j = 1,...,9); cjk is the random effect of the kth cow within weight class (k = 1,...,3 for i = 1; k = 1,...,3 for i = 2; k = 1,...,3 for i = 3); b1, b2, b3 and b4 are the linear and quadratic regression coefficients on air temperature and air relative humidity;
ε
ijkl is the residual term, inclusive the random error; and
α is the intercept.
Non-linear regression methods were used to estimate ER, EC, ET and tC, as function of air temperature and humidity, using Origin-5 software (Microcal Software Inc., Northampton, Mass. USA).
Results and Discussion
Heaviest cows (2 and 3 classes) presented the least evaporation rates (Table 1). In fact, lighter animals have larger body surface areas in relation to the volume. Cutaneous evaporation losses increase as the environmental
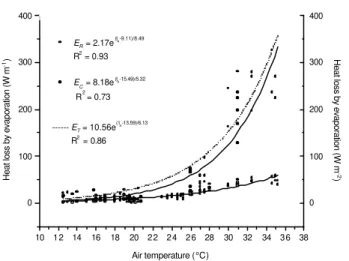
temperature rises (especially above 24oC), becoming the main way of latent heat dissipation (Figure 1). In such a condition the larger relative surface area of class 1 cows would certainly favours a greater potential for total heat flow by evaporation.
Latent heat loss (Figure 1) increases with air temperature in almost a linear fashion until 25ºC and then becomes increasingly high as the ambient temperature rises above 27ºC. The same was observed by Finch (1985) and Kibler & Brody (1954). This increase in the evaporative heat loss was presumably a direct consequence of the decreased thermal gradient between the coat surface temperature and that of the surrounding air. When tA was 10ºC, tC was about 27ºC; but when tA reaches 35ºC, tC increases to near 37ºC (Figure1 and 2). Consequently the thermal gradient decreases from 17ºC to only 2ºC, thus weakening the convection heat flux and causing the thermal radiation exchange to become a way of heat gain (Maia et al., 2005a; Gebremedhin & Binxin, 2001).
Total heat flux by evaporation (Figure 1) averaged 17.40 ± 0.92 Wm-2 when the air temperature was >20ºC and the air humidity approached 80%; from this total, an amount of 4.66 ± 0.34 Wm-2 was lost in the respiratory tract and 12.81 ± 0.99 Wm-2 through the cutaneous surface. These values agree with those found by Kibler & Brody (1954). However, when the air temperature reached 35ºC and the air humidity decreased to <30% the total evaporation was 264.67±37 Wm-2 on the average, being 216.88±33 Wm-2 lost by cutaneous evaporation while the rest was lost by respiratory evaporation.
Heat loss by evaporation was highly correlated with air relative humidity and this correlation was negative, while the contrary was observed for the air temperature (Figure 3). On the other hand, there was a high correlation between air relative humidity and air temperature, near 0.86; therefore, during the realization of the present study there were occurred low levels of air relative humidity in association to high environmental temperatures; a fact to be expected,
Table 1 - Total evaporative heat loss in Holstein cows, according to the body weight
I t e m Total latent heat loss (W m-2)
Overall mean 72.54 ± 9.87 Weight class
1 (≤450 kg) 123.01 ± 9.22a 2 (450-500 kg) 98.70 ± 8.70b 3 (>500 kg) 96.11 ± 7.14b
© 2008 Sociedade Brasileira de Zootecnia
as in most Brazilian country the summer was the rainy season. Such a correlation could explain why the inclusion of the air relative humidity in the prediction model for
evaporative heat loss did not markedly increase the
R2 value.
Two models were used to predict the total heat flux
by evaporation. Model 1 was based on the linear function
of tA given by logET = (0.86+tA)613-1. For example, a
Holstein cow observed under 35ºC air temperature
dissipated about 347.2 Wm-2 of latent heat, as estimated
by this model.
In the model 2 the total heat flux by evaporation can be described by Figure 4.
In Figure 4, ΨA e ΨE were combines in the operative
humidity ΨO (g m-3), thus:
C A C C A E
C A O C A O
A f A VF A
f A
VF ( )
60 ) ( ) ( 60
)
( Ψ −Ψ
+ Ψ − Ψ = Ψ − Ψ + Ψ −
Ψ λ λ λ
λ
[8]
and solving for ΨO (g m-3) the result was:
VF A Af
VF A Af
C C
E C C C
O +
Ψ + Ψ = Ψ
60 60
[9]
knowing that AC = 0.00724 m2; the air flow rate through the
capsule (fC) was set at 1.74 -2.05 L min-1, considering the
mean value to fC = 1.90 L min-1 or 3.17x10⁻⁵ m3 s-1. Thus
VF A
VF
A C E
O
00724 . 0 114
00724 . 0 114
+
Ψ +
Ψ =
Ψ [10]
There ΨO depends on ΨE and ΨC that are given by
equations 5 and 6 respectively and that depends on
PP{tC}; tE was estimated according to Maia et al. (2005b)
and Maia (2005), as:
) 01278 . 0 18 . 1 ( 47 .
9 A A
E t t
t = + − [11]
Figure 1 - Heat loss flux by respiratory (E
R; o) and cutaneous
(E
C; •) evaporation of Holstein cows as functions of
the air temperature. E
T = ER+EC.
Figure 2 - Coat surface temperature (t
C; o) of Holstein cows as
function of air temperature ( tA).
Figure 3 - Heat loss flux by respiratory (E
R; o) and cutaneous
(E
C; •) evaporation of Holstein cows as functions of
the air relative humidity.
Figure 4 - Heat total flow by evaporation between animal and environment. ΨA, ΨE, ΨS are the absolute humidity of atmosphere, expired air, and cutaneous surface;
ΨO was the operative absolute humidity. 10 1 2 14 16 18 20 2 2 2 4 2 6 28 30 32 34 3 6 38
0 100 200 300 400
ER = 2.17e
(tA-9.11)/8.49
R2
= 0.93
E
C = 8.18e
(tA-15.49)/5.32
R2 = 0.73
0 100 200 300 400
--- ET = 10.56e
( tA-13.59)/6.13
R2
= 0.86
Heat loss by evaporation (W m
-1)
Heat loss by evaporation (W m
-2
)
Air temperature (oC)
2 0 3 0 40 50 60 70 80 90 100
0 50 100 150 200 250 300 350
E
R = 54.50e
(-(UR-26.04))/22.82
R2 = 0.81
0 5 0 100 150 200 250 300 350
E
C = 299.63e
(-(UR-26.04))/12.71
R2
= 0.72
Air relative humidity (%)
Heat loss by evaporation (W m
-2)
Heat loss by evaporation (W m
-2
)
8 10 12 14 16 18 20 22 24 2 6 28 30 32 34 36 38 10
20 30 40 50
TRM
tA
t
C = 18,76+0,908tA-0,011tA 2
R2
= 0,87
10 20 30 40 50
Coat surface temperature (
oC) Mean radiant temperature (
o
C)
Air temperature (oC)
Epidermis
surface Coat
surface
Atmosphere
© 2008 Sociedade Brasileira de Zootecnia
{ }
C A C A S ASP t t t t t t t
P =−25.40−0.896 +2.17 −0.00962−0.0462+0.043
[12]
while V was estimated from the respiration rate,
according to Maia et al. (2005b) by:
2 ) 2 ( 97 . 1 ) 2 ( 93 . 161 32 . 755 2 − + − + − − = F F F
V [13]
Together with the equations 5, 6, 11 and 13, ΨO was
estimated in function of tA, tC, F and body weight, without
the use of facial mask and ventilated capsule. Thus
{ } + + − − + + + − − + + + − − + + = Ψ − ++ − ) 97 . 1 05 . 154 ( 3 . 1071 ) 01448 . 0 00724 . 0 ( )] 19 . 29 02 . 2283 ( 67 . 15876 [ )] 01278 . 0 18 . 1 ( 62 . 282 [ )] 0143 . 0 115 . 1 ( 756 . 7 [ )] 01448 . 0 00724 . 0 ( [ 15 . 273 87 . 2166 82 . 14 556 . 0 ) 01278 . 0 1 8 . 1 ( 97 . 2 4 6
) 313 . 0 85 . 2 8 ( 72 . 1938 556 . 0 F F F F F F w t t e F F F F F t t P w A A t t t t C C P O A A A A [14]
Finally, the total latent heat flow from animal (ET, W m-2)
was given by:
[
]
C C C A O T AA VF A Af E 60 ) 60 )((Ψ −Ψ +
= λ [15]
)] 97 . 1 05 . 154 ( 3 . 1071 [ 0565 . 0 )} 01448 . 0 00724 . 0 ( )] 000486 . 0 038 . 0 ( 2646 . 0 [ ){ ( 556 . 0 556 . 0 F F w F F F F w
E O A
T − + +
− + + + − Ψ − Ψ = λ [16]
In order to test the model, we can consider a 570 kg
Holstein cow standing inside the milk parlour under 35ºC
air temperature and 1.60 kPa partial pressure. The cow has a respiratory rate of 57 breaths per minute and a coat
surface temperature of 37ºC. In this environmental condition
the latent heat of vaporisation was λ =2417.71 Jg-1. We can
calculate: { } kPa 47 . 4 ) 37 )( 35 ( 043 . 0 ) 37 ( 046 . 0 ) 35 ( 0096 . 0 ) 37 ( 17 . 2 ) 35 ( 896 . 0 40 .
25 2 2
= + − − + − − = C Pt P 3 556 . 0 )) 35 ( 01278 . 0 1 8 . 1 ( 35 97 . 246 )) 35 ( 313 . 0 85 . 28 ( 35 72 . 1938 556 . 0 m g 33 . 31 )) 57 ( 97 . 1 05 . 154 ( 57 3 . 1071 )) 57 ( 01448 . 0 00724 . 0 ( 57 ))] 57 ( 19 . 29 02 . 2283 ( 57 67 . 15876 [ 570 ))] 35 ( 01278 . 0 18 . 1 ( 35 62 . 282 [ ))] 57 ( 0143 . 0 115 . 1 ( 57 756 . 7 [ 57 )] 01448 . 0 ) 57 ( 00724 . 0 ( 57 [ 37 5 . 273 ) 47 . 4 ( 87 . 2166 ) 570 ( 82 . 14 − − + − + = + + − − + + + − − + + + − − + + = Ψ e O 3 -m g 11.25 35 15 . 273 ) 60 . 1 ( 87 . 2166 = + = ΨA 2 -556 . 0 556 . 0 m W 77 . 252 ))] 57 ( 97 . 1 05 . 154 ( 57 3 . 1071 [ ) 570 ( 05659 . 0 )} 01448 . 0 ) 57 ( 00724 . 0 ( 57 ))] 57 ( 000486 . 0 038 . 0 ( 57 2646 . 0 [ 570 ){ 25 . 11 33 . 31 ( 71 . 2417 = + + − − + + + − − = T E
Therefore, in the specified conditions the contribution of the latent heat to the cow’s thermoregulation was
252.77 W m-2, as based in model 2.
For test power prediction of these models was comparing
simulated (ES1 and ES2) and measured (EM) values using
mean squared deviation (MSD) and its components,
according to Kobayashi & Salam (2000):
LCS SDSD SB E E n MSD n i M
Si− i = + +
=
∑
=1 ) ( 1 [17]Table 2 - Total evaporation (E
T)in a Holstein cow measured with facial mask and ventilated capsule and values of evaporation simulated
by model 1 (E
S1)and model 2 (ES2)
Item 1Fbreath. min-1 2tAºC 3tUºC 4tSºC 5wkg EW m-2 ES1W m-2 ES2W m-2
01 15 12 10.5 26.8 6 0 0 18.07 8.15 15.36
02 21 12 10.5 27.7 5 4 0 44.96 8.15 29.26
03 22 13 9 . 5 27.9 5 4 0 51.93 9.59 56.82
04 21 15 14.2 28.7 5 4 0 24.38 13.29 22.48
05 17 16 15 30.3 5 7 0 34.89 15.65 38.32
06 22 16 15 29.4 5 5 0 38.05 15.65 30.72
07 19 17 15 31.9 4 5 0 38.45 18.42 57.61
08 26 18 16 32.4 5 9 0 69.11 21.68 58.97
09 25 20 19 33.0 5 7 0 37.99 30.05 43.64
10 36 20 20.0 33.0 5 9 0 22.87 30.05 25.81
11 52 21 20.2 33.9 5 6 0 47.64 35.38 40.09
12 23 23 18 31.0 5 4 0 51.90 49.02 73.25
13 55 25 22 32.6 5 9 0 55.91 67.94 53.30
14 42 26 22 34.5 5 4 0 123.58 79.97 92.49
15 60 26 18 34.2 5 0 0 183.97 79.97 171.58
16 56 27 21 35.3 5 0 0 114.96 94.15 137.67
17 41 27 21 35.2 5 7 0 116.55 94.15 132.08
18 38 27 23 35.2 6 0 0 114.24 94.15 90.71
19 30 28 19 33.2 5 0 0 161.60 110.83 144.23
20 52 31 21 36.9 5 5 0 218.88 180.80 208.34
21 31 32 20.0 36.2 7 8 0 213.05 212.84 217.27
22 35 35 21 37.5 5 7 0 270.46 347.21 257.20
23 56 35 21 38.0 6 0 0 339.97 347.21 273.59
© 2008 Sociedade Brasileira de Zootecnia 2
)
(ESi EMi
SB= − [18]
2
) (S DS SDM
SDSD= − [19]
) 1 ( 2SDSD r
LCS= S M − [20]
where S B r e p r e s e n t t h e b i a s o f s i m u l a t i o n f r o m
measurements, SDSD was the difference in the magnitude
of fluctuation between the simulation and measurement,
while LCS was the lack of positive correlation weighted by
standard deviation, r was the correlation coefficient, SDS
and S DM are standard deviation of simulation and
measurement values, respectively and are the means of simulation and measurement values, respectively.
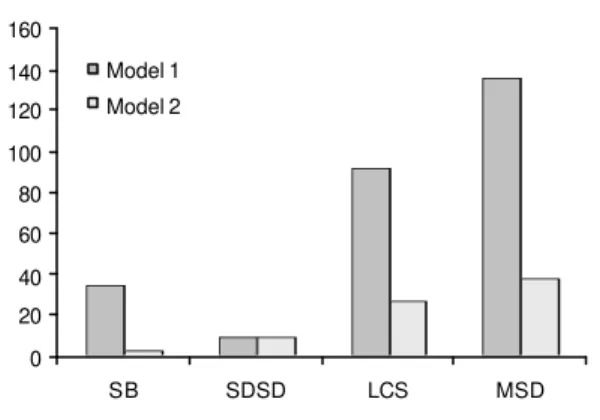
The value of MSD for model 2 was smaller than model
1 (Figure 5). The same result occurred for SB, SDSD and
mainly for LCS. The bigger value of LCS for model 1
indicated that this model failed to simulate the pattern of
fluctuation across the n measurements. This fact occurred
due its higher SDS (96.63 W m-2) than the SDS (77.25 W m-2)
for model 2. The lower the value of MSD for model 2
s h o w e d that the closer the simulation was to the measurement, obliviously indicating that this model was better than the model 1 for predicted value of heat loss by
evaporation. This result indicated that the inclusion of physiological variables like respiration rate and body surface temperature in combination with environmental
variables as air temperature and air humidity can improve the prediction power of the model.
Conclusions
In Holstein cows managed in tropical environment the dissipation of latent heat by evaporation is the main way of elimination of excess thermal energy, when air temperature
exceeds 30ºC. Cutaneous evaporation is responsible by 80% of total latent heat loss, while the rest is eliminated by respiratory evaporation. The prediction model for latent
heat loss based on physiological and environmental variables can be used to estimate the contribution of evaporation for thermoregulation, while the model based
on air temperature only must be used solely to make simple characterization of the evaporation process.
Literature Cited
SILVA, R.G. Introdução à bioclimatologia animal. São Paulo: Nobel, 2000. 285p.
FINCH, V.A. Comparison of non-evaporative heat transfer in different cattle breeds. Australian Journal Agricultural Research, v.36, p.497-508, 1985.
FINCH, V.A.; BENNETT, I.L.; HOLMES, C.R. Sweating response in cattle and its relation to rectal temperature, tolerance of sun and metabolic rate. J o u r n a l A g r i c u l t u r a l S c i e n c e, v.99, p.479-487, 1982.
GEBREMEDHIN, K.G.; CRAMER, C.O.; PORTER, W.P. Predictions and measurements of heat production and food and water requirements of Holstein calves in different environments.
Transactions of the ASAE, v.3 p.715-720, 1981.
GEBREMEDHIN, K.G.; BINXIN, W. A model of evaporation cooling of wet skin surface and fur layer. Journal of Thermal Biology, v.26, p.537-545, 2001.
HARVEY, W.R. Least-squares analysis of data with unequal subclass numbers. Beltaville: U.S.D.A., 1960. 157p. HILLMAN, P.E.; LEE, C.N.; PARKHURST, A. Impact of hair color
on thermoregulation of dairy cows to direct sunlight. In: ANNUAL INTERNATIONAL MEETING OF THE ASAE, 94., 2001, Sacramento. Proceedings... Sacramento, 2001. (Paper, 014301).
KIBLER, H.H.; BRODY, S. Influence of wind on heat exchange and body temperature regulation in Jersey, Holstein, B r o w n S w i s s a n d B r a h m a n c a t t l e. Missouri: Missouri A g r i c u l t u r a l E x p e r i m e n t S t a t i o n R e s e a r c h , 1 9 5 4 . 3 9 p . (Bulletim, 552).
KOBAYASHI, K.; SALAM, M. Comparing simulated and measured values using mean squared deviation and its components.
Agronomy Journal, v.92, p.345-352, 2000.
LITTELL, R.C.; FREUND, R.J.; SPECTOR, P.C. SAS S y s t e m f o r l i n e a r m o d e l s. 3.ed. Cary: SAS Institute, 1991. 329p. MAIA, A.S.C.; DaSILVA, R.G.; LOUREIRO, C.M.B. Sensible and
latent heat loss fluxfrom the body surface of Holstein cows in a tropical environment. International Journal of Biometeorology, v.50, n.1, p.17-22, 2005a.
MAIA, A.S.C.; DaSILVA, R.G.; LOUREIRO, C.M.B. Respiratory heat loss fluxof Holstein cows in a tropical environment. International Journal of Biometeorology, v.49, n.5, p.332-336, 2005b.
MAIA, A.S.C. Transferência de calor latente e sensível em v a c a s H o l a n d e s a s m a n e j a d a s e m a m b i e n t e t r o p i c a l. Jaboticabal: Universidade Estadual Paulistas, 2005. 94p. Tese (Doutorado em Zootecnia) - Universidade Estadual Paulista, 2005. Figure 5 - Comparison of the mean squared deviation (MSD)
and its components, lack of correlation weighted by the standard deviation (LCS), squared difference
between standard deviation (SDSD) and squared
bias (SB) for model 1 and 2. The values must be
multiplicity by 100. 0
20 40 60 80 100 120 140 160
SB SDSD LCS MSD
Model 1
© 2008 Sociedade Brasileira de Zootecnia MCGOVERN, R.R.; BRUCE, J.M. A model of the thermal balance
for cattle in hot conditions. Journal Agricultural Engineer Research, v.77, p.81-92, 2000.
McLEAN, J.A.; STOMBANGH, D.P.; DOWNIE, A.J. Body heat storage in steers (Bos taurus) in fluctuating thermal environments.
Journal of Agricultural Science, v.100, p.315-322, 1983. MCLEAN, J.A. The partition of insensible losses of body weight
and heat from cattle under various climatic conditions. Journal
of Physiology, v.167, p.427-447, 1963.
STATISTICAL ANALYSES SYSTEM - SAS. SAS user‘s guide:
statistics. Cary: SAS Institute, 2001. 956p.
STEVENS, D.G. A model of respiratory vapor loss in Holstein dairy cattle. Transactions of the ASAE, v.24, p.151-158, 1981. TURNPENNY, J.R.; MCARTHUR, A.J.; CLARK, J.A. et al. Thermal