BULLWHIP EFFECT IN PRODUCTION
CONTROL: A COMPARISON BETWEEN
TRADITIONAL METHODS AND LPS
Pedro Pereira1, Nuno Cachadinha2, Omar Zegarra3 and Luis Alarcón4
ABSTRACT
Last Planner System (LPS) has produced good results in reducing production time of construction projects, increasing productivity and mitigating the variability that is inherent to construction management. However, the Percent Plan Complete (PPC) rates usually obtained are still far from the ideal value of 100%. This study evaluates the hypothesis that the Bullwhip Effect (BWE) – the cumulative distortion of variability - exists in traditional control methods, which don’t have explicit and systematized mechanisms for variability reduction in production control, but also in LPS. To verify this hypothesis a method was formulated to extend the scope of the detection and quantification of the BWE in projects using LPS to traditional production control system (TPCS) methods. It was concluded that the BWE exists in both production control systems – Traditional and LPS’s – and that the BWE is not necessarily bigger in the traditional -system, even though the variability associated is much higher. The use of a BWE index is proposed as a tool for monitoring and controlling variability of production control in construction projects, as well as the utilization of this index as a Key Performance Indicator (KPI) that provides the stakeholders with a deeper control of the variability in both production systems.
KEYWORDS
Bullwhip Effect, Production Control, Last Planner System, Variability, Planning Management
INTRODUCTION
The implementation of the last planner system (LPS) of production control has produced satisfactory results in the reduction of construction project’s lead times and in the growth of productivity. Several studies (Ballard and Howell, 1998; Ballard and Howell, 2003; Alarcón et al, 2008; Alsehaimi et al, 2009) show that higher levels of PPC are obtained when compared to projects not using LPS. One of the LPS’s main goals is the reduction of the variability that is inherent to construction projects (Ballard and Howell, 2003). This factor is constant in every production system and impacts its performance. When variability propagates, it does so in a cumulative
1
MSc., Nova University of Lisbon, Portugal. E-mail: [email protected]
2
Asst. Professor, Nova University of Lisbon, Portugal presently at Technion-Israel Institute of Technology. E-mail: [email protected]
3
Candidate and Graduate Researcher at Centro de Excelencia en Gestión de Producción (GEPUC), Pontificia Universidad Católica de Chile. E-mail:[email protected]
4
manner along the chain, as an input generates an output with accumulated variability (Hopp and Spearman, 2008). In a supply chain, this phenomenon of accumulation of variability is designated as the bullwhip effect (BWE) (Lee 1998).
However, despite the successful implementation of the LPS in construction projects around the world, Alarcón and Zegarra (2012) suggest that there is room for improvement on what concerns LPS’s process itself. Their study sustains that the formulation and articulation of conversations in the different planning levels generates patterns of variability, which in turn amplifies along the LPS’s hierarchical chain and impacts the planning’s reliability. The study of this BWE on conversations is relevant, as the phenomenon’s existence may affect the LPS’s capacity to efficiently manage conversations and generate throughput.
The study of BWE is also important in TPCS since most construction companies have yet to implement LPS. Furthermore, TPCS do not possess LPS’s tools for the reduction of variability and, as such, it stands to reason that the study of variability in this kind of production control is of the utmost significance.
RESEARCH METHOD
The research design included in this section aims to investigate the existence and quantification of the BWE in projects using LPS and in projects using TPCS’s control methods. In order for this to be possible, a basis for comparison between the two methods of control must be found. As such, the considered hypotheses are as follows:
It is possible to calculate the PPC based on data usually found in the planning and follow-up elements of projects (such as planning baseline and update files, minutes from weekly meetings);
The BWE exists both in traditional control methods and in LPS;
The detected BWE is higher in traditional control methods
The design type chosen comprehends a systemic approach based on a two case study analysis – Case Study A refers to a project using LPS and was presented in Alarcón and Zegarra (2012). Case Study B refers to a project using traditional control methods.
BWEDETECTION AND QUANTIFICATION
The concept of the BWE of conversations was developed by Alarcón and Zegarra (2012), based on a synthesis of ideas of Flores and Ludlow (1982), Ballard and Howell (1998) and Cachon et al. (2007).The BWE of conversations in the LPS translates in the cumulative distortion of conversations in the LPS process, and impacts the planning reliability. In the LPS, the output from the master plan becomes the input of the look-ahead plan. This sequence is followed for the rest of the variables of the system, as shown in Figure 1.
Adapting the criteria for the presence of BWE in supply chains (Cachon et al, 2007) to the LPS method of control, the presence of BWE in each variable was defined as follows:
: 1
0
IMPLEMENTATION
The data used for the input/output of each LPS variable is, conceptually, the number of conversations in each planning level of the LPS. Ideally, each topic discussed should translate in an operational registry. As such, the number of items counted in a planning level for a given week may be considered as the number of conversations for that planning level in that same week. In this light, and taking into consideration the causal model represented in Figure 1, M represents a stock of conversations at the master schedule level; LA refers to the look ahead plan; R relates to the constraints log; BLG translates into the conversations in the workable backlog; W stands for the stock of conversations at the weekly schedule level and CNC represents the stock of failed conversations revealed after W. This model is outlined in Table 1.
Table 1 - Variables and data of analysis in the LPS (Alarcón and Zegarra, 2012)
Variable Description
Conceptual Operational
M; LA; R; BLG; W; CNC # of conversations at the
considered level
# of records in a database of the considered variable
BASIS FOR COMPARISON BETWEEN LPS AND TRADITIONAL CONTROL
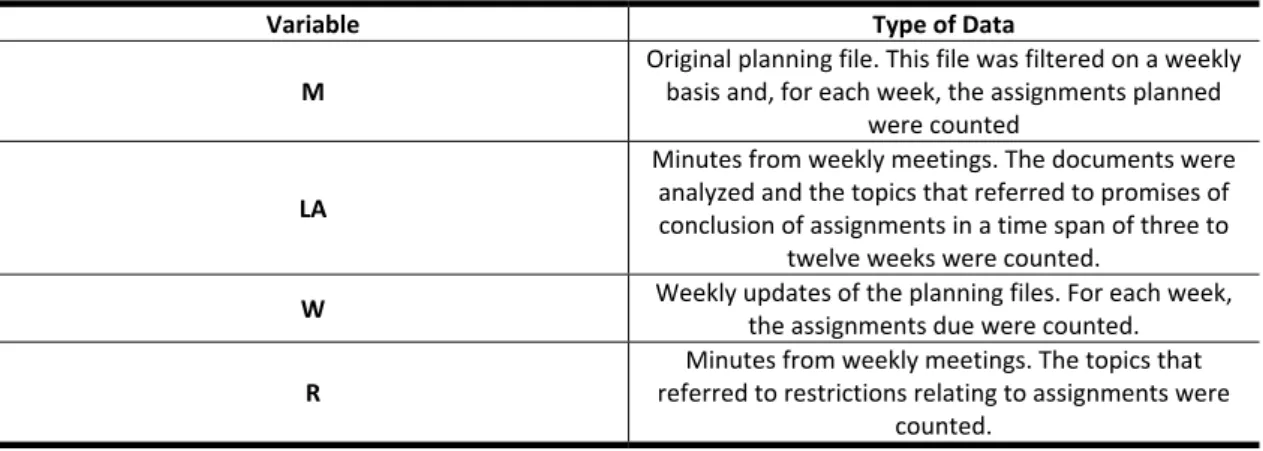
In order to allow the comparison of results between case studies A and B, a basis for comparison between LPS and traditional control was developed. As LPS utilizes different planning levels, it was necessary to fit the data in Case Study B to variables on which the analysis could be conducted. For this effect, planning files, updates of the baseline and weekly meeting minutes were used. Table 2 shows the type of data collected for the construction of the variables database for Case Study B. Variable BLG was disregarded on traditional control.
Table 2 - Type of data collected for variables M through R in traditional control
Variable Type of Data
M
Original planning file. This file was filtered on a weekly basis and, for each week, the assignments planned
were counted
LA
Minutes from weekly meetings. The documents were analyzed and the topics that referred to promises of conclusion of assignments in a time span of three to
twelve weeks were counted.
W Weekly updates of the planning files. For each week, the assignments due were counted. R
Minutes from weekly meetings. The topics that referred to restrictions relating to assignments were
The CNC and PPC variables are a bit harder to define in terms of direct correlation to current data elements found in projects in the construction stage. This is due to the very nature of these variables. On the one hand, the CNC variable relates to the identification and detection of problems. This report is generated after the weekly schedule. As such, the CNC database was constructed based on the number of incomplete assignments, according to the weekly schedule and PPC. On the other hand, in order to build the CNC database, the PPC must first be defined. To do so, the weekly PPC was calculated based on its own definition, i.e. number of assignments completed on the week stated divided by the total number of assignments made for the week. In practice, the method used for the attainment of PPC was based on the planning updates as follows:
On an N planning update, the assignments with predicted completion for week
X (referring to the week next to the considered update), registered on the latest baseline, were counted;
On the N+1 planning update the assignments effectively completed in week X
were counted.
This method is explicit in the following equation, which expresses the weekly PPC:
# , 1
#
Having the method for the attainment of the weekly PPC defined, it is possible to build the database for the CNC variable. In order to do so, for each week the number of CNC items considered was calculated according to the following equation:
# # 1
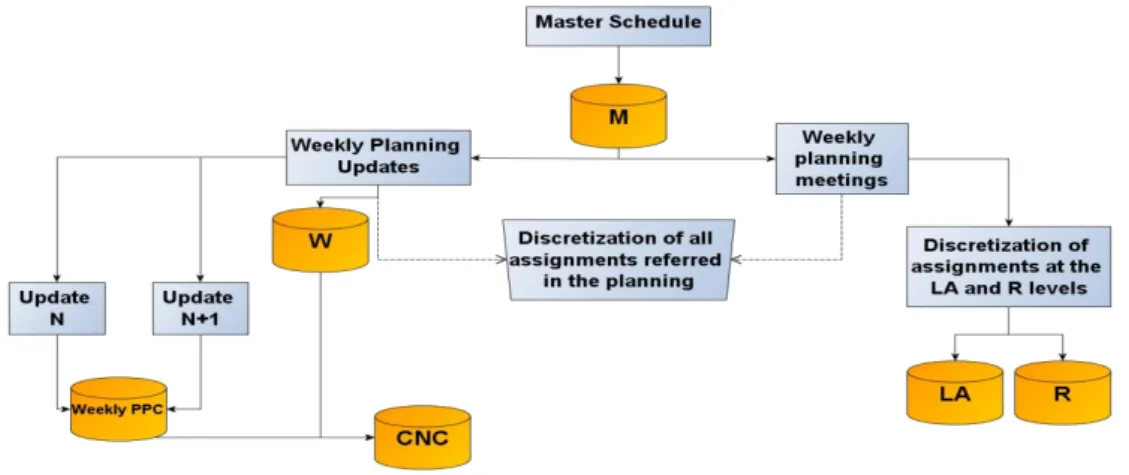
Figure 2 synthetically illustrates the correlation between the data elements currently found in construction projects and the construction of databases for each variable.
Figure 2 - Correlation between data elements and variables databases
CASE STUDY DESCRIPTION
A two case study design type was chosen. The case studies were named Case Study A – referring to the one using LPS – and Case Study B – conducted with traditional control methods.
CASE STUDY A
The scope of work of this case study is the periodic maintenance of a stretch of road of 100 Km in extension. It included the following activities: a fog seal, a chip seal, a double surface treatment, the production of aggregates for the treatments (quarry works, tertiary crushing and screening), the horizontal signalization (re-painting and cleaning), material logistics and the safety and traffic management work during the project. It was carried out in Peru, South America, by the civil works division of an experienced contractor in the country. The project was developed without accidents, it generated the expected profit, and was finished a week before the deadline. Regarding the operations, an average of 10% was subcontracted. The equipment was 100% rented from suppliers. The direct labor was hired completely by the main contractor. The management staff was provided by the main contractor. The main constraints were related to supplier reliability, mechanical availability and unexpected traffic management issues
CASE STUDY B
This case study relates to the rehabilitation and modernization of a naval shipyard, including the rehabilitation of two docks, remodeling of electrical networks and remodeling of fluid networks. The project was developed in Portugal, Europe and the activities included: repair of concrete in floor slabs, panels and top wall beam of slurry walls, joint sealing and finishing, earthworks, installation of electrical distribution chambers and electrodes, rehabilitation of draining pits and galleries and sewage works. Given the particular character of the rehabilitation of the concrete structure, the contracted work was largely exceeded by the actual work performed. The baseline was updated whenever additional work was detected. An average of 20% of the work was subcontracted. The main constraints were related to the arrival and permanence of ships on-site, as well as some weather related constraints in the winter.
RESULTS
The main results relate to the presence and quantification of the BWE in both case studies. Table 3 exhibits the BWE values found for each of the case studies. The level of BWE is present in both case studies, although it seems to be higher in case study A, which is unexpected.
Table 3 - BWE Indexes for Case Studies A and B
BWE INDEXES
UNITS OF ANALYSIS
OUTPUT:INPUT BWE PRESENCE OUTPUT:INPUT BWE PRESENCE
CASE STUDY A CASE STUDY B
LA:M 0.28 NO 0.23 NO
W:LA 6.84 YES 0.86 NO
R:LA 23.72 YES 1.03 YES
CNC:W 1.94 YES 13.32 YES
W:R 0.29 NO 0.83 NO
AVERAGE PPC 58% 50.6%
Whereas R:LA obtained in this case showed a BWE value of 23.72, the CNC:W was 1.94. In the causal model previously described, the R:LA is at a higher hierarchical level than CNC:W. Thus, variability is detected and is dealt with at the R:LA level, which then falls at CNC:W, the next hierarchical level.
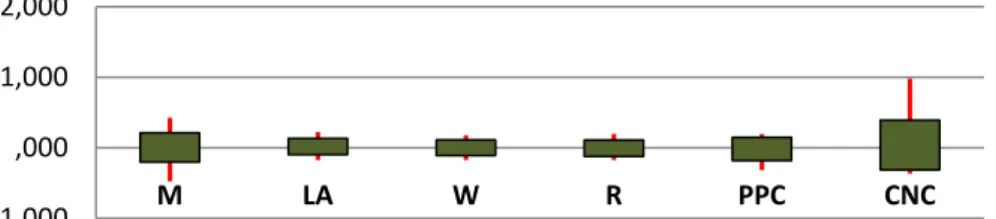
In case study B, the R:LA value obtained was 1.03. However, the value obtained in the next hierarchical level was significantly higher, as CNC:W reached 13.32. The BWE is only detected in the lowest hierarchical level, at the last stage of the process. This influenced the late completion of the project, and shows that the constraints for each assignment weren’t thoroughly analyzed prior to their acceptance in the weekly work plan. This is due to the macroscopic planning level existent in traditional control, which negatively impacts PPC and, consequently, generates causes of non completion of the plan. In similarity to the BWE’s behavior in case study A, also in case B the index varies from one planning level to the other in traditional control. This process describes the variability of the aggregation/disaggregation of items on each planning level. This behavior is exhibited in Figure 3, which depicts the maximum and minimum values, as well as percentile 90 and percentile 10 of the weekly variation rate (%) for each variable.
Figure 3 - Box Plot for Change of Conversations (%) along TPCS expressed in LPS terms
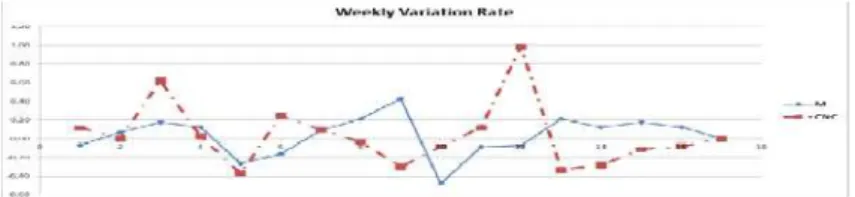
The gap between the maximum value and percentile 90 of the weekly variation rate of the M and CNC variables is evident, as well as the gap between the minimum value and percentile 10 of variable M. It appears that even though this gap exists due to the existence of isolated peaks in the weekly variation rates (as shown in Figure 4), the assignment distribution and the identification/detection of causes of non conformance processes could be optimized with a production control system more suited to this project.
‐1,000 ,000 1,000 2,000
Figure 4 - Weekly Variation Rate of variables M and CNC in Case Study B
HYPOTHESES CORROBORATION
The primary hypothesis (H1) was confirmed. It was possible to calculate the PPC based on data normally found in construction projects. It was also confirmed that the BWE exists in both LPS and TPCS (H2). The third hypothesis (H3), however, was not confirmed. Against initial expectations, the detected BWE was not higher in traditional control methods, even though the associated variability was much higher than in LPS.
COMPARATIVE ANALYSIS AND DISCUSSION
The presence of BWE in the W:LA unit was not detected in case study -B. This is due to the inexistence of an official look ahead planning level in traditional control. As such, not all master plan’s items in case study B were disaggregated onto an inferior planning level. This is reflected in the absence of BWE for the W:LA unit in case study B,. The value achieved for the CNC:W unit is in accordance with the reality of both projects. In case study A the planned schedule was in general met, allowing for a relatively low value of BWE. In case study B, due to the constant detection of additional work, the BWE value obtained was fairly high. This aspect raises the question of whether or not it would be advisable to revise the method used for the detection of additional work.
However, even though the BWE is present in a higher number of units in case study A, it appears that the presence of variability is quantitatively much higher in case study B. This situation is exhibited in Figure 5, on which the weekly variation rate reaches its extreme peaks for the variables of case study B.
Figure 5 - Aggregation and disaggregation of variability (LPS and Traditional)
It also appears that the BWE is not fully detected by the PPC. A project performance analysis based only on the BWE values would indicate that case study B performed better than case study A – which couldn’t be farther from the truth. Figure 6 shows the weekly variation rate of different variables in the LPS and traditional case studies.
‐1,000 ,000 1,000 2,000
Figure 6 - Weekly variation rates
BWE USABILITY
The utilization of the BWE for both case studies identified a detection of variability at a higher hierarchical level in case study A, where LPS was used. In addition, it was evidenced that variability was effectively addressed at that level, as the subsequent levels showed consistently lower values of BWE. In case study B, variability was only detected in the lowest hierarchical level, at the last stage of the project. This was too late for any corrections.
The findings of this study suggest that the BWE index can be used in monitoring the performance of LPS’s sub-systems and in monitoring the level of detail to consider in the planning of projects using traditional control methods. As such, it is necessary to adopt a benchmark value for the index. Alarcón and Zegarra (2012) suggest that the value of one would indicate an ideal pull situation. A higher value would point towards a push situation, on which the existing variability is excessive, and a lower value than one would indicate a lacking, unbalanced state. The term ideal value is here understood as a reference that may never be achieved (the ideal pull). It is, however, the mathematically correct value. On the other hand, the optimal BWE value describes the real performance of the system. It characterizes the optimal point of performance in a certain kind of project. Given the singular nature of construction, each project differs from one another and, as such, the optimal rate of throughput differs (Huang and Kusiak, 1998). The balanced BWE values for the different sub-systems/levels of planning should consider a band of values, allowing for some push and/or lack.
Table 4 exhibits Alarcón and Zegarra’s (2012) suggestion for the use of the BWE in LPS.
Table 4 - BWE usability in the LPS
UNIT MONITOR RESPONSE CAPABILITY TO
LA:M Pulling of operations (Volume)
W:LA Assignment of weekly work volume
R:LA Identification of constraints
W:R Generation of assignments about constraints
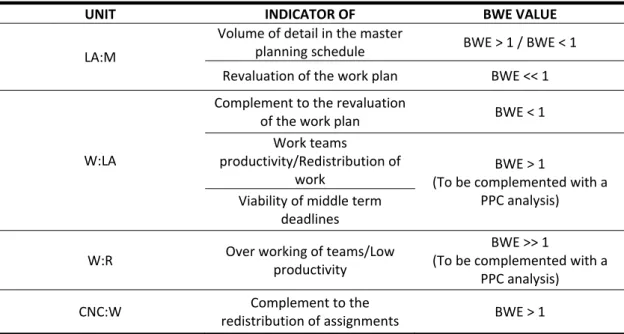
As for traditional production control, the BWE index is suggested as an indicator that allows for the perception of the need of implementing more detailed levels of planning in the production stage of projects. Depending on the considered unit, this indicator can be used as criteria for taking decisions related to the volume of detail in planning schedules, the probability of keeping up with deadlines, the revaluation of the volume of work considered in the early stages of the project or the over/under amount of work designated to production teams. Table 5 shows the utility of the index in traditional control.
Table 5 - BWE utility in traditional control
UNIT INDICATOR OF BWE VALUE
LA:M
Volume of detail in the master
planning schedule BWE > 1 / BWE < 1
Revaluation of the work plan BWE << 1
W:LA
Complement to the revaluation
of the work plan BWE < 1
Work teams
productivity/Redistribution of work
BWE > 1
(To be complemented with a PPC analysis) Viability of middle term
deadlines
W:R Over working of teams/Low
productivity
BWE >> 1
(To be complemented with a PPC analysis)
CNC:W Complement to the
redistribution of assignments BWE > 1
In any of the stated units, an extremely high or extremely low value of BWE should be indicative of the necessity of implementing more detailed levels of planning, as well as the generation of periodic reports about constraints, causes of non conformance or other factors that might influence the variability inherent to the project. In this manner it is suggested that, both for LPS and TPCS, the BWE can be used in construction projects as a KPI, equipping the stakeholders with a deeper control of variability. Given that the use of KPI’s is only possible with the definition of a benchmark, the value of one is proposed, as long as this value is associated with a margin that allows for the lack/push band previously mentioned.
CONCLUSIONS
change of the control philosophy of traditional control methods. It can be used in the control of variables that have direct influence in the performance or the keeping of deadlines in the project, as well in the identification of management aspects to improve. In either LPS or traditional control, it is shown that the BWE can be used as a KPI by applying a benchmark that brings the ideally balanced situation closer to a pull situation. Finally, the use of the BWE evidenced the higher capacity of LPS to detect and deal with variability at earlier stages of the project, when compared with traditional production control methods.
REFERENCES
ALARCÓN, L.; DIETHELM, S.; ROJO, O. and CALDERÓN, R. - Assessing the impacts of implementing lean construction. Revista ingeniería de construcción, vol. 23, págs. 26-33. 2008.
ALARCÓN, L. and ZEGARRA, O. - Identifying the Bullwhip Effect of the Last-Planner Conversations During the Construction Stage. In : Proceedings of the 20th annual conference of the International Group for Lean Construction, San Diego, U.S.A. 2012.
ALSEHAIMI, A.; TZORTZOPOULOS, P. and KOSKELA, L. - Last planner system: Experiences from pilot implementation in the Middle East. In : Proceedings of the 17th Annual Conference of the International Group for Lean Construction, Taipei, Taiwan, pp.53-65. July, 2009.
BALLARD, G. and HOWELL, G. - Shielding production: Essential step in production control. Journal of Construction Engineering & Management, vol. 124, nº 1, págs. 11. 1998.
BALLARD, G. and HOWELL, G. - An Update on Last Planner. In : Proceedings of the 11th annual conference of the International Group for Lean Construction, U.S.A. 2003.
CACHON, G. P.; RANDALL, T. and SCHMIDT, G. M. - In search of the bullwhip effect. Manufacturing & Service Operations Management, vol. 9, nº 4, págs. 457-479. INFORMS, 2007.
HOPP, W. J. and SPEARMAN, M. L. - Factory physics., McGraw-Hill Irwin Irwin, 2008.