Fábio Joel Pereira Fernandes
Licenciatura em Engenharia FísicaIon-beam Sources Based on
Superionic Solid Electrolytes
Dissertação para obtenção do Grau de Mestre em
Engenharia Física
Orientador: Alexander Borisovich Tolstoguzov, Doutor, Faculdade de Ciências e Tecnologia da Universidade Nova de Lisboa
Júri
Presidente: Doutora Maria Isabel Simões Catarino Arguente: Doutor Reinhard Horst Schwarz
Ion-beam Sources Based on Superionic Solid Electrolytes
Copyright © Fábio Joel Pereira Fernandes, Faculdade de Ciências e Tecnologia, Universi-dade NOVA de Lisboa
A Faculdade de Ciências e Tecnologia e a Universidade NOVA de Lisboa têm o direito, perpétuo e sem limites geográficos, de arquivar e publicar esta dissertação através de exemplares impressos reproduzidos em papel ou de forma digital, ou por qualquer outro meio conhecido ou que venha a ser inventado, e de a divulgar através de repositórios científicos e de admitir a sua cópia e distribuição com objetivos educacionais ou de inves-tigação, não comerciais, desde que seja dado crédito ao autor e editor.
Este documento foi gerado utilizando o processador (pdf)LATEX, com base no template “unlthesis” [1] desenvolvido no Dep.
Ac k n o w l e d g e m e n t s
I want to thank the following people for their significant help during my thesis work:
Dr. Alexander Tolstoguzov, for the supervision, support and encouragement. A true mentor who’s advice I will keep for the rest of my life.
Professor Orlando Teodóro, for support and inspiration.
All members of the CEFITEC (Centre of Physics and Technological Research), Profes-sor Moutinho, João, Wilson, for their suggestions, interest and company.
Professor Reinhard Schwarz and Dr. Rachid Ayouchi at IST, for guidance during the PLD experiments and their encouraging good mood.
Nuno Costa at REQUIMTE, for his assistance with XRD analysis and willingness to help.
The people at the CENIMAT lab, for helping with sample analysis dozens of times.
Professors João Paulo Casquilho, Ana Cristina Silva, Paulo Ribeiro and Maria de Fá-tima Raposo, for their helpful suggestions and interest in my results.
Mr. Faustino and Mr. Mesquita, for their help and company during mechanical work.
Filipe Bernardo, Gonçalo Barreto, Cláudia Oliveira and Ricardo Moreira, for sharing the road with me along the past five years. They are the best colleagues I could ask for.
My parents, for their patience.
My fiancée, Inês, for her unwavering love. For being my endless inspiration and relentless motivation.
A b s t r a c t
An ion emitter consisting of a sharp silver tip covered inRbAg4I5 solid electrolyte film has been developed and studied. An accelerating potential is applied and Ag+ ions are emitted from the tip’s apex by field evaporation. The emitted ions are collected by a Faraday cup, producing a current on the pico/nanoampere level which is read by an electrometer.
The tips were produced mechanically by sandpaper polishing. The sharpest tip pro-duced had a 2.4µmapex radius. Two deposition methods were studied: thermal vacuum and pulsed laser deposition. The best tip produced a peak current value of 96nAat 180oC, and a quasi-stable 4nAemission current at 160oC, both using an extraction potential of
10kV.
The emission dependence on time, temperature and accelerating potential has been studied. Deposited films were characterized by X-ray diffraction (XRD), profilometry,
optical and Scanning Electron Microscope (SEM) and Secondary Ion Mass Spectroscopy (SIMS) measurements. Several ion emitters were developed, the latter ones were all able to maintain stable high ion emissions for long periods of time.
This investigation was a continuation of an ongoing project backed by the European Space Agency, with the objective of making a proof of concept of this kind of ion emitter with potential application on ion thrusters for orbiting satellites.
Going forward, it would be interesting to make a finer analysis of the electrolyte’s conductivity at high temperatures, explore Wien Effect-based emission and to further
develop a multi-tip ion emitter prototype.
R e s u m o
Foi desenvolvido e estudado um emissor de iões constituído por uma ponta afiada de prata (tip) coberta por um filme de electrólito sólidoRbAg4I5. É aplicado um potencial de aceleração de forma a emitir iões Ag+ a partir do vértice da tip por evaporação de campo. Os iões emitidos são detectados por um copo de Faraday, produzindo uma corrente no nível dos pico/nanoamperes que é então lida por um electrómetro.
As tips foram produzidas mecanicamente por polimento a lixa. Das tips produzidas, a mais afiada apresentou 2.4µmde raio no vértice. Foram estudados dois métodos de deposição: deposição térmica em vácuo e deposição por laser pulsado. A melhor tip produziu uma corrente com valor pico de 96nA a 180oC, e uma corrente de emissão
quasi-estável de 4nAa 160oC, ambos com um potencial aplicado de 10kV.
Foi estudada a dependência da corrente emitida com o tempo, a temperatura e o potencial de aceleração. Os filmes depositados foram caracterizados por difração raio-X (XRD), profilometria, microscópio óptico, microscópio electrónico de varrimento (SEM) e espectrometria de massa por iões secundários (SIMS). Foram desenvolvidos vários emis-sores iónicos, sendo que os últimos foram capazes de manter emissões iónicas estáveis por longos períodos de tempo.
Esta investigação foi a continuação de um projeto em curso suportado pela Agência Espacial Europeia (ESA), com o objetivo de criar uma "prova de conceito" deste tipo de emissor iónico com potenciais aplicações em propulsores iónicos para satélites em órbita.
Como próximo passo, seria interessante analisar mais detalhadamente a condutivi-dade do electrólito em altas temperaturas, assim como desenvolver um protótipo de emissor iónico multi-tip.
C o n t e n t s
List of Figures xv
List of Tables xvii
1 Introduction 1
1.1 Emitter System. . . 1
1.2 Solid Electrolytes . . . 2
1.2.1 Ion Mobility . . . 3
1.2.2 RbAg4I5 . . . 4
1.3 Ag+ Ion Emission . . . 5
1.3.1 Field Evaporation . . . 6
2 Characterization Processes 7 2.1 X-Ray Diffraction (XRD) . . . 7
2.2 Profilometry . . . 9
2.3 Optical Microscope . . . 9
2.4 Scanning Electron Microscope (SEM) . . . 10
2.5 Secondary Ion Mass Spectroscopy (SIMS) . . . 10
3 Production Methods 13 3.1 Silver Tips . . . 13
3.2 RbAg4I5 . . . 16
4 Deposition Techniques 19 4.1 Thermal Vacuum Deposition (TVD) . . . 19
4.2 Pulsed Laser Deposition (PLD). . . 20
5 Experimental Set-up 23 5.1 Emitter System Overview. . . 23
5.2 DC Power Sources . . . 24
5.3 Electrometer . . . 25
5.4 Data Acquisition System . . . 26
CO N T E N T S
6.1 Results with TVD . . . 28
6.1.1 Volt-Ampere Characteristics (V-I) . . . 28
6.1.2 Current-Temperature Dependence . . . 29
6.1.3 Current-Time Dependence . . . 30
6.1.4 Determining the Number of Emitted Ions . . . 32
6.2 Results with PLD . . . 33
6.2.1 Volt-Ampere Characteristics (V-I) . . . 33
6.2.2 Current-Temperature Dependence . . . 33
6.2.3 Current-Time Dependence . . . 34
7 Conclusions 39 7.1 TVDversusPLD . . . 40
7.2 Ionic Conduction Within the Emitter System . . . 41
7.3 The Future . . . 42
7.3.1 PLD Technique . . . 42
7.3.2 Set-up and Emitter System . . . 42
7.3.3 Wien Effect. . . 42
Bibliography 45
L i s t o f F i g u r e s
1.1 Schematic representation of the emitter system. . . 2
1.2 Illustration of a unit cell of an ionic crystal with Frenkel and Schottky defects 3 1.3 Schematic representation of the conduction mechanisms around the transition temperatureTt. . . 4
1.4 Ionic conductivities of several AgI-type solid electrolytes . . . 5
2.1 Bragg’s Law reflection . . . 8
2.2 RIGAKU X-Ray Diffractometer, model MiniFlex II. . . 8
2.3 Ambios XP-Plus 200 Stylusprofilometer. . . 9
2.4 Carl Zeiss AURIGA CrossBeam (FIB-SEM) Workstationpresent at the CENIMAT research centre. . . 10
2.5 Schematic representation of secondary ion extraction during SIMS technique. 11 2.6 TOF-SIMSVG Ionex IX23LS. . . 11
3.1 Silver pieces cut from a high purity silver rod. . . 14
3.2 Example positioning of silver rod and sandpaper disc, with schematic repre-sentation of the interaction angle to obtain a desired tip apertureθ. . . 14
3.3 Two finalized tips before deposition. . . 15
3.4 Opened grinding bowl after 30 minutes of dry grinding ofRbAg4I5electrolyte powder. . . 16
3.5 Superimposed XRD analysis spectra of the obtained electrolyte powder before and after the annealing process. . . 17
4.1 Complete thermal vacuum deposition system. . . 20
4.2 Creation of a plume during the PLD process. . . 21
4.3 PLD elements and set-up inside the vacuum chamber. . . 21
4.4 SEM imaging (1000x) of theRbAg 4I5film deposited on one of the tips’ surface. Insert in the upper right corner (50000x) shows crystalline faceting of the film. 22 5.1 TOF-SIMSVG Ionex IX23LSand the two electrodes responsible for emission. 24 5.2 Tip heating system. . . 24
L i s t o f Fi g u r e s
6.1 Mass spectra obtained from nickel foil before and after being exposed to
ion-beams emitted from TVD and PLD produced emitters. . . 27
6.2 (TVD) V-I curve at 156℃. . . 29
6.3 (TVD) Evolution of ionic current with increase in temperature. . . 30
6.4 (TVD) 6-hour stability test at 160℃under 10 kV. . . 31
6.5 (TVD) 15-hour stability test at 150℃under 10 kV. . . 31
6.6 Comparison of the Serie 5 Tip #3’s apex before and after sustained emission. 32 6.7 (PLD) V-I curve at 195℃.. . . 34
6.8 (PLD) Evolution of ionic current with increase in temperature. . . 35
6.9 (PLD) Emission measurements at heating and cooling of the emitter system. 35 6.10 (PLD) 25-hour stability test at 195℃under 10 kV. . . 36
6.11 (PLD) 100-hour stability test at 195℃under 10 kV.. . . 37
L i s t o f Ta b l e s
3.1 Properties of all 17 produced tips. . . 15
6.1 Estimation of the ratio of Ag and Rb atoms present in the nickel foil. . . 28
C
h
a
p
t
e
r
1
I n t r o d u c t i o n
An ion thruster is one of several types of space propulsion, which uses ion-beams to accelerate a spaceship or an artificial satellite. The use of electron bombardment ion thrusters in space began in the United States upon the Space Electric Rocket Test I in 1964 [1].
Ion thrusters can accelerate ions either by electrostatic or electromagnetic force. Elec-trostatic ion thrusters use Coulomb force, accelerating the ion in the direction of the energy field. From the difference in potential of the electric field results the ion’s kinetic
energy.
Solid-state ionic conductors are an attractive element for ion thrusters because they allow the production and extraction of energetic ion-beams, producing thrust without the complications of a plasma discharge chamber, common to present day thrusters [2]. The extraction of ions by field evaporation offers potential for reductions in ion thruster
system cost and complexity.
Bright focused ion-beams are also useful in many other applications, such as ion lithography [3], analytical TOF-SIMS [4], micro and nanotechnology [5], to name a few.
The main goal of this project is to develop and refine a field evaporation ion-beam source based on a superionic solid electrolyte, in continuation of the work developed by D. Martins who was able to prove its viability [6].
This project is backed by the European Space Agency.
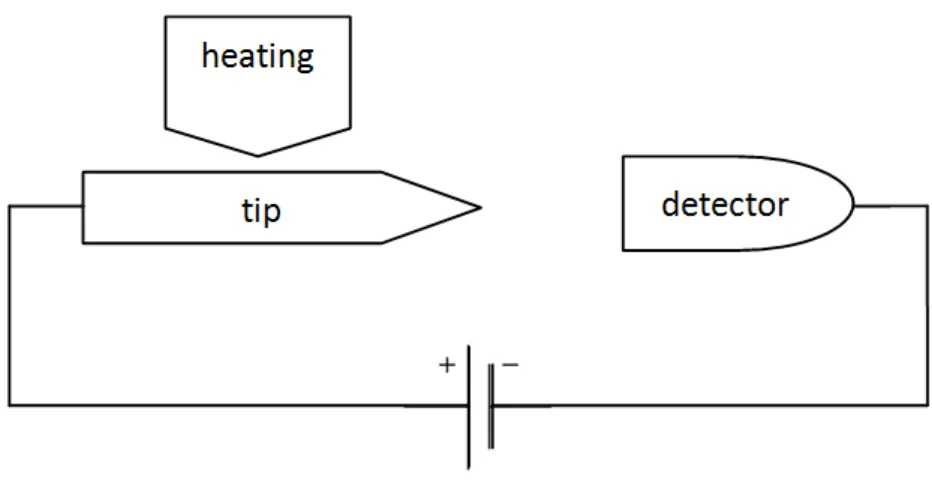
1.1 Emitter System
C H A P T E R 1 . I N T R O D U C T I O N
The system is completed with an high voltage feeder, a detector and a heating de-vice. Everything is maintained under high-vacuum conditions. A potential difference is
established between tip and detector (Figure1.1).
Figure 1.1: Schematic representation of the emitter system.
However, several different aspects are needed to be taken into account to maximize
current:
• tip fabrication method
• shape and length of the tip
• aperture and radius of the tip’s apex
• which solid electrolyte to use
• solid electrolyte production and deposition method
• applied potential and temperature
• distance between tip and detector
1.2 Solid Electrolytes
Solid electrolytes have an intermediate nature between crystalline solids with a regular immobile structure and liquid electrolytes which present fully mobile ions. In solid electrolytes, ions move through a rigid structure.
Although amorphous solid electrolytes have some advantages over crystalline ones, they present lower ionic conductivity for the same movable ions and temperature ranges. As such, this project is focused on crystalline electrolytes with Ag+ ion current.
1 . 2 . S O L I D E L E C T R O LY T E S
1.2.1 Ion Mobility
With the electrolyte in contact with a silver reservoir, Ag+ ions can travel from it into the electrolyte, replenishing those emitted from the apex.
This is only possible due to crystallographic point defects present in ionic crystals, which are necessary for ion transport [7]. Point defects occur only at or around a single lattice point, existing at any non-zero temperature. As temperature rises, these defects come from the minimization of free energy by increasing of entropy.
For an ion to move through a crystal it must hop from an occupied site to a vacant one. The two simplest types of defects are Schottky and Frenkel defects, as shown in Figure 1.2.
Figure 1.2: Illustration of a unit cell of an ionic crystal with Frenkel and Schottky defects [8].
The Schottky defect refers to a pair of ions (one cation and one anion) that disappear leaving their positions vacant. The Frenkel defect is the result of a single ion missing its regular position and wandering in interstitial sites.
The ease with which an ion can jump to a neighbouring site is controlled by the activation energy. The activation energy indicates the free energy barrier an ion has to overcome to successfully jump between sites. The ionic conductivity of a crystal, σ, depends exponentially on the activation energy, Ea, as is usually described by an
C H A P T E R 1 . I N T R O D U C T I O N
σ = B T exp
−Ea
kT
(1.1) wherek is Boltzmann’s constant, andBis a material-specific pre-exponential factor which contains all remaining factors that influence ionic conductivity (i.e., charge, mean jump distance, mean jump frequency, crystal imperfections etc.).
Equation 1.1 works forT > Tt, Tt being the transition temperature of the material. This is because ion transport is thermally activated through conducting channels within grains and subgrains and their respective boundaries. The long-time relaxation effect
observed aroundTtleads to the formation of a subsurface superionic phase, represented schematically in Figure1.3.
Figure 1.3: Schematic representation of the conduction mechanisms around the transition temperatureTt [9].
1.2.2 RbAg4I5
Out of all crystalline superionic conductors, the best Ag+ conductivity at room temper-ature has been measured with theRbAg4I5electrolyte (Figure 1.4). RbAg4I5 possesses high ion conductivity with reports of 2.1×10⁻¹S/cm[10][11]. It also presents negligible
electronic conductivity.
The RbAg4I5’s highly conductive phase transition occurs at 209K [13], well below room temperature. It’s high ionic conductivity is in part due to extensive disorder that exists within it’s structure due to partial Ag+ ion occupancy [14].
1 . 3 . AG + I O N E M I S S I O N
Figure 1.4: Ionic conductivities of several AgI-type solid electrolytes [12].
RbAg4I5is classified as aType IIIsuperionic conductor: a solid which has a "molten" sub-lattice of mobile ions [7]. Silver ions are highly distributed over the crystallographic sites available to them. Iodine and rubidium ions create a stable lattice while low activa-tion energy for Ag+ hopping allows the ions to translate between sites easily [15]. The free energy associated with the regular and interstitial sites are very similar. As such, they are almost equally favourable for occupancy of ions. The conduction mechanism is mostly interstitial.
RbAg4I5 has numerous technological applications. It has been used in solid-state batteries for more than 40 years [16]. These batteries present good electrochemical char-acteristics for use in medical devices, such as pacemakers [17].
Another application ofRbAg4I5is in the production of thin silver nanowires [18]. This is only possible becauseRbAg4I5is a solid state mean for the diffusion of silver ions. It
is capable of being oxidized when in contact with silver electrodes set with a potential difference.
1.3 Ag+ Ion Emission
C H A P T E R 1 . I N T R O D U C T I O N
1.3.1 Field Evaporation
Field evaporation is a process by which extraction of surface atoms occurs under the effect
of a very high local field [21].
The electric field at the apex of an emitter system is of the 109
−1010V m−1order. An
electric field of this magnitude is enough for field emission of most metals, alloys and semiconductors. The electric field at the apex of a tip with radiusris calculated following equation1.2[22]:
E=V /(βr) (1.2)
whereV is the potential applied to the tip andβis a coefficient taking into account
the non-spherical shape of the tip’s apex (usually assumes values close to 1). However, this coefficient may change during experimentation due to the emission of atoms at the
tip’s apex.
In field evaporation mobile ions are evaporated without ionization, contrary tofield emission.
Field emission of ions is a two-step process: (1) escape of atoms from the surface and (2) ionisation when they move away [23].
However, in the case of solid electrolytes there is no ionisation step as ions are being extracted form the tip, accelerated away by the intense electric field. During this project it is assumed that only lattice ions are being emitted, since there is a negligible amount of extraneous ions present in the electrolyte material.
C
h
a
p
t
e
r
2
C h a r a c t e r i z a t i o n P r o c e s s e s
The present chapter describes the basics of the sample characterization process by X-Ray Diffraction, profilometry, optical microscope, Scanning Electron Microscope and
Secondary Ion Mass Spectroscopy analysis.
2.1 X-Ray Di
ff
raction (XRD)
Crystal structures (such as the one present inRbAg4I5) are usually determined by x-ray crystallography techniques. This is because the distances between atoms in crystals are of the same magnitude order as x-ray wavelengths. X-rays are a form of electromagnetic radiation whose wavelengths are in the 0.1nm(1 ˚A) magnitude [24].
Powder X-ray diffraction (XRD) is probably the most commonly used crystallography
technique. X-rays are generated by a cathode ray tube, filtered to produce monochromatic (single wavelength) radiation and focused toward the crystalline sample [25].
The interaction between incident x-rays and the sample produces a diffracted ray,
when it satisfies Bragg’s Law:
nλ= 2dsinθ (2.1)
wherenis an integer (the "order" of reflection),λis the wavelength of incident x-rays, d is the interplanar spacing of the crystal and θis the angle of incidence (Bragg’s angle). A simple schematic of the diffraction mechanism is presented in Figure2.1.
Since diffracted beams are only observed when Equation2.1is verified, it is possible
to obtain diffraction peaks in the XRD spectra [24]. By scanning a desiredθrange we can
obtain characteristicd spacingpeaks for each crystalline material.
C H A P T E R 2 . C H A R AC T E R I Z AT I O N P R O C E S S E S
Figure 2.1: Bragg’s Law reflection. The diffracted x-rays show constructive interference
when the distance between paths ABC and A’B’C’ differs by an integer number of
wave-lengths (λ) [26].
Figure 2.2: RIGAKU X-Ray Diffractometer, model MiniFlex II.
2 . 2 . P R O F I LOM E T RY
This equipment was available at the REQUIMTE Analysis Lab, at the UNL-FCT’s Chemistry Department.
2.2 Profilometry
During this project, surface profilometry was used to measure the thickness of deposited electrolyte films. With the use of a profilometer it is possible to measure a surface’s profile and quantify its roughness.
Regular surface contact profilometers consist of a diamond stylus moving vertically in contact with a surface (at a fixed contact force) and then laterally across a specified distance. As opposed to optical profiling, contact profiling isn’t sensitive to surface re-flectance or colour, and has better resolution as well.
In the present project the profilometer used was aAmbios XP-Plus 200 Stylus(Figure 2.3), a computerized, high-sensitivity surface profiler that measures roughness, waviness and step height. It has a very low contact force (loads as small as .03 mg) and a low inertia stylus assembly [27].
Figure 2.3: Ambios XP-Plus 200 Stylusprofilometer.
This equipment was available at the CENIMAT research centre, at UNL-FCT.
2.3 Optical Microscope
An optical microscope is an instrument composed of lenses that produces an enlarged image of a sample placed in the focal plane using light.
C H A P T E R 2 . C H A R AC T E R I Z AT I O N P R O C E S S E S
allowed us to capture live image and sharp still images using a computer.
2.4 Scanning Electron Microscope (SEM)
A Scanning Electron Microscope (SEM) is a microscope with very high resolution and magnification (up to 106x), that employs electron beams instead of light (like common optical microscopes use). A finely focused beam of electrons is scanned across the sam-ple’s surface, and the reflected electrons are measured and displayed on a cathode-ray screen to produce image [28]. It makes the three-dimensional structure of small objects visible, allowing for grain textural examination.
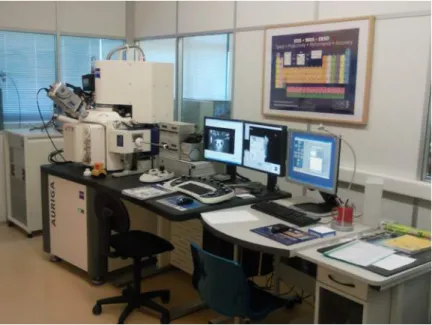
SEM images used during this project were obtained using aCarl Zeiss AURIGA Cross-Beam (FIB-SEM) Workstation(Figure2.4).
Figure 2.4:Carl Zeiss AURIGA CrossBeam (FIB-SEM) Workstationpresent at the CENIMAT research centre.
This equipment was also available at the CENIMAT research centre, at UNL-FCT.
2.5 Secondary Ion Mass Spectroscopy (SIMS)
TOF-SIMS (Time Of Flight - Secondary Ion Mass Spectroscopy) is a surface analysis method, which combines primary ion beam sources with time-of-flight (TOF) mass analy-sis of secondary ions. It is the most sensitive commonly-used surface analyanaly-sis technique. In SIMS the sample’s surface is bombarded by high energy ions (usually in the 1-30 kV range). Neutral and charged species are ejected from the surface as a result. Although these include electrons, atoms, clusters and molecules, only charged particles (ions) are analysed by a TOF mass spectrometer (Figure2.5).
2 . 5 . S E CO N DA RY I O N M A S S S P E C T R O S CO P Y ( S I M S )
Figure 2.5: Schematic representation of secondary ion extraction during SIMS technique [29].
With TOF-SIMS the primary ion beam is pulsed to allow the ions to be dispersed over time from the moment of impact. Very short pulse durations mean high mass resolution. When the pulse of primary ions hits the surface, pulses of secondary ions are acceler-ated to a given potential such that all ions have the same kinetic energy. This means that lighter ions will have higher velocities and will reach the final detector before heavier ones. Hence ions reach the detector sequentially by order of their masses.
However, it is possible that some ions are emitted from the surface with different
kinetic energies. To prevent loss of resolution, time-of-flight analysers use energy com-pensation methods. For example, in TOF-SIMS analysers, ions with higher energy travel along longer trajectories than ions with lower energy. This means that all ions with the same mass reach the detector simultaneously, independently of their initial energy.
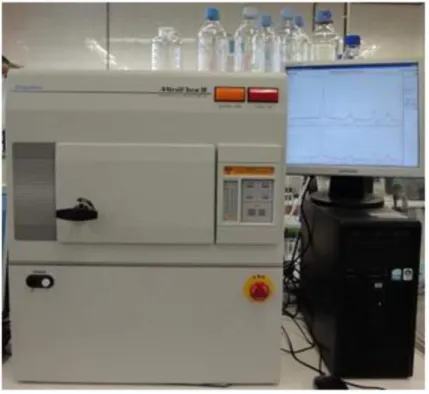
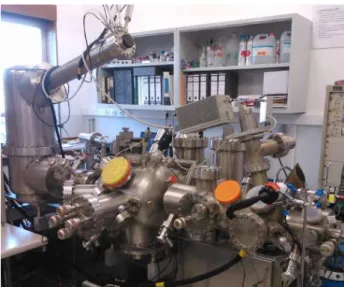
In the present project, an upgradedVG Ionex IX23LS ToF-SIMS[30] system was used (Figure2.6). It includes two primary beam sources: gallium liquid metal ion-beam source and duoplasmatron. The first one is used in static mode and the second one in dynamic mode. Dynamic mode removes material from the top surface layers in order to obtain spectra of the elemental depth distribution (depth profiling).
C
h
a
p
t
e
r
3
P r o d u c t i o n M e t h o d s
This chapter describes the basics of the production methods for silver tips andRbAg4I5 electrolyte material.
3.1 Silver Tips
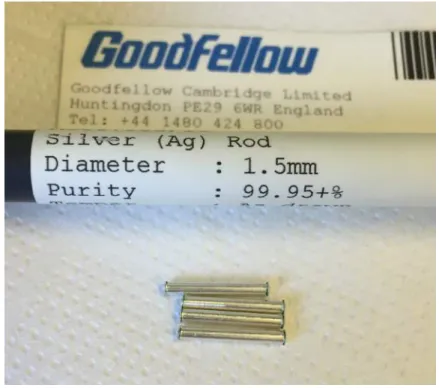
Silver tip production starts off by cutting a silver rod (99.95+% purity) of the desired
diameter in pieces of the desired length, about 13mmin our case (Figure3.1). The present project used silver rods fromGoodfellow.
These smaller rods are mechanically polished by super-fine micro-grit sandpaper (P1000 grit, average particle diameter of 18.3µm). For this purpose, the small cylindrical pieces of silver are mounted on aMyford ML7-Rlathe. P1000 sandpaper discs are used in connection with aDremel Model 398rotary tool.
The rotary tool is fixed so that the sandpaper disc engages the silver rod at an angle half the future tip’s desired apex aperture,θ(Figure3.2).
After mechanical treatment, the tips are cleaned in an ultra-sonic bath and annealed in high vacuum conditions. The annealing temperature,Tan, is chosen in accordance with
the recommendations for vacuum annealing of pure metals [31], following the undermen-tioned equation:
Tan≈0.6·Tmp (3.1)
whereTmp is the metal’s melting point (Tmp(Ag) = 961℃) [32].
A total of 17 tips were produced and polished (span across 6 tip production series), 11 were used to emit silver ions. They are all presented in Table3.1.
C H A P T E R 3 . P R O D U C T I O N M E T H O D S
Figure 3.1: Silver pieces cut from a high purity silver rod.
Figure 3.2: Example positioning of silver rod and sandpaper disc, with schematic repre-sentation of the interaction angle to obtain a desired tip apertureθ.
3 . 1 . S I LV E R T I P S
basis of all results presented in this thesis, mainly Serie 5’s Tip #3 and Serie 6’s Tip #2 (Figure3.3).
Table 3.1: Properties of all 17 produced tips.
Rodd Series Tip # Aperture Apex radius (µm) Deposition method
2mm Serie 1 1 45°
2 90°
Serie 2 1 30° TVD
2 45° TVD
3 60° TVD
Serie 3 1 20° TVD
2 30°
3 35° TVD
1.5mm Serie 4 1 40°
2 30°
Serie 5 1 37° 15.7 TVD
2 30° 25.9 TVD
3 33° 6.9 TVD
Serie 6 1 30° 7.5 PLD
2 31° 2.4 PLD
3 32° 7.4
4 33° 7.5
Total 17
(a) Tip #3 from Serie 5, before TVD. (b) Tip #2 from Serie 6, before PLD.
C H A P T E R 3 . P R O D U C T I O N M E T H O D S
3.2
RbAg
4I
5RbAg4I5 production starts from initial powders: rubidium iodide,RbI (99.9% purity), and silver iodide,AgI (99.999% purity), both from Sigma-Aldrich.
The procedure for preparing the final electrolyte powder followed the one presented by Peng et al. [33], which uses a high-energy-ball-milling process for the synthesis of RbAg4I5in its crystalline phase.
Both powders were preliminarily mixed in a 80AgI·20RbI(mol%) ratio. The resulting
mixture was introduced into a 45mlgrinding bowl made of agate (SiO2), along with 180 5mm-diameter agate grinding balls (Figure3.4).
Mechanical milling was conducted by use of the FRITSCH Planetary Micro Mill PUL-VERISETTE 7ball-milling apparatus. The main disk speed was set at 380 rpm, and was left to grind for 60 minutes.
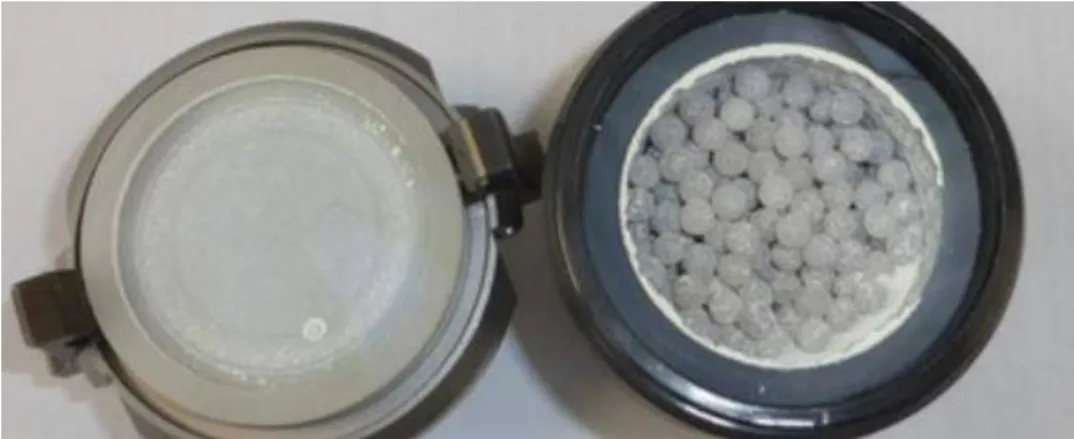
Figure 3.4: Opened grinding bowl after 30 minutes of dry grinding ofRbAg4I5electrolyte powder.
The resulting material is then annealed at 150℃for one hour, in accordance with
Equation3.1and [34].
Annealing is an extremely important step in the production ofRbAg4I5electrolyte, as the simple mixture ofRbI andAgI will produce the non-conductiveRb2AgI3compound. On the other hand, the annealing process produces the highly conductiveRbAg4I5phase. This is backed by XRD measurements, as shown in Figure3.5.
Further analysis concludes that 91.05% of the produced powder corresponds to the RbAg4I5phase after annealing.
3 . 2 . RbAg4I5
10 20 30 40 50 60 70 80
0 1000 2000 3000 4000 5000 6000 7000
In
te
n
s
it
y
(
C
o
u
n
ts
)
2theta (degrees)
Before Annealing After Annealing
Major RbAg4I5 peaks
C
h
a
p
t
e
r
4
D e p o s i t i o n Te c h n i q u e s
This chapter describes the basics of the thermal vacuum and pulsed laser electrolyte deposition techniques.
4.1 Thermal Vacuum Deposition (TVD)
The Thermal Vacuum Deposition (TVD) technique consists in heating the electrolyte powder to be deposited until evaporation. The produced material vapor condenses in the form of a thin film on the silver tips’ surface. Under high vacuum conditions the mean free path of evaporated atoms is of the same (or higher) order as the vacuum chamber dimensions. This means that the particles travel in straight lines from the source towards the substrate [35].
For this purpose an evaporator was built. It is consisted of a 185mm3 pure silver reservoir and a ceramic crucible equipped with Kanthal (FeCrAl) heating resistance wire and a K-type (chromel−alumel) thermocouple (Figure4.1a). The assembled evaporator
was mounted on a NW 35CF flange and placed into the introduction chamber of an upgraded TOF-SIMSVG Ionex IX23LS[30].
The chamber is evacuated using an Edwards E04diffusion pump with polyphenyl
ether pumping fluid. The working pressure is usually in the (1−3)·10−8mbar level.
The deposition system is completed with a stainless steel tube, an aperture and sup-port for the silver tips (Figure4.1b). The aperture is 10mmin diameter. The distance between the crucible’s top end and the silver tips is about 80mm.
The crucible is heated up to 500℃for 3 hours. Then it is left to cool down to room
temperature. In the present project, profilometry measurements determined that the deposited film was 3.6µmthick.
C H A P T E R 4 . D E P O S I T I O N T E C H N I QU E S
(a) Assembled TVD evaporator mounted on its flange.
(b) Tip support and tube protecting the evapora-tor.
(c) Silver tips mounted on the support by carbon nano sheets, after deposition.
Figure 4.1: Complete thermal vacuum deposition system.
absent from the film deposited on the tips (92% of the film corresponds to the non-conductiveRb2AgI3phase). However, further heating of the tip during the experiments will anneal the electrolyte film and develop a phase transition toRbAg4I5.
4.2 Pulsed Laser Deposition (PLD)
Pulsed laser deposition (PLD) is a physical vapor deposition process where a target com-posed of the material to be deposited is ablated by a focused pulsed laser beam [36]. The vaporised material is deposited as a thin film on the desired substrate.
The set-up is basic, but the laser-target interactions are quite complex. The laser pulse is absorbed by the target, creating a plume of ejected energetic atoms and molecules which is deposited on the tips (Figure4.2).
One of the main advantages of PLD is that the stoichiometry of the deposited film is very close to that of the used target. It is possible to prepare stoichiometric thin films from a single bulk target. This stoichiometry transfer is difficult to obtain with TVD [36].
This project’s PLD procedure was close to the one presented by Yanget al.[37]. RbAg4I5 material was pressed into a small pellet (Figure4.3a). The silver tips were fixed to a glass held by the subtract holder (Figure 4.3b) in the vertical position using vacuum-ready carbon nano sheets. Both pieces were installed in the vacuum chamber (Figures4.2,4.3c).
Laser ablation is preformed using a Q-switched Nd:YAG laser, operated at 266nm (4th
harmonic, mostly ultra-violet) with a pulse energy set to 10mJ and pulse duration of 5ns. The 4th harmonic is used so that most ultra-violet radiation is absorbed at the surface,
4 . 2 . P U LS E D L A S E R D E P O S I T I O N ( P L D )
Figure 4.2: Creation of a plume during the PLD process.
(a) Small pellet of RbAg4I5
material.
(b) Glass fixed onto the substract holder.
(c) Tips, glass substract and pellet in-stalled in the vacuum system.
C H A P T E R 4 . D E P O S I T I O N T E C H N I QU E S
reducing potential damage to the target. The laser beam is introduced into the chamber via a quartz window at an incident angle of 30 degrees to the electrolyte-composed pellet target [38].
The pressure in the vacuum chamber is reduced to the order of 10−6mbar during the
deposition process. The deposition is carried out continuously for 2 hours. During this time the laser’s point of incidence needs to be systematically altered to prevent damage on the target’s surface.
XRD analysis confirmed that the highly conductiveRbAg4I5phase of the electrolyte is predominant (86.65%). This shows that the PLD process is very efficient in producing
a conductive electrolyte coating.
Profilometry analysis shows that the produced film is about 1µmthick, with very little roughness.
SEM analysis on one of the tips showed a rather homogeneous deposition with little roughness (Fig. 10), confirming the results obtained from the profilometry.
Figure 4.4: SEM imaging (1000x) of theRbAg4I5film deposited on one of the tips’ surface.
Insert in the upper right corner (50000x) shows crystalline faceting of the film.
C
h
a
p
t
e
r
5
E x p e r i m e n ta l Se t- u p
This chapter describes the experimental set-up used during the emission studies. The emitter system, heating and vacuum systems, power sources, detectors, measuring instru-ments and other aspects of the set-up are presented and briefly described.
5.1 Emitter System Overview
The emitter system has three main components: emission, collection and heating.
Emission and collection consist of two electrodes: one holds the silver tip while con-nected to a high-voltage source (Figure5.1a), the other is a Faraday Cup serving as an ion collector (Figure5.1b).
The Faraday cup consists of three basic parts: an electrically isolated stainless steel collector closed at the base, an external shield cup connected to the ground and a cap with an aperture.
The tip is concealed inside a macor tube surrounded by resistive kanthal wire, which serves as heating system (Figure5.2). This is a way of heating the tip without any contam-inating emissions from the kanthal wire, nor disruptions of the electric field. This system was calibrated so that it is possible to control the tip’s temperature up to more than 210℃
(significantly higher than the maximum useful temperature in this experiment).
Each of the three components of the emitter system is mounted on a different flange,
as explained by Figure5.3.
C H A P T E R 5 . E X P E R I M E N TA L S E T- U P
(a) High-voltage feeder and tip holder.
(b) Faraday Cup ion col-lector.
(c) TOF-SIMSVG Ionex IX23LS. The preparation chamber is at the far right.
Figure 5.1: TOF-SIMSVG Ionex IX23LSand the two electrodes responsible for emission.
(a) Front view. (b) Side view. (c) Top view.
Figure 5.2: Tip heating system.
The preparation chamber is evacuated using an Edwards E04diffusion pump with
liquid nitrogen cold traps. High vacuum is achieved, the working pressure in the chamber being at the (1−3)·10−8mbar level.
5.2 DC Power Sources
Our set-up makes use of two DC power sources: one to feed high potential to the silver tip, another to supply current for the heating system.
The main power supply is integrated in the TOF-SIMS system. It ranges between 0 - 30 kV, used to produce positive differential potential between silver tip and collector.
This difference will excite the emission of positive ions from the tip. Insulation ceramics
are mounted around the high voltage connector and around the end of the high voltage cable itself.
5 . 3 . E L E C T R OM E T E R
Figure 5.3: The three main components of the emitter system mounted on three different
flanges: (1) high voltage feeder and tip holder, (2) Faraday Cup ion collector and (3) tip heating system. At the centre, an internal representation of the tip’s position relative to the Faraday Cup (heating system is not represented).
The second power unit, used to feed current to the heating system, is aThurlby Thandar Instruments TSX1820 precision DC power supply. It has a maximum output of 18V voltage and 20A current. This power supply allows us to finely adjust the current running through the heater’s kanthal resistance (usually between 6.5-7A).
5.3 Electrometer
The electrometer is a vital component in this set-up. It’s the only way of accurately determining the emitting current from the tip. Its high sensitivity means that we have to be very careful and prevent any possible electrical discharge on the system, as it could damage the equipment.
The Faraday cup acts as an electron beam collector. The emitted positive silver ions hit the base of the cup, are neutralized, and produce a small net charge on the metal. So the Faraday cup produces an electric current directly related to the collected ions’ charge.
C H A P T E R 5 . E X P E R I M E N TA L S E T- U P
5.4 Data Acquisition System
The electrometer has an analog output. This output is connected to a channel of an ADC-16 Terminal Board, which is installed in anADC-16 Data Logger. In turn, the data logger is connected to a computer, where it is possible to register the values read by the electrometer usingPicoLogdata acquisition software.
From this software it is possible to record and extract emission data, and later analyse and work with it through the scientific-graphing data-analysisOriginProsoftware.
C
h
a
p
t
e
r
6
E x p e r i m e n ta l R e s u lt s A n a ly s i s
In this chapter experimental results are summarized and discussed. Ion-beam current from two emitters (one from TVD and another from PLD techniques) is analysed in function of time, temperature and accelerating potential.
By setting a high potential difference between theRbAg4I5-covered silver tip and the
ion collector, positively charged particles are emitted. Obtained measurements evidence this. However, it is vital to establish the composition of the emitted ion-beam.
In order to determine the ion-beam’s composition, a circular nickel foil at the Faraday cup’s base was analysed using TOF-SIMS technique before and after being exposed to the ion-beams produced by the emitters (Figure6.1).
(a) Mass spectrum before exposure. (b) Mass spectrum after exposure.
C H A P T E R 6 . E X P E R I M E N TA L R E S U LT S A N A LYS I S
In Figure6.1b we can see that after the measurements four new peaks are observable on the right, corresponding to, in order,85Rb+(440 counts),87Rb+(193 counts),107Ag+ (1032 counts) and109Ag+(988 counts). In total, there are 633 Rb+counts and 2020 Ag+ counts, which corresponds to an experimental Ag/Rb ratio of 3.19.
Analysing the spectrum from Figure6.1b it’s important to note that the TOF-SIMS technique has different sensitivities for different elements. Rb exhibits higher secondary
ion yield in ToF-SIMS experiments, attending to its lower ionization energy. Relative Sensitivity Factors (RSF) are used to scale the measured peak areas according to each element’s sensitivity.
These factors for silver and rubidium can be found in literature [39]. Using this data together with the experimental peak intensities, we can estimate the actual proportion of Ag and Rb atoms in the foil. This calculation is present in Table6.1.
Table 6.1: Estimation of the ratio of Ag and Rb atoms present in the nickel foil.
(Rb/Ag)RSF (Ag/Rb)experimental (Ag/Rb)estimated
62.5 3.19 199.4
As we can see, there are about 200 times more emitted Ag atoms than Rb. With this in mind, it is assumed that the produced ion-beam current is, by large, composed of Ag+ particles. All ion-beam current measured will be considered Ag+current.
We set the goal of maximizing Ag+emission for an applied accelerating potential of 10 kV.
6.1 Results with TVD
In this section the current measurements obtained using the TVD technique will be anal-ysed. Serie 5’s Tip #3 achieved the best results. This tip’s performance can be considered evidence of Equation1.2’s influence, as it has a remarkably smaller apex radius (6.9µm) compared to other tips used with TVD.
Since the TVD procedure produces a low-conductionRb2AgI3film, the tip was first annealed at 180℃for one hour so that the film achieves the high-conductionRbAg4I5
phase. It was then left to cool down to room temperature.
All measurements presented in this section were conducted within a three day period. The peak emission value at 10 kV was anextremelyunstable 96nAat 180℃, not useful in
the present project’s context.
6.1.1 Volt-Ampere Characteristics (V-I)
V-I characteristics were obtained by varying the accelerating potential applied to the emitter and measuring the emission current. This way we can obtain different sets of
voltage and current.
6 . 1 . R E S U LT S W I T H T V D
The temperature was fixed at 156℃, when a small current (on the pA level) was
detected at 4 kV of accelerating potential. The voltage was progressively increased up to 18 kV and then decreased back down to 10 kV to verify if there was hysteresis.
Results are presented in Figure6.2.
4 6 8 10 12 14 16 18 20
0 5 10 15 20 25 IO N C U R R E N T ( n A )
ACCELERATING POTENTIAL (kV) T = 156oC
Figure 6.2: (TVD) V-I curve at 156℃.
We can see that even at a very low potential of 6 kV, there is ionic emission at the nA level, completely surpassing our initial expectations. It is worth noting that emission was increasingly unstable after 14 kV. There is also very notable hysteresis.
6.1.2 Current-Temperature Dependence
Using an accelerating potential of 10 kV, the temperature was increased up to 180℃. The
emission process started shortly after 135℃. Although the emitted current showed strong
dependence of the temperature, it was impossible to obtain a stable emission upwards of 170℃. The current-temperature dependence is presented in Figure6.3.
It is reasonable to conclude that the ionic emission from the tip depends exponentially from the temperature, as was expected from Equation1.1. The increase in temperature allows for higher ionic conductivity and diffusion of Ag+ particles in the tip and
elec-trolyte.
Emission continued to increase after 170℃but was very unstable. We are only
C H A P T E R 6 . E X P E R I M E N TA L R E S U LT S A N A LYS I S
135 140 145 150 155 160 165 170 175 0 1 2 3 4 5 6 7 IO N C U R R E N T ( n A )
TEMPERATURE (oC)
Uac= 10 keV
Figure 6.3: (TVD) Evolution of ionic current with increase in temperature.
6.1.3 Current-Time Dependence
Twostability testswere carried out to analyse the time dependence of emitting current: 6-hour and 15-hour long.
After studying emission properties for different temperatures, we decided to start
heating from room temperature and fix it at 160℃for the 6-hour long measurement, as it
provided a very good emission current (mean 4 nA) while still presenting quasi-stability (220 pA standard deviation) at 10 kV. The measurement results are presented in Figure 6.4.
We conclude it is possible to maintain a quasi-stable 4 nA current at 160℃.
The temperature/current was manually stabilized by very small variations of the cur-rent applied to the heating system. It was evident that the emission flux was completely dependant on the temperature, as very small alterations (< 3%) in the temperature’s value significantly altered the emission.
For the longer (15 hour) stability test, we chose to drop and fix the temperature at 150℃to further reduce the chance of instability mid-measurements. Again the same
potential difference was applied, 10 kV. Results from this measurement are presented in
Figure6.5.
We can see a small but steady decrease in current over time. The relative stability and lack of significant sudden emission peaks and/or drops along the 15-hour measure-ments is evidence of the equilibrium between emitted particles and ion mobility at the
6 . 1 . R E S U LT S W I T H T V D
0 1 2 3 4 5 6
0,0 1,4 2,8 4,2 IO N C U R R E N T ( n A ) TIME (hours)
T = 160oC Uac= 10 kV
Figure 6.4: (TVD) 6-hour stability test at 160℃under 10 kV.
0 2 4 6 8 10 12 14 16
0 1 2 3 4 5 6 IO N C U R R E N T ( n A ) TIME (hours)
T = 150oC Uac= 10 kV
C H A P T E R 6 . E X P E R I M E N TA L R E S U LT S A N A LYS I S
silver/electrolyte interface. We believe the decrease in current over time is due to loss of efficiency of the emitter system.
Optical microscope images taken of the tip’s apex after all measurements of this sec-tion were concluded confirm that there was degradasec-tion during emission (notice the comparison in Figure6.6). It was calculated that throughout the experiments the apex radius of the tip was increased from 6.9µmto 9.0µm.
(a) Before sustained emission. (b) After sustained emission.
Figure 6.6: Comparison of the Serie 5 Tip #3’s apex before and after sustained emission.
Also worthy of notice, Energy Dispersive X-Ray Analysis (EDXA) to the tip after all measurements showed a significant concentration of C, O and Cu (Wt% of 13.72, 16.69 and 18.21, respectively) contaminating the tip’s apex, which could further hinder emission over a long period of time.
After all measurements and analysis, the silver tip was cleaned, removing the de-posited electrolyte film, and set up once more for blank measurements. We repeated the same procedure as before, but without the conductive material. The tip could not generate any ion current at 10kV.
These results are in line with what we were aiming for at the beginning of this project. We were able to sustain a relatively stable ionic emission current in the nA order.
6.1.4 Determining the Number of Emitted Ions
In this subsection we will estimate the total number of emitted ions from the tip during all measurements. We will use all emission data recorded from Serie 5’s Tip #3. As explained at the beginning of the chapter, it is assumed that the ion current is solely composed of Ag+ions.
The equation for total emitted charge is as follows:
QT =
Z
I∆t (6.1)
WhereI is the measured current value and∆ttime in seconds.
The total emitted charge is the sum of every current value per second. This can be simply calculated by integrating the recorded data in the right proportion.
6 . 2 . R E S U LT S W I T H P L D
UsingOriginProsoftware to work with the data values obtained, we determined that the total emitted current during the TVD emissions was 5.35×10⁻³C.
From the total current value it’s possible to obtain the total number of emitted ions during TVD emissions by dividing it by the single charge value:
Ni= 5.35×10⁻³C
1.60×10⁻¹⁹C =3.34×10
16emitted Ag+ions (6.2)
6.2 Results with PLD
In this section the current measurements obtained using the PLD technique will be anal-ysed. Serie 6’s Tip #2 achieved the best results. This tip’s performance is particularly interesting, as it only achieved emission at a much higher temperature point than ex-pected, as we will see in the following section. However, unlike with TVD, the PLD produced film is very stable at high temperatures (170℃+).
Since the PLD procedure transfers the original material’s stoichiometry to the de-posited film, there is no need to anneal the tip prior to the measurements.
All measurements presented in this section were conducted within a week. The peak emission value at 10 kV was a stable422pAat 195℃, useful within the present project’s
context.
6.2.1 Volt-Ampere Characteristics (V-I)
V-I characteristics were obtained by altering the voltage applied to the emitter and mea-suring the ion-beam current. This way we can obtain different sets of voltage and current.
The temperature was fixed at 195℃, which we believed (based on previous results)
should be more than enough to initiate emission, as we didn’t obtain any current until rising the voltage up to 7 kV (where we obtained a very small current of 2pA). The voltage was progressively increased up to 15 kV and then decreased back down to 10 kV to verify if there was hysteresis.
Results are presented in Figure6.7.
We can see that ionic emission only gained significance at voltages higher than 8 kV. It is worth noting that emission was fairly stable even at 15 kV. Interestingly, unlike with the TVD technique, there appears to be little to no hysteresis at high accelerating potentials.
6.2.2 Current-Temperature Dependence
Using an accelerating potential of 10 kV, the temperature was increased up to 195℃.
The emission process started suddenly at 178℃. Current promptly increased to the
25pAlevel, before a drastic increase at 188℃(Figures6.8and6.9a). Afterwards, current
C H A P T E R 6 . E X P E R I M E N TA L R E S U LT S A N A LYS I S
6 7 8 9 10 11 12 13 14 15 0 50 100 150 200 250 300 350 400 450 IO N C U R R E N T ( p A )
ACCELERATING POTENTIAL (kV) 3.25 A / 4.83 V
T = 195oC
U increase -> U decrease
Figure 6.7: (PLD) V-I curve at 195℃. A/V values correspond to the current going through
the heating system.
because of stability concerns. However, the emitting current was very stable throughout all measurements.
The current-temperature dependence is presented in Figure6.8.
The current variation with decreasing temperature was also measured at the end of the time-dependance measurements that will be presented in the next section. The measurement is pictured in Figure6.9b.
Although the emission increase was drastic at 188℃, there is no significant drop in
current at this point when temperature is decreasing. In fact, it decreases very smoothly. This means that after an initial activation the emitter is capable of emitting at lower temperatures than it’s activation point.
6.2.3 Current-Time Dependence
Twostability testswere made to analyse the time dependence of emitting current: 25-hour and 100-hour long. The larger time windows were chosen in virtue of the PLD-prepared emitter beingmuchmore stable than our experience with TVD emitters.
We decided to start heating from room temperature and fix the heater system at 195℃for both measurements, as it provided the best emission current results within the
safety limitations of our system, while still presenting sufficient stability at 10 kV. The
measurement results are presented in Figure6.10.
6 . 2 . R E S U LT S W I T H P L D
20 40 60 80 100 120 140 160 180 200 0 20 40 60 80 100 120
PLD 10 kV Heating from RT
IO N C U R R E N T ( p A )
TEMPERATURE (oC)
Figure 6.8: (PLD) Evolution of ionic current with increase in temperature.
0 20 40 60 80 100
0 50 100 150 189o C IO N C U R R E N T ( p A ) TIME (min)
PLD 10 kV Heating from RT
186o
C
(a) Heating and emission activation by temperature.
5950 5960 5970 5980 5990 6000
0 25 50 75 100 95o C 107oC 125oC 150o C 195o C IO N C U R R E N T ( p A ) TIME (min)
PLD 10 kV Cooling to RT
(b) Emission evolution while cooling to room temperature.
C H A P T E R 6 . E X P E R I M E N TA L R E S U LT S A N A LYS I S
0 2 4 6 8 10 12 14 16 18 20 22 24 26 0 100 200 300 400 500
Mean current ~ 237 pA
IO N C U R R E N T ( p A ) TIME (h)
PLD 10 kV 195 oC
Qtot ~ 2.1x10⁻⁵ C
Ntot ~ 1.3x10¹⁴ ions
Mtot ~ 23 ng (Ag+)
Figure 6.10: (PLD) 25-hour stability test at 195℃under 10 kV. Total emitted charge, ions
and respective mass loss indicated.
Although we were able to maintain a stable current at 195℃, emission dropped
con-sistently with the passage of time. It’s mean value was 237pA(422pAat highest point, 163pAat lowest).
It’s worth taking into account that the PLD produced film was significantly thinner than the one obtained with TVD (PLD: 1.0µm; TVD: 3.6µm), which could result in a much faster degradation of the electrolyte film and, in turn, of the emission’s efficiency.
For the longer (100 hour) stability test, we decided to again fix the temperature at 195℃ following the good stability shown in the first measurement. Again the same
potential difference was applied, 10 kV. Results from this measurement are presented in
Figure6.11.
Again we can see a steady decrease in current over time. We believe the weaker emission over time is once again due to loss of efficiency of the emitter system. This time
the decrease is smaller, but the top current was also much lower than before (130pA). The mean current value was 81pAthroughout the measurements.
The total emitted charge during the time-current dependency measurements was about 5.0×10⁻⁵C, which amounts to a total of 3.1×10¹⁴emitted Ag+ions.
Energy Dispersive X-Ray Analysis (EDXA) to the tip after all measurements showed that all contamination on the tip’s apex corresponded to less than 6 Wt%, which could explain the very high levels of stability shown by the emitter during all measurements.
6 . 2 . R E S U LT S W I T H P L D
0 12 24 36 48 60 72 84 96 0
50 100 150
IO
N
C
U
R
R
E
N
T
(
p
A
)
TIME (hours)
PLD 10 kV
T var from 22 to195 oC
Qtot ~ 2.9x10⁻⁵ C
Ntot ~ 1.8x10¹⁴ ions
Mtot ~ 32 ng (Ag+)
Mean current ~ 81 pA
Figure 6.11: (PLD) 100-hour stability test at 195℃under 10 kV. Total emitted charge,
C
h
a
p
t
e
r
7
C o n c l u s i o n s
In this thesis, a field evaporation ion-beam source based on superionic solid electrolyte was developed and refined.
It was shown that silver ions completely dominate the ionic emissions, with a concen-tration 200 times higher than Rb atoms on the detector. This is a massive improvement over previous experiments, in which the measured ratio was 6.6 [6]. Rb+ ions don’t move in the electrolyte film, so the small amount of Rb detected may be due to the emission of AgRb clusters. If so, we achieved a very significant reduction of these clusters’ emission. Fabrication methods were perfected to the point where we can produce high quality silver tips with an apex radius inferior to 10µmsystematically. Within the limitations of our hardware, we have determined that an optimal tip should have an aperture close to 30°.
The developed heating system allows us to maintain a stable temperature at the emit-ter and alemit-ter it with much precision. This system was essential in measuring ionic current as a function of temperature, time and applied voltage.
The recorded current measurements (for TVD) show an impressive 4 nA current sustained for over 5 hours at an extraction voltage of 10 kV. That’s more than 170 times the previously recorded emission, using half the accelerating potential, sustained for a period of time 3 times longer [6].
Two different deposition methods were experimented with: Thermal Vacuum and
Pulsed Laser Deposition (TVD and PLD). The TVD method was developed and perfected through 8 different trials, the synthesis being controlled by XRD every time. PLD was
developed in collaboration with Professor Reinhard Schwarz and Dr. Rachid Ayouchi at Instituto Superior Técnico.
C H A P T E R 7 . CO N C LU S I O N S
Sections7.2 and7.3 will approach conclusions regarding ionic conductivity in the emitter system and suggestions for this project’s possible future developments, respec-tively.
7.1 TVD
versus
PLD
Both deposition methods produced very interesting, albeit different, results.
The best current was obtained with a TVD prepared tip. However, we conclude that the deposition process is very unpredictable. It took us several different trials and
depositions to find a good balance between deposition temperature, time and annealing processes, and even then the results were sometimes very different between tips from the
same deposition batch.
This unpredictability means that it’s very hard to produce a film of a certain thickness. And the film produced can be of low quality because of incongruent evaporation and possible contamination. This leads to rather unstable ion-beam emissions.
On the other hand, PLD prepared emitters show very decent stability and durabil-ity. The PLD process produces a high quality film, and it’s relatively easy to control its thickness. It took us muchless time to start obtaining relevant results. However, the results weren’t as impressive as the ones with TVD, and the working temperature had to be significantly higher to achieve emissions.
Environmental conditions also affect the quality of the films immensely on both
de-position processes, which makes it complicated to obtain good results from prepared emitters that have to be maintained outside the system while we are performing measure-ments with another.
Table7.1summarizes and compares some of the most important aspects of the results with each technique, taking all these factors into account.
Table 7.1: Comparison between TVD and PLD techniques.
TVD PLD
Emission Current 4nA 422pA Working Temperature 160℃ 195℃
Accelerating Potential 10 kV 10 kV Predictability very low high Stability low sufficient
Film Quality varied high Environment Resistance low low
Recommended no yes
As stated in Table7.1, after much experimentation and thought, in future develop-ments that this project may go through it would be more interesting (and even recom-mended) to explore the PLD technique. As mentioned before, it produced very good
7 . 2 . I O N I C CO N D U C T I O N W I T H I N T H E E M I T T E R S YS T E M
results after a short amount of development, and it has a huge progression margin. TVD is unpredictable and a very imprecise technique in the context of this investigation, which is why it is less recommended besides the better results. We felt that we can achieve the same and even surpass them using PLD in the future.
7.2 Ionic Conduction Within the Emitter System
During this thesis it was proven that Ag+ions transfer between the silver reservoir (tip) and the deposited electrolyte film. This can be demonstrated by comparing the number of emitted ions with the number of ions present at the tip’s apex.
For this we will use emission data from Serie 5’s Tip #3. Equation6.2 gives us the total number ofemitted Ag+ions during the TVD measurements: 3.34×10¹⁶.
Now we shall calculate the silver ions present in the electrolyte deposited on the tip’s apex at the start of the experiment. First we need to calculate the total amount of particles present.
RbAg4I5has a density (ρ) of 5.38g/cm3, and a molar mass (M) of 1151.46g/mol[40]. By estimating the volume of the film we can determine the amount of particles that are present in it.
We can approximate the tip’s apex to the half of a sphere. Its radius (r) is 6.9×10⁻⁶m
(Section3.1). The half-sphere’s area is determined by Equation7.1:
A= 4πr 2
2 = 2πr
2= 2.99
×10−10m2 (7.1)
Knowing that the film’s thickness was measured at 3.6µm(Section4.1), we can calcu-late the volume of the film: V = 1.08×10⁻¹⁵m3(or 1.08×10⁻⁹cm3)
Knowing its density and volume, we can calculate its mass (m):
m=ρ×V = 5.81×10⁻⁹g (7.2)
Lastly, knowing the mass and molar mass, we can determine the total number of particles on the film, using the Avogadro constant,NA:
Nparticles=MmNA= 3.04×10¹²particles of RbAg4I5 (7.3)
Taking into account that only about 40% of the particles on the film are silver:
NAg= 3.04×1012·0.4 =1.22×10¹²Ag particles present on the tip′s apex (7.4)
Comparing the results from Equations6.2and7.4, we can conclude that the number of emitted Ag ions is more than 27000 times the number of Ag particles initially present on the apex area (1016≫1012, four orders greater).
C H A P T E R 7 . CO N C LU S I O N S
7.3 The Future
In the continuation of this project there are several aspects that could be explored and different paths the investigation could follow.
7.3.1 PLD Technique
As mentioned before, emitters using films obtained by the Pulsed Laser Deposition tech-nique are showing great promise. Their stability and controlled deposition are very de-sirable qualities in the context of this project. It would be ideal to have easy access to the necessary equipment, either by collaboration or in-house development. If it was possible to dedicate as much time and effort into exploring this technique as it was with TVD, it
is very likely that the results would be much better and much more easily reproducible. It was also very interesting to observe the sudden increase of ion emission at 188℃.
This could mean either an emission activation temperature or a change in electrolyte phase at this temperature point. It would be extremely interesting to obtain detailed RbAg4I5conductivity data in the 180-200℃temperature range.
7.3.2 Set-up and Emitter System
The development and addition of an Wien Filter would benefit the ionic current measure-ments. Instead of assuming all emission is Ag-based, it would be possible to measure the exact contribution of different elements (more importantly, the exact silver ion current).
Another important step in this ongoing investigation is to upgrade the emitter system. Instead of a single tip, the upgraded system could feature an array of field evaporation tips.
It would also be worthwhile to develop a protective coating for the system. As ob-served during experimental work, and stated before, the solid electrolyte films suffer
degradation (sometimes severe, tips becoming unusable) at atmosphere conditions. This makes them very hard to store in between measurements and analysis. A protective coating could be studied and developed so that the emitters could resist atmospheric conditions for useful amounts of time, and at the same time allowed for quick start of measurements (for example, the coating could evaporate when increasing the tempera-ture to working conditions).
Another solution could be to experiment with a 4 compound solid electrolyte (for exampleCs2Ag8Br5I5) which is a good Ag+conductor but also more stable in atmospheric conditions [41].
7.3.3 Wien Effect
Future investigation could also explore the Wien Effect. Max Wien discovered, in 1927,
that ionic conductances do not conform to Ohm’s law under influence of high potential
7 . 3 . T H E F U T U R E
gradients. By applying quite high field strengths, it is possible to obtain appreciable conductance increases in most electrolytes [42].
This effect is evident at field gradients of the 109V/m magnitude, which our
exper-iments easily reach at the tip’s apex. In fact, during our work this effect was noticeable
upon rising the applied potential to obtain Figures6.2and6.7, as we had to wait a couple of minutes each time to let the emission current "settle down".
B i b l i o g r a p h y
[1] J. S. Sovey, V. K. Rawlin, and M. J. Patterson. “Ion Propulsion Development Projects in U.S.: Space Electric Rocket Test I to Deep Space 1”. Journal of Propulsion and Power17.3 (2001), pp. 517–526.
[2] P. J. Wilbur, M. Wilson, K. Hutchings, and J. D. Williams. “The Emissive Membrane Ion Thruster Concept”. International Electric Propulsion Conference164 (2005). [3] K. Arshak, M. Mihov, A. Arshak, D. McDonagh, and D. Sutton. “Focused ion
beam lithography-overview and new approaches”. 24th International Conference on Microelectronics. Vol. 2. IEEE, 2004, pp. 459–462.
[4] A. M. Belu, D. J. Graham, and D. G. Castner. “Time-of-flight secondary ion mass spectrometry: Techniques and applications for the characterization of biomaterial surfaces”. Biomaterials24.21 (2003), pp. 3635–3653.
[5] P. de Jager and P. Kruit. “Applicability of focused ion beams for nanotechnology”. Microelectronic Engineering27.1-4 (1995), pp. 327–330.
[6] D. T. Martins. “Compact Ion-source Based on Superionic Rubidium Silver Iodide (RbAg4I5) Solid Electrolyte”. Universidade Nova de Lisboa - Faculdade de Ciências e Tecnologia, 2013.
[7] P. P. Kumar and S. Yashonath. “Ionic conduction in the solid state”. Journal of Chemical Science118.1 (2006), pp. 135–154.
[8] B. D. Fahlman. Materials Chemistry. 2nd ed. 2011, pp. 74–102.
[9] G. Staikov, E. Budevski, W. J. Lorenz, and W. Wiesbeck. “Frequency dispersion of the ionic conductivity of RbAg4I5 at low temperatures”. Solid State Ionics124 (1999), pp. 101–108.
[10] S. Hull. “Superionics: crystal structures and conduction processes”. Reports on Progress in Physics67.7 (2004), pp. 1233–1314.
[11] J. N. Bradley and P. D. Greene. “Solids with high ionic conductivity in group 1 halide systems”. Transactions of the Faraday Society63 (1967), p. 424.
[12] K. Funke. “AgI-type solid electrolytes”. Progress in solid state chemistry11 (1976), pp. 345–402.
![Figure 1.2: Illustration of a unit cell of an ionic crystal with Frenkel and Schottky defects [8].](https://thumb-eu.123doks.com/thumbv2/123dok_br/16547286.736997/21.892.264.626.448.856/figure-illustration-unit-ionic-crystal-frenkel-schottky-defects.webp)
![Figure 1.3: Schematic representation of the conduction mechanisms around the transition temperature T t [9].](https://thumb-eu.123doks.com/thumbv2/123dok_br/16547286.736997/22.892.241.567.424.841/figure-schematic-representation-conduction-mechanisms-transition-temperature-t.webp)
![Figure 1.4: Ionic conductivities of several AgI-type solid electrolytes [12].](https://thumb-eu.123doks.com/thumbv2/123dok_br/16547286.736997/23.892.184.710.166.541/figure-ionic-conductivities-agi-type-solid-electrolytes.webp)