Dália Teresa Al-Alavi Martins
Licenciatura em Engenharia Física
Compact Ion-source Based on
Superionic Rubidium Silver Iodide
(RbAg
4I
5) Solid Electrolyte
Dissertação para obtenção do Grau de Mestre em Engenharia Física
Orientador: Doutor Alexander Borisovich Tolstoguzov
Júri:
Presidente: Prof. Doutor Orlando Manuel Duarte Teodoro Arguente: Prof. Doutor Reinhard Horst Schwarz
Vogal: Doutor Alexander Borisovich Tolstoguzov
Dália Teresa Al-Alavi Martins
Licenciatura em Engenharia Física
Compact Ion-source Based on
Superionic Rubidium Silver Iodide
(RbAg
4I
5) Solid Electrolyte
Dissertação para obtenção do Grau de Mestre em Engenharia Física
Orientador: Doutor Alexander Borisovich Tolstoguzov
Júri:
Presidente: Prof. Doutor Orlando Manuel Duarte Teodoro Arguente(s): Prof. Doutor Reinhard Horst Schwarz
Vogal: Doutor Alexander Borisovich Tolstoguzov
ii
Compact Ion-source Based on Superionic Rubidium Silver Iodide (RbAg4I5) Solid
Electrolyte
iii
Acknowledgements
Dr. Alexander Tolstoguzov for all his supervision, advising, support and confidence in the work in which I have been involved. This thesis could not have been completed without his guidance and help.
Professor Orlando for his constant interest, support and encouragement.
Professor Moutinho, Nenad Bundaleski, João and all the members at the Surface Analysis Group, CEFITEC (Centre of Physics and Technological Research), for their suggestions, questions and encouragement.
Professor Estrela at Chemistry Department, FCUL, for the dozens of XRD analysis, for all her help, patience, time, sympathy and for being a truly inspiring person.
Stefano Caporali, Chemistry Department, University of Firenze, Italia, for the preparation of the first set of micro-probes.
Sónia dos Santos Pereira at CENIMAT for her assistance during thermal evaporation and for performing the thickness measurements.
Tito Busani at CENIMAT for his interest in this project, for his advices and efforts to find the best solution for the deposition.
Manoj Bhanudas Gawande, Pós-Doc Research at the Chemistry Department, FCT-UNL, for preparing the electro-polishing solution for the silver micro-probes.
Professor Rui Lobo, FCT-UNL, for being available to discuss the results of electro-polishing, as well as for sharing his experience and knowledge on similar techniques used in AFM tips.
Mr. Faustino for the mechanical polishing of the micro-probes.
My dear parents and my beloved fiancé, for being part of me.
My dear six-year-old sister, for her surprising interest on ionic currents and experimental work and for having millions of amazing ideas and astonishing questions.
Ana Colaço for her friendship through the last five years.
All Alamitas in my residence for their incredible friendship, support, encouragement, interest, companionship and patience.
Ahmed T. E. G. for all the help.
v
Abstract
A compact ion-beam source based on rubidium silver iodide (RbAg4I5) solid electrolyte,
deposited on a sharpened silver tip, has been developed and studied. Through an accelerating potential above 10 kV, established between emitter and collector, silver positive ions move through the electrolyte towards the emitting surface, where they are emitted from and accelerated. Via partial redox reaction occurring at the silver/RbAg4I5 interface, silver atoms are
oxidised into Ag+ ions and migrate into the electrolyte, compensating the loss of emitted ions in
the apex region. The emitted ions are collected by a Faraday cup, producing an electric current in the level of tens picoamperes. It was found that silver ions (atomic or clustered) make a major contribution to the measured ion current, although rubidium ions were also detected with concentration in six times lower than silver.
The apex diameters of the final emitters were estimated in the range of 4-9 µm. The highest stable current was produced by an emitter whose apex diameter corresponds to 8.2 ± 0.5 µm. This current remained in the level of 20-25 pA for nearly 90 minutes and it was obtained at 92ºC, using an extraction voltage of 20 kV. Furthermore, it was observed that the current increased exponentially with temperature and linearly with applied voltage, at least for temperatures below 150 ºC and voltages in the range of 10-22 kV. Dependence on the apex diameter was not studied, since the RbAg4I5 film deposited on silver tips was not totally
uniform.
Several improvements should be performed to optimize the deposition methods, the design of heating system and methodology of the measurements (m/z characterization of the emitted particles). However, the developed ion-beam source can produce a stable current over a long period of time with minimal expenditure of energy and source material. Such sources have potential applications in materials science and spacecraft engineering as principal elements of miniaturized electric propulsion systems (ionic thrusters).
vii
Resumo
Foi desenvolvida e estudada uma fonte de iões compacta baseada na deposição do eletrólito sólido RbAg4I5 sobre reservatórios de prata em forma de tip. Aplicando uma diferença
de potencial superior a 10kV entre o emissor e o coletor, os iões de prata positivos deslocam-se no interior do eletrólito em direção à sua superfície, de onde são emitidos e acelerados. Através de uma reação redox parcial na interface Ag/RbAg4I5, os átomos de prata no reservatório são
oxidados em iões Ag+ que migram para o interior do eletrólito, compensando a perda de iões
emitidos no extremo do emissor. Os iões emitidos são captados por um coletor do tipo Faraday cup, produzindo uma corrente elétrica ao nível das dezenas de pico-amperes. Foi demonstrado que os iões de prata (na forma atómica ou em agregados) são o principal constituinte da corrente medida, embora também possam ser encontrados iões de rubídio numa concentração cerca de 6.6 vezes inferior à da prata.
O diâmetro da extremidade dos emissores finais foi estimado entre 4 e 9 µm. A corrente estável mais elevada foi produzida por um emissor com diâmetro de 8.2 ± 0.5 µm na extremidade. Esta corrente permaneceu entre 20 e 25 pA durante cerca de 90 minutos e foi obtida a 92ºC, utilizado uma tensão de extração de 20 kV. Adicionalmente, observou-se que a corrente aumentou exponencialmente com a temperatura e linearmente com a diferença de potencial aplicada, pelo menos para temperaturas inferiores a 150 ºC e diferenças de potencial entre 20 e 22 kV. A sua variação com o diâmetro da extremidade do emissor não foi estudada, uma vez que o filme de RbAg4I5 depositado sobre os tips de prata não foi completamente
uniforme.
Diversos melhoramentos poderão ainda ser realizados de forma a otimizar os métodos de deposição, o design do sistema de aquecimento e a metodologia de medição (caracterização massa/carga das partículas emitidas). Contudo, a fonte de iões desenvolvida produz uma corrente estável durante um longo período de tempo, com um gasto mínimo de energia e material. Este tipo de fontes possui potenciais aplicações na área de ciência dos materiais e de engenharia aeroespacial, como elementos fundamentais na miniaturização de sistemas de propulsão (propulsores iónicos).
Palavras-chave: Condutividade iónica, eletrólito sólido, RbAg4I5, emissor, corrente iónica, feixe
ix
Contents
Acknowledgements ... iii
Abstract ... v
Resumo ... vii
Contents... ix
Figures Content ... xi
Tables ... xiii
Acronyms ... xv
Chapter 1. Introduction ... 1
Chapter 2. Some General Aspects of Crystalline Solid Electrolytes ... 5
2.1. Origin and thermodynamics of intrinsic point defects in crystalline solids ... 5
2.2. Ionic Conductivity ... 7
2.3. General classification of solid electrolytes ... 9
Chapter 3. RbAg4I5 Solid Electrolyte... 11
3.1. Crystalline Structure and Ionic Mobility ... 11
3.2. Synthesis, characterization and deposition processes ... 14
Chapter 4. Ion Source Based on RbAg4I5 Solid Electrolyte ... 17
4.1. Brief description of the emitter system ... 17
4.2. Oxidation and reduction of Silver Ions ... 17
4.2.1. An ions source as an electrochemical system ... 17
4.2.2. Ag/RbAg4I5 interface: double layer and pseudocapacitance ... 19
4.3. Transport of Ag+ ions under an applied voltage ... 22
4.4. Emission of Ag+ ions ... 23
4.2.1. Field Ion Emission ... 23
4.2.2. Field evaporation escape processes ... 23
Chapter 5. Production and Characterization Techniques and Equipment ... 25
5.1. Resistive Thermal Evaporation ... 25
5.2. X-Ray Diffraction Analysis System ... 27
5.3. TOF-SIMS System ... 28
Chapter 6. Electrolyte and Micro-Probes Production ... 33
6.1. Electrolyte Production ... 33
6.2. Reservoir Production ... 35
x
Chapter 7. Experimental Set Up ... 39
7.1. General overview ... 39
7.2. High voltage DC sources ... 40
7.2.1. Material Description ... 40
7. 2. 2. Faraday Cup and Electrometer ... 41
7. 2. 3. Pico Technology® acquisition system ... 42
7. 2. 4. Heating system and thermometer ... 43
Chapter 8. Experimental Results Analysis ... 45
8.1. Identification of the ion-beam content ... 45
8.2. Second set of micro-probes ... 48
8.2.1. Current-temperature dependence ... 49
8.2.2. Current-time dependence ... 50
8.2.3. Current-voltage dependence ... 52
Chapter 9. Conclusions ... 55
xi
Figures Content
Figure 1. 1. Schematic drawing of the ion source developed by Escher et al. [19]. ... 3
Figure 2. 1. Schematic illustration of (a) Schottky and (b) Frenkel defects in an ionic crystalline structure[25]. ... 5
Figure 3. 1. Representation of the (a) distorted iodine octahedron around Rb+ and (b) crystal
structure of RbAg4I5, showing the cubic unit cell as the blue-lined box [33]. The larger spheres
at right correspond to I-, medium spheres to Rb+ and small spheres to Ag+. ... 12
Figure 3. 2. Projection of the crystal structures of (a) α-RbAg4I5 at 295K along the plane [111],
(b) β-RbAg4I5at 150K along plane [001] and (c) γ-RbAg4I5 at 90 K along the plane [001]. The
upper part presents the structures without silver ions and the lower part presents silver ions in a structure where Rb+ and I- are downscaled [38]. ... 13
Figure 3. 3. Conductivity of Ag+ in RbAg
4I5 in the temperature range 125 K and 1000 K [39] .
... 14
Figure 3. 4. Phase diagram of RbI+AgI system [41]. The eutectic point (red colour) occurs at 197ºC for a mixture with 30% of RbI. ... 14
Figure 4. 1. Schematic representation of (a) a simple electrochemical system and (b) the proposed Ag+ emitter system. ... 18
Figure 4. 2. Stern model of a general double layer formed in the interface between a positively charged surface and an electrolyte in aqueous solution [44]. Solvated cations migrate and adsorb to the electrolyte surface due to electrostatic forces. Potential drop is represented on the interface. ... 19
Figure 4. 3. Schematic representation of the emitter system (a) before high voltage is applied and (b) after the double layer is formed at the interface silver/electrolyte, where oxidation of silver atoms takes place. ... 21
Figure 4.4. Simulation of Ag+ trajectories using a distance of (a) 5 mm and (b) 1 mm between
the micro-probe and collector. Resolution is 0.033(3) mm (i.e., 1mm corresponds to 30 points). ... 42
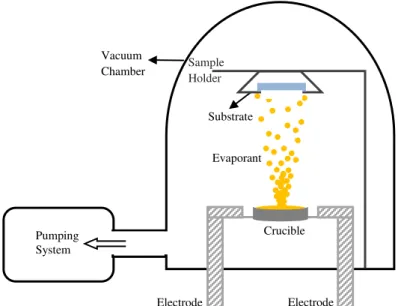
Figure 5. 1. Schematic view of resistive thermal evaporation chamber. Typically, a voltage in the range of 6-20V is applied to the electrodes and a current of 50-100A passes through the crucible. ... 25
Figure 5. 2. Schematics representation of evaporation from a surface source. ... 26
Figure 5. 3. Thermal resistive evaporation system at CENIMAT. ... 27
Figure 5. 4. Schematic presentation of X-ray diffraction. The plane [hkl] is perpendicular to the plane of atoms. ... 27
Figure 5. 5. Philips Analytical PW 3050/60 X'Pert PR difractometer. ... 28
xii
Figure 5. 7. ToF-SIMS equipment and its main components... 31
Figure 6. 1. XRD diffraction patterns of α-RbAg4I5 powder. The main peaks corresponding to
RbAg4I5 are marked with lines and blue points represent peaks, which belong to α-AgI
electrolyte. ... 34
Figure 6. 2. Schematic drawing of the silver reservoir. ... 35
Figure 6. 3. XRD diffraction patterns of silver reservoir #4 (7.8± 0.5 µm of diameter). This tip was randomly selected for analysis and the composition of all other reservoirs was assumed to be similar. ... 37
Figure 6. 4. Thermal evaporation chamber and details of (a) silver tips in the substrate holder and (b) RbAg4I5 powder electrolyte in the crucible before the deposition. From right to left,
silver tips ordered from numbers 1 to 4, according to the classification used in Table 2. ... 38
Figure 7. 1. Overview of the experimental set up. The emitter system is placed in the preparation chamber of ToF-SIMS at 10-8-10-9 mbar. ... 39
Figure 7.2. Emitter system (in the centre) and its connections. The small yellow dot is on the region between electrodes, travelled by the emitted particles. 1- High voltage DC source; 2- Electrode holding micro-probe; 3- Faraday Cup; 4- Electrometer; 5- Pico Tecnology® acquisition data hardware; 6- Computer/ PicoLog® software; 7-Thermometer; 8- Heating system. Ground connections are not shown. ... 40
Figure 7. 3. High voltage connection to the chamber: (a) without high voltage cable and before mounting the emitter system in the preparation chamber and (b) after that, with high voltage cable and insulation. ... 41
Figure 7. 4. Faraday Cup components: (a) inner and outer cylindrical electrodes and (b) cap. Ceramics was used to isolate the collector from the ground. ... 41
Figure 7. 5. Pico Technology® device for data acquisition. ... 42
Figure 8. 1. Current-time graph for an emitter composed of silver wire dipped into the melted electrolyte (room temperature, 20 kV of accelerating potential) ... 46
Figure 8.2 Mass spectrum of positive secondary ions obtained for as-received nickel foil (before being placed inside the Faraday cup)... ... 47
Figure 8. 3 Mass spectrum obtained from a nickel foil after its exposure to the ion beam emitted from the electrolyte ion-beam source.. ... 45
Figure 8. 4. Dependence of the ion current on temperature under an accelerating voltage of 20 kV. ... 49
Figure 8. 5. Current-time dependence at 92ºC obtained using an accelerating voltage of 20 kV. ... 51
xiii
Tables
Table 6. 1. Images of the handcrafted silver reservoirs apexes before and after polishing with sand paper and their estimated diameters. ... 36
xv
Acronyms
a Interatomic space
Electric field Kinetic energy
F Faraday constant (9.649×10⁴ C mol−1)
j Current density
Field evaporation rate Field reduction factor
MAg4I M silver iodide (M stands for Na, K, Rb, Tl and NH4)
MIM Metal/insulator/metal m/z Mass to charge ratio
ne Number of electrons
ns Number of Schottky defects
nf Number of Frenkel defects
Number of sites
Number of interstitial sites Na-β-alumina Sodium beta alumina
Net flux density of ions
pA Picoampere
q Charge number
R Apex radius
RbAg4I5 Rubidium Silver Iodide
Thermal evaporation rate RSF Relative Sensitivity Factor RTE Resistive Thermal Evaporation SIMS Secondary Ion Mass Spectrometry
ToF-SIMS Time-of-Flight Secondary Ion Mass Spectrometry XRD X-Ray Diffraction Analysis
Gibb's free energy Wavelength Chemical potential
1
Chapter 1.
Introduction
______________________________________________________________________
There are two types of conductivity, electronic and electrolytic, and both types can occur in all states of matter. Materials in solid state, which have mainly electrolytic conductivity, through the movement of positive or negative ions, and negligible electronic conductivity are named solid electrolytes. Electrolytes with high values of ionic conductivity (10-1-10-4 m-1) are also referred as superionic or fast ion conductors.
Prior to 1960 most of the devices were based on electron conducting materials, as semiconductors, and very few ion conducting materials were available. In 1967 two different types of electrolytes were revealed: Na-β-alumina, with movable Na+ ions, found by Yao and
Kummer [1], and MAg4I5 compounds (M standing for Na, K, Rb, Tl and NH4), discovered by
Bradley and Greene [2, 3] and independently by Owens and Argue [4]. In particular, these MAg4I5 compounds presented exceptionally high ionic conductivity and all contained the same
movable Ag+ ion, which do not occupy particular single sites in the crystalline lattice [3]. Since
then, several other solid electrolytes with various mobile species have been discovered, namely H+, Li+, K+, Cu+, F- and O
2-. However, rubidium silver iodide (RbAg4I5) solid electrolyte,
belonging to MAg4I5 compounds, is still the solid electrolyte with the highest known ionic
conductivity at room temperature (0.124 m-1 at 20ºC [2]) and has been employed in various technological applications.
Since the 70s, RbAg4I5 has been used in solid-state batteries [6], with high faraday
efficiency and several advantages in terms of shelf life after ten years [7] and twenty years storage [8]. More recently, Taralunga et al. [9] established that an Ag/RbAg4I5/RbI3 battery
presents good electrochemical characteristics to be used in cardiac pacemakers and other medical devices.
RbAg4I5 has also been used in the field of Nanotechnology, for structuring and
modifying nano-devices. As an example, an AFM-aided nanolithography technique was developed based on the high ionic conductivity of Ag+ ion in RbAg
4I5 [10]. When a negative
voltage is applied on the AFM probe relative to a counter electrode, composed of RbAg4I5 thin
film on silver, silver atoms at that electrode are electrochemically oxidized into positively charged Ag+ ions. Then those ions can migrate across the electrolyte to its surface, where they
are reduced into Ag atoms directed at the tip, resulting in nano-sized Ag pattern.
Also in nanotechnology applications RbAg4I5 was used as a mean to produce silver
nanowires [11]. As reported, a crystalline film of RbAg4I5 was deposited on a substrate and
Chapter 1. Introduction
2
conditions and under a potential difference between electrodes, Ag atoms are oxidized in the positive electrode, losing an electron. Ag+ ions then migrate through the electrolyte towards the
cathode, where they are reduced into Ag atoms, which form clusters and grow as wires. By the contrary, reproducing this experiment using silver electrodes instead of the aluminium ones, Ag+ ions can uninterruptedly migrate through the electrolyte towards the cathode, negatively
charged. This continuous migration evidences that positive electrode behaves like a reservoir of silver ions, oxidising silver atoms in the interface silver/electrolyte, and the negative electrode as a consumer of Ag+ ions, reducing them into silver atoms again.
Others application of RbAg4I5 thin films are electric switching devices, transistors and
capacitors. Electric switching devices are composed of electrolyte film sandwiched between Ag and Pt electrodes [12]. This sort of devices can be switched between high- and low-resistance states by applying a voltage with opposite polarities, as a consequence of the growth and dissolution of Ag dendrites, also due to oxidation-reduction reactions [13, 14]. A field configurable transistor can be fabricated on a Si nanowire FET(field-effect transistor) platform by integrating a thin film of conjugated polymer and RbAg4I5 ionic conductive layer into the
gate [15]. In the case of electrochemical capacitors, they consist of capacitors with electrical double layer, considered promising rechargeable current sources [16].
More recently, in the field of atomic manipulation, Valov et al. [17] set a potential difference between a scanning tunnelling microscope (STM) tip and the RbAg4I5 electrolyte on
silver. In this case, Ag+ ions in the electrolyte were reduced at its surface, forming Ag atoms,
and there a nucleus may grow so that a single atomic contact to the STM tip was possible. In the sequence of these results, Valov and Kozicki [18] published a review on the utilization of solid electrolytes as RbAg4I5 in cation based switching memory cells. These devices have a
metal-insulator/electrolyte-metal (MIM) structure and are also based on cation migration and redox (reduction/oxidation) reactions to form and remove a conducting filament between electrodes (generally made of Ag or Cu). Once formed, the Ag+/Cu+ filament bridges the insulator
electrolyte and the device is in the low-resistance ON state. Applying a voltage with the opposite polarity, the filament dissolves and the cell returns to the high-resistance OFF state.
More than proving its versatility, the referred technological applications of RbAg4I5
demonstrate its potential as an effective solid state mean for the diffusion of silver ions, capable of being reduced or oxidized when silver electrodes are in contact the electrolyte and proper potential difference is set. Besides, thermal evaporation of RbAg4I5 was proved to produce
crystalline thin films on electrodes.
Chapter 1. Introduction
3
Considering focused ion beam sources, Escher et al. [19] developed a source based on (AgI)0.5(AgPO3)0.5 amorphous solid electrolyte, containing the same Ag+ movable ion as in case
of RbAg4I5. Under vacuum conditions and by applying a potential difference between a
sharpened electrolyte tip and a detector, Ag+ ions are reported to be field emitted, as represented
in Figure 1.1. Since the electrolyte is in contact with a silver reservoir, silver atoms in that interface are oxidized into Ag+ ions, which then move into electrolyte and replenish those
emitted from the apex.
Figure 1. 1. Schematic drawing of the ion source developed by Escher et al. [19].
The present work aims to develop an ion source-based on the emission of movable ions from a solid electrolyte, mainly for future applications in innovative solid state ion thrusters for aerospace engineering. Having a simpler and lighter packing, this new type of all solid state thrusters could be able to compete with ion electrospray thrusters, which require the extraction and acceleration of ions from liquids. RbAg4I5 solid electrolyte was chosen for this purpose
because it has the highest known ionic conductivity at room temperature (0.124 m-1 at 20ºC [2]), contains a high mass movable ion (Ag+) and well known crystalline structure and
properties. Of course, this ion source based on RbAg4I5 also opens a broad field of applications
in general ion-beam sources, nano-devices and surface analysis.
We suggest some improvements in the contact between electrolyte and silver reservoir, relatively to the work of Escher et al. [19], where silver and electrolyte were introduced in a glass capillary. For example, tension strings could be used as a means of pressuring the silver reservoir against the electrolyte tip, as suggested in a recent solid state ion beam generator patent [23], whose general configuration is similar to the one in Figure 1.1. However, these extra components and the necessity of adding cases to attach the strings increase the complexity and costs of the emitter system.
While pressing the reservoir and electrolyte surfaces against each other, as made by Taralunga and Rus [9], would be suitable for flat surfaces, the deposition of RbAg4I5 on silver
Solid electrolyte Ag+
ions
HV Detector Silver
Chapter 1. Introduction
4
allows the adsorption of the evaporating electrolyte by silver. Physical vapour deposition, usually involving resistive thermal evaporation of the compound, or, more rarely, pulsed laser deposition have already been used to produce RbAg4I5 thin films on silver [10, 18]. Both
techniques have the advantage of being suitable for non-flat substrates, such as tips or micro-probes.
After some preliminary measurements obtained with silver wires dipped into melted RbAg4I5 have confirmed poor adherence between those compounds, resistive thermal
evaporation of RbAg4I5 was assumed as being the most suitable process to properly join the
silver reservoir and the solid electrolyte. Since the high malleability of the silver wire also contributes for the low adherence, silver rods (~1.3 mm of diameter) were sharpened and covered by RbAg4I5 thin film. Hence, it was obtained a final micro-probe from where Ag+ ions
are emitted from, under an applied voltage. The dependencies of the ionic current on the temperature and the applied voltage were studied as well as the stability of the current versus time.
The present dissertation contains nine chapters. In Chapter 2 some theoretical aspects on ionic conductivity in crystalline solids are presented as well as its relation with intrinsic defects in the crystalline structure. Some recent classifications of solid electrolytes are included too. Chapter 3 is devoted to RbAg4I5, focusing on the different phase transitions through which
RbAg4I5 might undergo and their effect on Ag+ mobility. Some processes recently used for its
production and deposition are described as well. In Chapter 4 detailed description of the physical processes of emission of silver ions from the electrolyte and oxidation of silver atoms from the reservoir can be found. Chapter 5 describes the fundamentals of resistive thermal evaporation (RTE), X-rays diffraction analysis (XRD) and time-of-flight secondary ion mass spectrometry (ToF-SIMS). Respectively, these techniques were used to deposit the electrolyte on silver reservoirs, for studying crystalline structure of silver reservoirs, RbAg4I5 powder and
RbAg4I5 thin films, and to identify Ag+ ions as the main emitted particles from the electrolyte.
5
Chapter 2.
Some General Aspects of Crystalline Solid Electrolytes
______________________________________________________________________
This chapter introduces some theoretical aspects of ionic conductivity in crystalline solids. It includes the origin of intrinsic defects in crystalline structures and their contribution to ionic conductivity, whether interstitial or through sites.
Classification of crystalline ionic conductors and solid electrolytes is also presented.
2.1. Origin and thermodynamics of intrinsic point defects in crystalline solids
At the absolute zero of temperature all ions would be in the respective positions in the lattice, therefore forming a perfect crystal. However, at any non-zero temperature there are always defects in crystalline structures, which usually fall into the following groups:- point defects: vacancies, interstitials and impurity atoms; - line defects, such as dislocations;
- planar effects, as grain boundaries;
- volume defects: voids or different phase presence.
Point defects are necessary for ion transport in ionic crystals [5],[24]. These might be formed in elemental or ionic crystals and fall into two main categories: intrinsic defects, if the stoichiometry of the compound is kept, and extrinsic defects, if the defects are created through the introduction of a foreign atom into the lattice.
Intrinsic defects corresponding to Schottky or Frenkel defects are represented in Figure 2. 1. Schottky defects are created when a pair of vacancies originated by single cation and single ion leaving their positions in the crystalline lattice. The creation of a single vacancy due to the wandering of one ion in interstitial sites results in a Frenkel defect.
(b) (c)
Figure 2. 1. Schematic illustration of (a) Schottky and (b) Frenkel defects in an ionic crystalline structure
Chapter 2. Some General Aspects of Crystalline Solid Electrolytes
6
The process of formation of intrinsic defects is always endothermic, meaning that energy is required for moving an ion, and the entropy increases as a result of the respective vacancy creation. Thus, the enthalpy of formation of the defects is balanced by the gain in entropy such that at equilibrium the overall change in free energy of the crystal is zero [26], according to the general equation of Gibb’s free energy for migration of ions:
where and correspond to the enthalpy and entropy of formation of defects and to the temperature in Kelvin.
Defects increase in concentration until the free energy reaches its minimum. Hence, in equilibrium, the vacancy concentration can be found through the minimization of the free energy of the crystal. For Schottky defects, Schottky pairs corresponds to an equal amount of anion vacancies, , and cation vacancies, , considering a 1:1 crystal lattice with N sites. Employing the Boltzmann formula to express the entropy of this system,
where k is the Boltzmann constant and is the number of different ways to randomly distribute Schottky pairs over sites. is hence equivalent to the product between ways to randomly distribute cations and ways to distribute anions. As in an ionic crystal the electrical neutrality is preserved, and can both expressed by:
Rewriting the entropy of the system and the free energy expression, we obtain, respectively:
At the equilibrium the free energy of Gibbs corresponds to the minimum with respect to changes in the number of defects, ,
and after some manipulation, we obtain:
Finally, using equation and considering N as being much higher than ns, the
number of Schottky pairs is:
and corresponds to the energy necessary for the creation of one Schottky defect. Similarly, the number of Frenkel defects can be described by:
Chapter 2. Some General Aspects of Crystalline Solid Electrolytes
7
In conclusion, at any non-zero temperature there are always defects since the amount of defects or increases with the temperature, as it is showed by equations (2.8) and (2.9). At
zero temperature Gibb’s free energy is dominated by the enthalpy, which has its lowest value, and, by increasing the temperature, the contribution from enthalpy to free energy becomes higher, according to equations and . Hence, the origin of the crystal defects arises from the system attempting to minimize the free energy through an increase in entropy.
2.2. Ionic Conductivity
Considering an ideal crystal, in which all of the constituent ions are arranged in a regular periodic fashion and often stacked in a close-packed form, the interstitial space available for the diffusion of ions might be just enough for the vibration around the equilibrium position. On the contrary, in the case of nearly perfect crystals, the existence of defects in the lattice is responsible for the ionic diffusion or, in other words, for the motion of ionic species through vacancies or interstitial sites. This diffusion of ions across a crystal lattice is the mechanism responsible for the ionic conductivity in solid electrolytes [26] so that the application of an external field creates a net ionic current.
According to the Einstein model, the probability P (per unit of time) for a given ion to jump from one site to another (interstitial or vacancy) is expressed by [27]:
where represents the frequency of the ions around their mean position in a potential well of barrier height equivalent to , Gibb’s free energy for the migration of ions.
Without electric field, an equal number of ions jumps in opposite directions. However, when an external electric field gradient, E, is applied, the jump probability of the ions, with charge q and interatomic space a, in and against the direction of the field, is respectively:
The number of ions per unit of volume moving in the direction of the applied field, , among n charge carriers per unit of volume is
and if assumed that , equation (2.13) might be rewritten as
Chapter 2. Some General Aspects of Crystalline Solid Electrolytes
8
and the ionic conductivity corresponds to the quotient between equation and the electric field gradient. Hence, we ontain:
Equation (2.17) can be generalized to an Arrhenius-type equation, described by
where stands for the pre-exponential factor, which coincide with and
for Schottky and Frenkel defects, respectively, and represents the
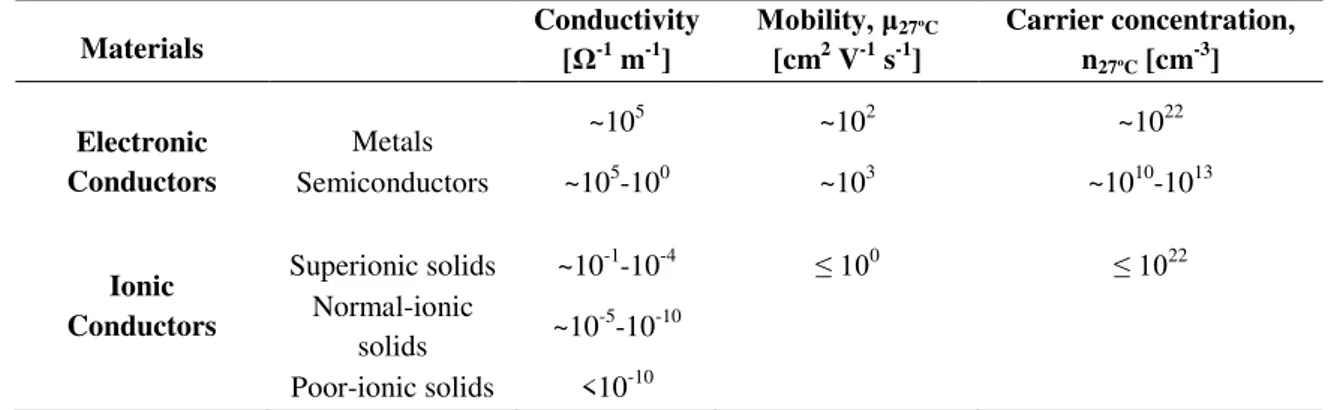
activation energy of ion motion. Activation energy is a phenomenological quantity used to describe the free energy barrier that an ion has to overcome for a successful jump between sites. Once displaced from the lattice, ions can diffuse and migrate between sites or interstitially. Table 2.1 list the sort of conductivities values.
Table 2.1. Conductivity, mobility and carrier concentration in electronic and ionic solids at room
temperature [5].
Materials
Conductivity [Ω-1 m-1]
Mobility, μ27ºC [cm2 V-1 s-1]
Carrier concentration, n27ºC [cm-3]
Electronic Conductors
Metals ~10
5 ~102 ~1022
Semiconductors ~105-100 ~103 ~1010-1013
Ionic Conductors
Superionic solids ~10-1-10-4 ≤ 100 ≤ 1022
Normal-ionic
solids ~10
-5-10-10
Poor-ionic solids <10-10
Superionic solids or solid electrolytes do actually cover different phases (crystalline and non-crystalline) of materials having in common a very high ionic conductivity (10-1-10-4 S m-1).
Solid electrolytes classification will be developed in the next sub-section. For the particular case of crystalline ionic solids, useful classification was proposed by Rice and Roth [27]based on the type of defect or disorder responsible for ionic conduction:
Type I: includes the ionic solids with low concentration of defects (~1018 cm-3), which
are usually poor ionic conductors at room temperature, such as NaCl or KCl. The main conduction mechanism is vacancy migration;
Type II: admits the ionic solids with high concentration of defects (~1020 cm-3), which
Chapter 2. Some General Aspects of Crystalline Solid Electrolytes
9
temperatures, namely ZrO2, CaF2, among others. Also in this type, the main conduction
mechanism is vacancy migration;
Type III: best superionic solids belong to this class. They exhibit an ionic lattice similar to ionic liquids, composed by mobile ions, since they contain at least one type of atoms highly delocalized over the available sites. Crystalline solids exhibiting high ionic conductivity are termed superionic solids, fast ion conductors, solid electrolytes or hyperionic solids. The best-known examples are Na-β-Alumina and RbAg4I5. The prevailing conduction mechanism is
interstitial migration, and the moving ions actually can be described as forming pathways. Recently, conduction pathways in a solid electrolyte were directly observed [28] through the existence of nanometer-sized spots at the solid electrolyte/vacuum interface. These emission spots form a pattern and constitute the ending of bulk ion conduction pathways.
2.3. General classification of solid electrolytes
We have previously focused on conduction mechanisms for crystalline solid electrolytes and, in fact, the presented theory is fully valid only for those materials. However, solid state superionic conduction also exists in other phases and a general classification of these materials, according to Agrawal and Gupta [5], includes, besides crystalline electrolytes, some other types:
- amorphous-glassy solid electrolytes; - polymer solid electrolytes;
- composite solid electrolytes.
Crystalline phase is the only where ions are ordered whereas the rest of the three different phases are not. Amorphous-glassy electrolytes and polymer electrolytes are microscopically disordered where composite electrolytes are macroscopically disordered materials.
As seen before, crystalline superionic solids can be understood as containing two sub-lattices: a rigid lattice within which a liquid like sub-lattice is enclosed and whose ions are movable. Ions are able to move interstitially or through vacancies, depending on the electrolyte.
Chapter 2. Some General Aspects of Crystalline Solid Electrolytes
10
conductivities lower than crystalline electrolyte's for the same movable ion and range of temperature.
Polymeric electrolytes are usually formed by the addition of ionic salts to complex polar polymers (extrinsic defects). In spite of frequently admitting the mobility of both positive and negative ions, as well as having advantageous properties such as flexibility, elasticity and transparency, polymeric electrolytes tend to have less mechanical strength, time stability and moderately high ionic conductivity (lower than 10-4Ω-1 cm-1). Considering theoretical aspects,
there are some phenomenological models to describe the ion transport mechanism but no fully accepted theory is available.
Finally, composite electrolytes are multiphase materials resulting on the mixture of different electrolytes in order to improve the total ionic conductivity. Therefore, crystal-crystal, crystal-glass or crystal-polymer composites might be produced and both phases simultaneously coexist in the composite system. One of the disadvantages of these compounds is their proneness to degrade upon ultraviolet radiation or heating. Once more, several models have been proposed and a summary might be found in the previously quoted review [5].
More recently a slightly different classification also based on the nature of the ionic conductivity was proposed by Karamov [29] which includes five groups:
- ionic crystals with low activation energy (usually less than 0.5 eV) and a large band gap. They can be said to be almost purely ionic (cationic or anionic) conductivity and electric insulators;
- non-stoichiometric compounds, whose elemental composition is not represented by a well-defined ratio, have both ionic and electronic conductivity;
- metals characterized by high solubility of hydrogen originating solid solutions with proton conductivity;
-non-stoichiometric compounds which become electrolytes when foreign ions are implanted;
11
Chapter 3.
RbAg
4I
5Solid Electrolyte
______________________________________________________________________
This chapter emphasizes the structural characteristics responsible for the high ionic conductivity of RbAg4I5. The influence of the different α, β and γ phases on ionic conductivity
is qualitatively described, based on the modifications occurring in the crystalline structure. The nature of each different phase transition is also presented. Some recently used production methods are described.
3.1. Crystalline Structure and Ionic Mobility
RbAg4I5 is an example of a silver ion solid conductor where exceptionally mobile Ag+
ions are responsible for its high ionic conductivity (0.124 Ω-1 cm-1 at 20ºC [2]
), presently the highest know. This electrolyte has very low electronic conductivity, 10-9 Ω-1 cm-1 [30] and
hence it can be considered an electric insulator.
This highly α conducting phase of RbAg4I5 is followed by two low temperature
transitions, occurring at 209 K and 122 K [31] and leading to β and γ phases, respectively. The
crystalline structure of RbAg4I5 can be generally understood as including a rigid component,
composed of rubidium and iodine ions, and disordered silver ions, randomly distributed over a number of interstitials sites and therefore drifting relatively freely through the anion lattice [3]. However, different α, β and γ phases introduce slight modifications in the crystalline structure
of RbAg4I5 which influence ionic mobility of silver ions and hence the ionic conductivity of the
electrolyte itself.
In the high temperature α-phase, crystal structure belongs to space group P4132 [32]
with lattice constant of 11.24 Å [33]. Each unit cell is cubic and contains four RbAg4I5: four Rb+
ions, sixteen Ag+ ions and twenty I- ions. The twenty iodine ions form shared faces tetrahedron
and the four rubidium ions are surrounded by highly distorted iodine octahedron, as represented in Figure 3.1 (a). Per each unit cell there are 56 sites available for solely 16 Ag+ ions thus
promoting the formation of channels (pathways) where silver ions can move through, as shown in Figure 3.1(b). Ag+ ions in α-phase have very low activation energy, 0.11 eV [34], and
therefore are virtually in a liquid state inside the rigid crystalline structure formed by I- and Rb+
Chapter 3. RbAg4I5 Solid Electrolyte
12
(a) (b)
Figure 3. 1. Representation of the (a) distorted iodine octahedron around a Rb+ ion and (b) crystal
structure of RbAg4I5, showing the cubic unit cell as the blue-lined box [33]. The larger spheres at right
correspond to I-, medium spheres to Rb+ and small spheres to Ag+ ions.
Considering 209 K transition, ionic conductivity initially seemed to vary very smoothly in the vicinity of the transition temperature, characteristic of a second-order transition. However, this transition was later proved to be first-order rather second-order by nuclear quadrupole resonance [35] and also by high-resolution thermal analysis on single crystal samples [36], which evidenced a small endothermic peak in the vicinities of 209 K. For this reason, sometimes this transition is also referred as "weakly first-order transition".
As the temperature decreases below 209 K, rhombohedral1 β-phase (trigonal crystal
system, rhombohedral unit cell) is formed. This belongs to space group R32 and presents a
structure similar to α-phase [36, 37], as evidenced In Figure 3.2 (a) and (b). In β-phase short contacts only exist within but not between different Ag+ clusters, showed in lower part of Figure
3.2 (b). However, in α-phase silver ions form a three-dimensional arrangement and short-cuts happened between 90% of the available sites [38], as represented in the lower part of Figure 3.2
(a). It seems that in β-phase silver ions move preferentially along the c-axis, establishing a preferential orientation for the movements of the ions and therefore the ionic conductivity is
lower than in α-phase.
1 The trigonal crystal system is one of the seven crystal systems, and the rhombohedral lattice system is
one of the seven lattice systems. The trigonal crystal system includes crystals of both hexagonal and rhombohedral lattices. Therefore, some crystals might be in the trigonal crystal system but not in the rhombohedral lattice system. However, crystals in rhombohedral lattice systems always belong to trigonal crystal system.
I-
Rb+
Ag+
[111]
I-
Rb+
Chapter 3. RbAg4I5 Solid Electrolyte
13
Regarding 123 K transition, it causes a discontinuity of two orders of magnitude in ionic conductivity [4]. Below that temperature, trigonal γ-phase is obtained and belongs to spacial group P3121 [38]. In γ-phase fewer short contacts exist in contrast to the other two high
temperature phases and several clusters are no longer interconnected, as can be observed in the lower part of Figure 3.2 (c).
Comparing Figure 3.2 (a), (b) and (c), one can see that the most pronounced structural
changes occurring along α, β and γ-phases are related with the silver partial structure and the disorder of silver ions decreases with decreasing temperature. In summary, at low-temperature the movement of Ag+ ions tends to occur within isolated clusters instead of within a
tri-dimensional sub-lattice liquid like lattice. The general dependence of ionic conductivity on temperature is represented in Figure 3.3. It can be seen that conductivity strongly increases with increasing temperature, showing Ag+ ions only move along lattice sites which are strongly
dependent on crystal imperfections. However, there are also some evidences that, in the particular case of RbAg4I5 solid electrolyte, ionic conductivity might be nearly
temperature-independent for temperatures below 75 K [40].
Figure 3. 2.Projection of the crystal structures of (a) α-RbAg4I5 at 295 K along the plane [111], (b) β
-RbAg4I5 at 150 K along plane [001] and (c) γ-RbAg4I5 at 90 K along the plane [001]. The upper part
Chapter 3. RbAg4I5 Solid Electrolyte
14
Figure 3. 3. Conductivity of Ag+ in RbAg4I5 in the temperature range of 125 K and 1000 K [39] .
3.2. Synthesis, characterization and deposition processes
RbAg4I5 is produced using a stoichiometric mixture of RbI and AgI, whose phase
diagram is represented in Figure 3.4.
Figure 3. 4. Phase diagram of RbI+AgI system [41]. The eutectic point (red colour) occurs at 197ºC for a
mixture with 30% of RbI.
The eutectic point occurs at 197ºC, with a 30% of RbI. Two incongruent melting points can be found at 298ºC for Rb2AgI3 and 228ºC for RbAg4I5. In particular RbAg4I5 is produced at
Chapter 3. RbAg4I5 Solid Electrolyte
15
However, RbAg4I5 have been synthesised by several groups using slightly different
stoichiometric mixtures of AgI and RbI.
Aiming to deposit RbAg4I5 through a thermal evaporation, Valov et al. [17] used a
mixture of AgI and RbI in the proportion 78:22, which was melted at 400 ºC for 2 hours in vacuum glass and then quenched and annealed at 160ºC for 15 hours. The powder was directly used in the deposition through thermal evaporation. This process was carried out in vacuum using a substrate temperature of 70 ºC and a deposition rate of 1 Å s-1 in order to obtain
homogeneous coverage and film crystallization.
The original proportion was kept by Shabanov et al. (20% of RbI, 80% of AgI) and the mixture was melted in an alundum crucible (fused alumina) in argon atmosphere. After cooling, the sample was kept at 200ºC for 48 hours for homogenization [41]. In this case, deposition was not performed but α-phase electrolyte was successfully produced.
Yang et al. [42] also used 20% of RbI in the mixture and heated it to 400ºC. According to the phase diagram in Figure 3.3, the mixture is liquid at that temperature and a slow cooling could result in a mixture of AgI, Rb2AgI3 and RbAg4I5. Hence, the mixture was rapidly
quenched from 400ºC to room temperature in order to obtain a pure RbAg4I5 phase. The mixture
was then annealed at 150ºC for several hours, to promote crystallinity and the stability of the electrolyte. In these experiments, pulsed laser deposition instead of thermal deposition was used to produce thin films.
Lee et al. [10] used a mixture of electrolytes with 17% of AgI, which was placed in a ceramic crucible and then heated to 450ºC at a rate of 10 ºC/min. After annealing for one hour at 450ºC, the temperature was slowly decreased and the resulting sample was crushed into powder. In this case, samples for electrochemical nanopatterning were aimed. They were fabricated by placing the RbAg4I5 powder on silicon wafer and heating to 450ºC at a rate of 10ºC/min,
resulting on crystalline electrolyte film with thickness below 1 mm.
Finally, an study on the percentage reactants was conducted by Cao et al. [43] determining that when the percentage of RbI in the range of 15-16 % of the initial mixture almost all single-phase films are formed during thermal evaporation. However, using the expected proportion of reactants, Rb2Ag4I3 is also formed, showing a deviation from the
expected composition, probably due to the partial decomposition of AgI during evaporation process.
There are other examples of procedures recently used to produce RbAg4I5 but this brief
Chapter 3. RbAg4I5 Solid Electrolyte
16
17
Chapter 4.
Ion Source Based on RbAg
4I
5Solid Electrolyte
______________________________________________________________________
This chapter describes the physical processes occurring at the surface of the electrolyte and at the silver/RbAg4I5 interface. Under an accelerating voltage, Ag+ ions migrate and diffuse
through pathways in the electrolyte until reaching the apex of the micro-probe, where they are emitted. The system can be represented as an electrochemical system, with redox reactions taking place in it. The oxidation of silver atoms at the silver reservoir allows the entrance of new Ag+ ions into the electrolyte. At the base of the Faraday Cup, incident ions are reduced into
neutral species.
4.1. Brief description of the emitter system
The main components of the system are a silver tip, covered with RbAg4I5 film and an
ion collector (Faraday cup), which grounded input electrode plays the role of an accelerator of the emitted ions. The silver tip covered with the electrolyte has a double purpose in the system: while the silver will constitute a reservoir of Ag+ ions, the electrolyte is a mean for the
movement and emission of those ions.
By
applying a high potential to this assemble with respect to the grounded input electrode of ion collector, Ag+ ions are emitted from RbAg4I5 and at the same time replaced by
ionized silver atoms in the interface silver-electrolyte. Therefore, with this simple system ionic current can be measured.
Three main phenomena take place in the described ion emitter:
- compensation of emitted Ag+ ions, through an oxidation reaction occurring at the
silver reservoir/electrolyte interface;
- motion of ions inside the electrolyte under the presence of an electric field; - emission of the Ag+ ions from the electrolyte surface.
4.2. Oxidation and reduction of Silver Ions
4.2.1. An ions source as an electrochemical system
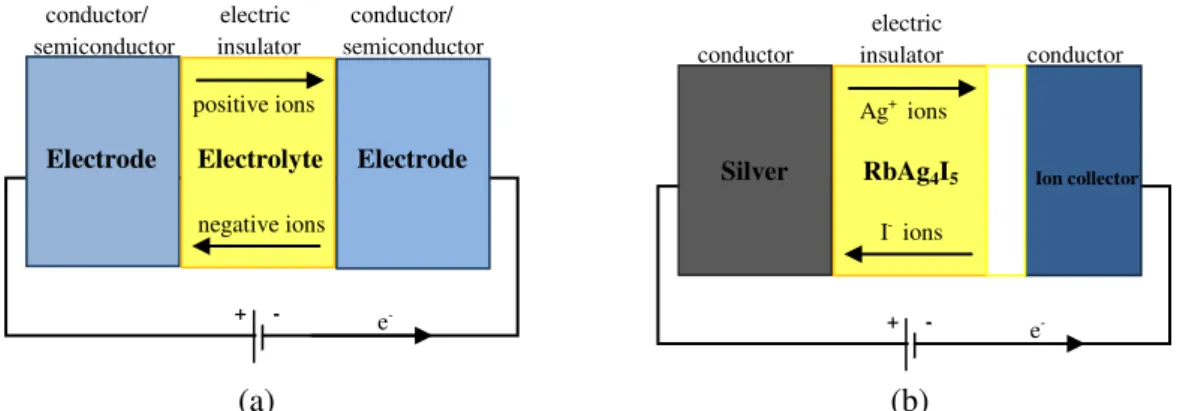
The usual components of an electrochemical system are two electrodes separated by an electrolyte, as represented in Figure 4.1 (a). In this type of systems, electrochemical reactions, also known as redox (reduction/oxidation), occur at the electrode/electrolyte interfaces.
Chapter 4. Ion Source Based on RbAg4I5 Solid Electrolyte
18
an electrochemical reaction has two parts: reduction and oxidation. Oxidation corresponds to the lost of electrons from the reactant and reduction involves a gain of electrons of the reactant. The electrode where oxidation takes places is called anode while the electrode where reduction occurs is called cathode. It is important to stress that in electrochemical reactions, oxidation and reduction take place in distinct electrodes. On the contrary, in a chemical redox reaction oxidation and reduction occur at the same electrode. Besides, a chemical redox reaction is not limited to the interface region while an electrochemical reaction occurs exclusively at the interface between the electrode and the electrolyte.
Electrochemical reactions can hence be defined as chemical reactions depending on a potential difference in the interface, a region where electrical field is high enough to affect or induce a chemical reaction. When a voltage is applied between electrodes, a voltage drop occurs at the interface electrode/electrolyte, due to the accumulation of charges at the surface of the electrode, attracting opposite charges from the electrolyte, as represented in Figure 4.1 (a).
In our system, represented in Figure 4.1 (b), one of the electrodes is constituted by the silver reservoir covered by RbAg4I5 electrolyte. We considered only the very ending of the
micro-probe, so that the sharpened shape is not visible. There is a vacuum volume separating this assemble from the collector electrode. When a positive voltage is applied, Ag+ ions are
attracted to the ion collector. The iodine negative ions are not likely to move in the opposite direction, since they belong to the rigid sub-lattice of RbAg4I5, as Rb+ ions. However, their
attraction to the silver electrode in this situation is also symbolically represented in Figure 4.1 (b).
(a) (b)
Figure 4. 1.Schematic representation of (a) a simple electrochemical system and (b) the proposed Ag+
emitter system.
As a consequence of this movement of ions, the electroneutrality condition fails in the interface silver/electrolyte and a double layer of charges with opposite sign is formed: a positive layer in the metal side and a negative layer in the electrolyte side, forming the called double layer.
conductor/ electric conductor/ semiconductor insulator semiconductor
+ -
Electrode Electrolyte Electrode
e- negative ions positive ions
electric
conductor insulator conductor
+ - e- I- ions
Ag+ ions
Chapter 4. Ion Source Based on RbAg4I5 Solid Electrolyte
19
4.2.2. Ag/RbAg4I5 interface: double layer and pseudocapacitance
Several models have already been suggested to simulate the effect of the double layer in solid/aqueous interfaces namely by Helmholtz, Gouy-Chapman and Stern. The Ag/RbAg4I5
interface can also be realized as a solid/aqueous one, since in a electrolyte with high ionic mobility the motion of its movable ion is almost as free as in liquids.
Helmholtz model was the first proposed and the simplest one. In analogy with a solid state capacitor, two parallel layers of charges are separated at a fixed distance by solvent molecules originating a linear potential drop across the interface. In the Gouy-Chapman model the thickness of the double layer is no longer fixed but dependent on the electrical field (tending to maintain the order) and thermal effects (tending to make the arrangement random). Stern model, the most widely accepted, is a hybrid one, combining both previous models and considering some of the charges as being fixed and others as spread out. Figure 5.4 presents a general illustration of a double layer at the interface between a positive charged metal and an electrolyte in a solution whose solvent is water.As a consequence of the electrostatic forces between ions and the dipolar structure of the water, all ions in the aqueous solution are in their solvated form, having water molecules surrounding them.
Figure 4. 2. Stern model of a general double layer formed in the interface between a positively charged
surface and an electrolyte in aqueous solution [44]. Solvated cations migrate and adsorb to the electrolyte surface due to electrostatic forces. Potential drop is represented on the interface.
Chapter 4. Ion Source Based on RbAg4I5 Solid Electrolyte
20
This capacitive charging of the double layer allows to electrostatically stores energy in proportion to the area of the double layers of the electrodes. It is important to notice that this process does not involve actually any electron transference but only physically adsorbed charges into the double layer. For this reason, the double layer capacitance is sometimes referred as purely electrostatic capacitance.
A different type of electrochemically storage, involving the passages of charges across the double layer, is also possible via the so-called pseudocapacitance. This phenomenon is also called Faradaic, attending to the electron transference between reactant species. From the experimental point of view it is difficult to distinguish whether charge is capacitivelly or Faradaically stored.
A thermodynamic measure of the stored energy is hence a combination of both chemical and electrical potentials, known as electrochemical potential. For certain specie it is given by:
where is the chemical potential, is the charge number of the species, the Faraday constant and the electric potential in volts. The electrostatic potential corresponds to .
For an electrochemical system at constant pressure and temperature, another form to measure the energy is using Gibbs free energy. For a system presenting two electrodes, the change in Gibbs energy due to each half-cell redox reaction occurring at the respective electrode, is expressed by:
where corresponds to Gibbs free energy and to the stoichiometric coefficient of species .
The polarity of is a measure of the tendency of a reaction to occur. Since in equation electrodes were arbitrary defined as positive and negative, respectively, a negative value of means that the reaction in the positive direction (anodic) requires negative energy for being spontaneous. On the contrary, if is positive, it means that a minimum energy is required for the reaction in the negative direction (cathodic) to take place.
When a potential difference is externally set across the electrodes spontaneous reactions can be interrupted or non-spontaneous can be forced to occur, depending on the intensity and polarity of the applied potential difference. This potential is related to the Gibbs energy through the following equation:
Chapter 4. Ion Source Based on RbAg4I5 Solid Electrolyte
21
reservoir are oxidized into Ag+ ions at the interface Ag/RbAg
4I5. The half-reactions correspond
to:
According to the equations and and attending to the convention used, a more positive potential leads to more negative and thus tends to promote oxidation (i.e. loss of electrons) in the positive direction (anode). A negative potential (positive ) tends to promote reduction (gain of electrons) in the cathode.
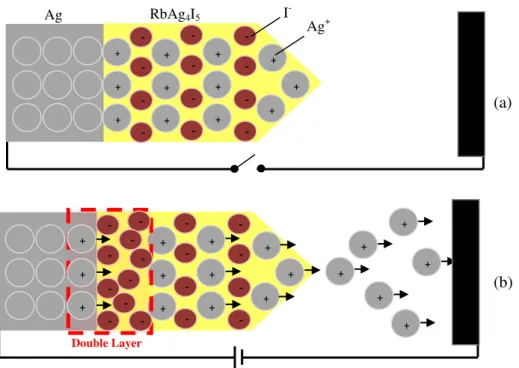
The suggested emitter system and the double layer with pseudocapacitance phenomena are illustrated in Figure 4. 3. In Figure 4.3 (a) ions do not experience yet the effect of the applied voltage and thus the net current of Ag+ ions is zero. Fixed Rb+ ions are not included but only
movable Ag+ ions and quasi-fixed I- ions.
When high voltage is set between electrodes, silver atoms in the anode are oxidized into Ag+ atoms, forming a double layer along with I- ions in the electrolyte side, as represented in
Figure 4.3 (b). If RbAg4I5 was usual electric insulator, recently originated Ag+ would not be able
to leave the positive monolayer. However, attending to the high ionic mobility of these ions in RbAg4I5, Ag+ ions at the interface can move into the bulk electrolyte and be emitted once
reached the apex of the emitter. When ions are collected in a Faraday cup, neutralization takes place, through a reduction reaction.
(a)
(b)
Figure 4. 3. Schematic representation of the emitter system (a) before high voltage is applied and (b)
after the double layer is formed at the interface silver/electrolyte, where oxidation of silver atoms takes place. + + + + + + + + + - - - - - - - - - - - - + + + Double Layer + + + + + + + + + - - - - - - - - + + + + + + - - - - - - - - - - + + +
Ag RbAg4I5
Ag+
-Chapter 4. Ion Source Based on RbAg4I5 Solid Electrolyte
22
4.3. Transport of Ag
+ions under an applied voltage
Two main types of transport mechanisms can be considered in our electrochemical system - diffusion and migration. In systems containing aqueous electrolytes convection should be additionally regarded.
Under an electric field influence, ions move in a direction, which depends on the polarity of the applied field between electrodes. Cations migrate from the positively charged electrode towards the cathode, in the direction which is opposing to the electric field. Anions move in the direction of the electric field or from the negatively charged electrode towards the anode.
The flux density of ions migrating in these circumstances is expressed by the product between the concentration of species and their velocity:
where is the concentration of species in mol m-3, the charge number of the species, the
mobility of the species in m2 mol J-1, the Faraday constant and the electric potential in
volts.
Non-uniform concentration can result from the addition of extrinsic dopants or migration under an electric field. The existence of concentration gradient drives the species to move tending to make the concentration uniform. In that situation, the flux density is expressed by:
where corresponds to the diffusion coefficient of species in m2s-1. In the particular case of
our proposed emitter system, the entrance of Ag+ ions from the reservoir into the electrolyte
crates a higher local concentration of those ions, which will tend to move across the bulk of the electrolyte. Another region with non-uniform concentration is probably the apex of the micro-probe, from where Ag+ ions are emitted.
The net flux density can be approximated as a combination of the flux density associated to migration and diffusion:
Chapter 4. Ion Source Based on RbAg4I5 Solid Electrolyte
23
4.4. Emission of Ag
+ions
4.2.1. Field Ion Emission
In the focused ion beam developed by Escher et al. [19], whose structure is similar to our described in subchapter 4.1., Ag+ ions are considered to be field emitted from
(Ag)0.5(AgPO3)0.5 solid amorphous electrolyte.
Field ion emission is the extraction of a surface atom from its own lattice as an ion under the influence of very high local field. In general, field ion emission consists of two steps: the initial escape of atoms from the surface followed by ionisation when they move away from the surface [45]. Hence, the term field emitted as employed by Escher et al. [19] is not entirely accurate, since only escape without ionization occurs in case of solid electrolytes.
Also, field ion emission might refer either to field evaporation or field desorption [45]. In the first process, ions from a liquid or solid surface are repelled due to the magnetic field. In the second, adsorbed ions, which do not belong to the lattice, are emitted. From a theoretical point of view, there are no significant differences.
In the present work it is assumed that there is a negligible amount of foreign atoms in the electrolyte and hence we are dealing mainly with lattice ions. Admitting only the emission of lattice ions and considering it as involving one single process, namely escape, without ionization, the emission of ions from RbAg4I5 might be understood as a usual field evaporation
escape process. This statement is also sustained by the existence of field evaporation from ionic liquids, usually by forming Taylor cones [46, 48], where ions are directly emitted from the electrolyte.
4.2.2. Field evaporation escape processes
Since the experimental evidence for conduction pathways in solid electrolytes was found [28], in the sequence of the development of ion source [19], it is possible to assume the end of those pathways at the surface of the electrolyte as the emission centres of ions. In our case, the sharpened shape of the emitter makes it possible to assume the apex as the main emitter centre, which is equivalent to admit that the pathways endings are mainly concentrated in that region.
In the general case of a solid electrolyte needle-shaped and set to a high voltage , the electric field generated at its apex is expressed by:
Chapter 4. Ion Source Based on RbAg4I5 Solid Electrolyte
24
Once they reach the end of the pathways, Ag+ ions are assumed to be emitted with zero
kinetic energy and fly towards the neutral electrode. The final kinetic energy is proportional to the potential difference between electrodes and can be expressed by:
where is the charge of ions. If the kinetic energy is aimed to be expressed in eV, will equivalent to +1 for Ag+ ions.
Considering usual field evaporation escape processes, i.e. in the absence of pathways, atoms are emitted through electron or gas-atom bombardment or using thermally activated evaporation. This last can be used to estimate the influence of temperature in our system, if it is heated. According to the work developed by Forbes and Zurlev [49] the evaporation flux (atoms/s) is given by
where is the amount of atoms at high risk of being field evaporated and is the field evaporation rate constant (s-1) for these atoms. In the case of a micro-probe of RbAg
4I5 the
amount of ions at highest risk would be those in apex surface. More accurately, an estimative of the amount of pathways on that surface could be used instead of the entire apex area.
Field evaporation rate constant depends on the temperature following the Arrhenius type equation:
![Figure 1. 1. Schematic drawing of the ion source developed by Escher et al. [19].](https://thumb-eu.123doks.com/thumbv2/123dok_br/16546484.736949/21.892.317.599.356.566/figure-schematic-drawing-ion-source-developed-escher-et.webp)
![Figure 2. 1. Schematic illustration of (a) Schottky and (b) Frenkel defects in an ionic crystalline structure [25]](https://thumb-eu.123doks.com/thumbv2/123dok_br/16546484.736949/23.892.224.667.897.1076/figure-schematic-illustration-schottky-frenkel-defects-crystalline-structure.webp)
![Figure 3. 1. Representation of the (a) distorted iodine octahedron around a Rb + ion and (b) crystal structure of RbAg 4 I 5, showing the cubic unit cell as the blue-lined box [33]](https://thumb-eu.123doks.com/thumbv2/123dok_br/16546484.736949/30.892.230.738.106.348/figure-representation-distorted-iodine-octahedron-crystal-structure-showing.webp)
![Figure 3. 2. Projection of the crystal structures of (a) α -RbAg 4 I 5 at 295 K along the plane [111], (b) β - -RbAg 4 I 5 at 150 K along plane [001] and (c) γ -RbAg 4 I 5 at 90 K along the plane [001]](https://thumb-eu.123doks.com/thumbv2/123dok_br/16546484.736949/31.892.133.761.119.526/figure-projection-crystal-structures-rbag-plane-rbag-plane.webp)
![Figure 3. 4. Phase diagram of RbI+AgI system [41]. The eutectic point (red colour) occurs at 197ºC for a mixture with 30% of RbI](https://thumb-eu.123doks.com/thumbv2/123dok_br/16546484.736949/32.892.345.550.105.349/figure-phase-diagram-eutectic-point-colour-occurs-mixture.webp)
![Figure 4. 2. Stern model of a general double layer formed in the interface between a positively charged surface and an electrolyte in aqueous solution [44]](https://thumb-eu.123doks.com/thumbv2/123dok_br/16546484.736949/37.892.293.603.601.825/figure-general-interface-positively-charged-surface-electrolyte-solution.webp)