of Chemical
Engineering
ISSN 0104-6632 Printed in Brazil www.scielo.br/bjce
Vol. 35, No. 02, pp. 299 - 312, April - June, 2018 dx.doi.org/10.1590/0104-6632.20180352s20160282
LIQUID-LIQUID EQUILIBRIA DATA OF
N-METHYL-2-HYDROXYETHYL AMMONIUM
ALKYLATES WITH BUTANOL+WATER AND
PENTANOL+WATER AT 293.15K, 313.15K AND
333.15K
Karina S. Amorim
1, Amanda G. Soares
1, Fernanda M. Ganem
1, Erik A.
de Souza
1and Silvana Mattedi
1,*1Chemical Engineering Graduate Program, Polytechnic School - Federal University of Bahia,
Rua Aristides Novis, 2 Federação, CEP: 40.210-630 .Salvador - BA, Brazil.
(Submitted: May 1, 2016; Revised: November 4, 2016; Accepted: November 29, 2016)
Abstract - Ionic liquids (ILs) are organic salts with low volatility and have different applications including organic synthesis, separation and extraction processes, fuel cell electrolyte, surfactants, among others. Protic ILs based on the N-methyl-2-hydroxyethyl ammonium cation and short chain carboxylic anions have simple synthesis
and purification. However, as new substances few data are available for their thermodynamic properties and
phase equilibria. In order to investigate the partition of these substances in alcohol-water, liquid-liquid equilibria data were determined experimentally for three ionic liquids (formed by the cation N-methyl-2-hydroxyethyl ammonium (m-2HEA) and the anions propionate (Pr), butanoate (B) and pentanoate (P)) with butanol and
pentanol, at three different temperatures: 293.15K, 313.15K and 333.15K. The binodal curves are obtained by the turbidity method with gravimetric determination of all the components, curves are fitted using the Merchuk method. The tie-lines are also gravimetrically determined. The results confirm the high hydrophilicity of these ionic liquids, with partition coefficients of water-butanol and water-pentanol lower than 1. Data were correlated
with UNIFAC.
Keywords: Ionic liquid, Partition, Solubility, Thermodynamic equilibrium.
INTRODUCTION
Ionic liquids are a class of organic or mixed salts that have a melting point lower than 373.15K. These
liquids have many applications in the fields of elec -trochemistry, catalysis, separations, surfactants, elec-trolytes for fuel cells, among others. They show great
advantage compared to traditional organic solvents due to their extremely low volatility that prevents air contamination. Because of this feature, many works in the past claimed that they were green solvents, but many ionic liquids are toxic (Latala et al., 2005) and
effluents or spills could contaminate aquifers and con
-sequently affect the flora and the fauna present in the
enviroment. Studies indicate that ionic liquids based on imidazolium are more toxic than protic ionic liqui-ds (PIL) based on amines and short - chain aciliqui-ds and that the toxicity is related to the hydrophilicity / lipo-philicity of the ionic liquid (Peric et al., 2014, Oliveira et al. 2016). They are formed by a Bronsted- Lowry acid-base reaction (Drummond and Kennedy, 2009) that, unlike aprotic ionic liquids, have labile pro-tons and are able to form a hydrogen bond network. Furthermore, LIPs have a low preparation cost becau-se of a simple one-step synthesis (Alvarez et al., 2010),
not requiring additional purification steps.
N-Methyl-2-hydroxyethylammonium carboxylates could be used to separate undesirable sulphur components from diesel (Oliveira et al., 2012), are selective to carbon dioxide/methane separation (Carvalho and Coutinho, 2011) and could modify silica to encapsulate enzymes (Souza et al., 2013, Oliveira et al., 2014). The deve-lopment of processes based on these compounds ne-eds a lot of data and models that represent these data.
Thermodynamic properties (density at different pres
-sures, pure and in mixtures, sound velocities, calorific
capacities, viscosities and refractive index) of these compounds have been studied (Alvarez et al, 2010; Alvarez et al., 2013; Talavera-Prieto et al., 2014; Li et al., 2015; Li et al. 2016); however, few liquid-liquid data are available in the literature. Water and alcohol form a two phase system which is interesting to study as it could be used to purify substances. The aim of
this work is to obtain liquid-liquid equilibrium data in
two different systems: butanol + ionic liquid + water
and pentanol + ionic liquid + water.
EXPERIMENTAL
The properties of each compound are shown in Table 1. The ionic liquids used are simply synthe-sized in the laboratory from short - chain carbo-xylic acids and substituted amines with 1: 1
stoi-chiometry. The amine is placed in a three neck flask equipped with a reflux condenser. The acid is ad
-ded dropwise to the flask at 25 °C under stirring by
magnetic stirrer bar. The synthesis is carried out in an inert atmosphere using nitrogen gas avoiding pa-rallel reactions. In this work we used N-methyl-2-hydroxyethylammonium propionate (m-2HEAPr) N-methyl-2-hydroxyethylammonium butanoate (m--2HEAB) and N-methyl-2-hydroxyethylamonium pentanoate (m-2HEAP). The synthesis was performed in a nitrogen atmosphere and at the end of the reaction nitrogen was bubbled for a half hour to remove unre-acted compounds. The reaction is a Bronsted acid-base neutralization forming a protic ionic liquid. The water content was measured using a Mettler Toledo V20 vo-lumetric Karl Fischer titrator before each experiment and considered in the calculation. The 1H-NMR
spec-tra of the ionic liquids were obtained to confirm the
structure and purity of the synthesized compounds.
Table 1. Properties of the pure components.
Component Molar Mass
(g.mol-1) Purity (g/g) Determined by Supplier
2-hydroxyethylamine 61.08 0.99 CG1 Sigma-Aldrich
Propionic acid 74.09 0.98 CG1 Merck
Butanoic acid 88,11 0.98 CG1 Merck
Pentanoic acid 102.13 0.98 CG1 Merck
N-methyl-2-hydroxyethylamine 73.14 0.987 CG1 Synth
m-2HEAPr 149.19 > 0.99 NMR2 Synthesized for this work
m-2HEAB 163.22 > 0.99 NMR2 Synthesized for this work
m-2HEAP 177.24 > 0.99 NMR2 Synthesized for this work
1-Pentanol 88,15 0.99 CG3 Sigma-Aldrich
1-Butanol 74.12 0.99 CG3 Sigma-Aldrich
Water 18.0 > 0.99 Condutivimetry MilliQ and double distilled
1GC performed by the manufacturer and used without further purification. 2Verified through NMR spectra, water content measured by Karl-Fisher titration
before each experiment and considered to calculate compositions. 3Confirmed by GC for this work.
Solubility data for the ternary mixture were deter-mined using the cloud point method (Nemati-Kande et al., 2012). The vial was closed with a septum and a cap to prevent any evaporation and kept stirring using
a magnetic bar. Each component was added to the vial using a syringe.
changes were measured with an analytical balance (Shimadzu AX200, accuracy of ± 0.0001g) and used to calculate the composition of components in the bi-nodal curve. The values of the compositions of ILs we-re corwe-rected according to water content of each
com-pound. The experimental binodal curves were fitted
using Merchuk et al. (1998) (equation 1),
(101.2 kPa) can be seen in Figures 1 - 6. It is impor-tant to note that the room pressure was checked every day during the experiments, and an average pressure of 101.2 kPa was obtained with standard deviation of 0.1 kPa. The experimental binodal data of all systems studied are shown in Tables 2 - 7. The uncertainties in the values of the mass fractions of each system compo-nent can be determined by calculating the uncertainty of adding an extra drop of water or alcohol to the sys-tem during the determination of the binodal through the cloud point method. The mass and its uncertainty for an extra drop in the aqueous phase was 0.0151 ± 0.00003g, for the butanol phase was 0.0052 ± 0.0002g and for the pentanol phase was 0.0063 ± 0.00004g. These values were used to calculate the combined uncertainty in each phase. It was observed that the imiscibility gap decreases with increasing temperatu-re. This behavior is expected as it is similar to other
water-alcohol systems, the salting-in effect of the IL
increasing with temperature. Similar behavior was ob-served by Nann et al. (2013) with aprotic ionic liquids. By analyzing IL behavior at the same temperature, it is observed that the increase in the anion chain length induces an increase in solubility, decreasing the mis-cibility gap. The hydrophobicity of the ionic liquid is increased by the anion chain and it helps to enhance the alcohol-water mutual solubility as can be seen in
Figs . 7 - 12. Thus, the IL surfactant effect is enhanced
as the anion chain length is increased, which is also an expected behavior (Santos et al., 2010; Greaves and Drummond, 2014).
(1)
where 100wa and 100wwater are the alcohol and water
weight fractions, respectively, and A, B, and C are fit -ted parameters obtained by least-squares regression.
Mixtures with compositions in the region of immis-cibility were prepared by weighing known masses of each component and discharged in a glass cell with a stopper. The prepared mixtures were placed in a ther-mostatic bath and stirred for 40 minutes. Afterward, the systems were centrifuged for 10 minutes to faci-litate the separation and then allowed to rest for 24 hours at controlled temperature to guarantee the equi-librium. Afterwards, the organic phase was carefully collected and weighed.
Data were modelled with UNIFAC. The parameter estimation amn from the UNIFAC model was done by minimizing the objective function (eq. 2).
(2)
D represents the quantity of systems used, Nk and Ck
the number of experimental points and components, respectively, in each system k. The TML-LLE program
(Stragevitch and d’Ávila, 1997), based on a modified
simplex procedure, was used to estimate the interac-tion parameters. The code could treat several systems
with different numbers of components and at several
temperatures simultaneously (Santos, 2005). Each io-nic liquid (cation-anion pair) was considered as a new single group and only interaction parameters between them and the solvent groups need to be reestimated.
Volume and area (R and Q) parameters for ionic li-quid groups are not available in the literature and were derived by optimizing the ionic liquid geometry wi-th density-functional wi-theory (DFT) performed wiwi-th a quantum mechanics software and then calculating van der Waals area and volume with the polarizable conti-nuum model (PCM).
RESULTS
The binodal curves for each water + IL+ butanol systems and water + IL + pentanol system at three
different temperatures and at atmospheric pressure
Figure 1: Binodal curves for water + IL + butanol, in mass fraction, at
Figure 2: Binodal curves for water + IL + butanol, in mass fraction, at 313.15K: m-2HEPr (black), m-2HEAB (red) and m-2HEAP (blue).
Figure 3: Binodal curves for water + IL + butanol, in mass fraction, at
333.15K: m-2HEPr (black), m-2HEAB (red) and m-2HEAP (blue).
Figure 4: Binodal curves for water + IL + pentanol, in mass fraction, at
293.15K: m-2HEPr (black), m-2HEAB (red) and m-2HEAP (blue).
Figure 5: Binodal curves for water + IL + pentanol, in mass fraction, at
313.15K: m-2HEPr (black), m-2HEAB (red) and m-2HEAP (blue).
Figure 6: Binodal curves for water + IL + pentanol, in mass fraction, at
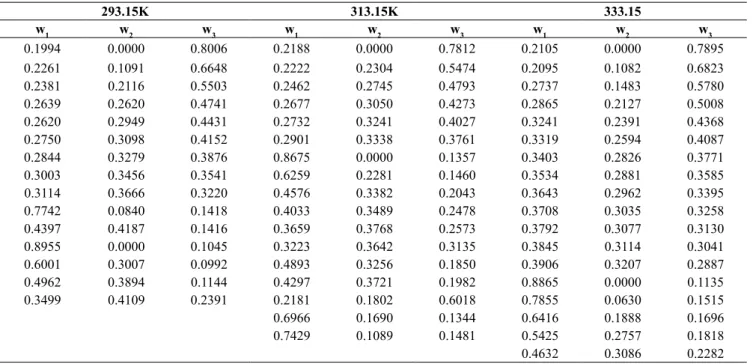
Table 2. Binodal curve data: Mass fraction (w) of Cloud Points of water (1) + m-2HEAPr (2) + Butanol (3) Systems at P = 101.2 kPa and 293.15, 313.15 and 333.15 K
293.15K 313.15K 333.15
w1 w2 w3 w1 w2 w3 w1 w2 w3
0.1994 0.0000 0.8006 0.2188 0.0000 0.7812 0.2105 0.0000 0.7895
0.2261 0.1091 0.6648 0.2222 0.2304 0.5474 0.2095 0.1082 0.6823
0.2381 0.2116 0.5503 0.2462 0.2745 0.4793 0.2737 0.1483 0.5780
0.2639 0.2620 0.4741 0.2677 0.3050 0.4273 0.2865 0.2127 0.5008
0.2620 0.2949 0.4431 0.2732 0.3241 0.4027 0.3241 0.2391 0.4368
0.2750 0.3098 0.4152 0.2901 0.3338 0.3761 0.3319 0.2594 0.4087
0.2844 0.3279 0.3876 0.8675 0.0000 0.1357 0.3403 0.2826 0.3771
0.3003 0.3456 0.3541 0.6259 0.2281 0.1460 0.3534 0.2881 0.3585
0.3114 0.3666 0.3220 0.4576 0.3382 0.2043 0.3643 0.2962 0.3395
0.7742 0.0840 0.1418 0.4033 0.3489 0.2478 0.3708 0.3035 0.3258
0.4397 0.4187 0.1416 0.3659 0.3768 0.2573 0.3792 0.3077 0.3130
0.8955 0.0000 0.1045 0.3223 0.3642 0.3135 0.3845 0.3114 0.3041
0.6001 0.3007 0.0992 0.4893 0.3256 0.1850 0.3906 0.3207 0.2887
0.4962 0.3894 0.1144 0.4297 0.3721 0.1982 0.8865 0.0000 0.1135
0.3499 0.4109 0.2391 0.2181 0.1802 0.6018 0.7855 0.0630 0.1515
0.6966 0.1690 0.1344 0.6416 0.1888 0.1696
0.7429 0.1089 0.1481 0.5425 0.2757 0.1818
0.4632 0.3086 0.2282
Titration uncertainty to a drop mass of butanol: 0.0052 ± 0.0002g. Titration uncertainty to a drop mass of water: 0.0151 ± 0.00003g.
u(P)=0.1 kPa; u(T)=0.1 K; U(w)=0.0008 (aqueous phase) and U(w)=0.02 (butanol phase)
Table 3: Binodal Curve data: Mass fraction (w) for Cloud Points of water (1) + m-2HEAB(2) + Butanol (3) Systems at P=101.2 kPa and 293.15, 313.15 and 333.15 K
293.15K 313.15K 333.15
w1 w2 w3 w1 w2 w3 w1 w2 w3
0.8809 0.0000 0.1191 0.2273 0.0000 0.7727 0.2533 0.0000 0.7467
0.6012 0.1670 0.2318 0.2974 0.0491 0.6535 0.3645 0.0592 0.5763
0.2158 0.0000 0.7842 0.3492 0.0757 0.5751 0.4338 0.0753 0.4909
0.2677 0.0557 0.6767 0.4078 0.0949 0.4973 0.5009 0.0919 0.4071
0.2287 0.1934 0.5780 0.4585 0.1075 0.4340 0.5370 0.0976 0.3654
0.5475 0.1375 0.3150 0.4875 0.1139 0.3985 0.5695 0.1002 0.3303
0.5352 0.1568 0.3080 0.5172 0.1176 0.3652 0.5976 0.1051 0.2973
0.5685 0.1456 0.2860 0.5483 0.1236 0.3281 0.6192 0.1085 0.2723
0.5956 0.1502 0.2542 0.5850 0.1256 0.2894 0.6395 0.1103 0.2502
0.6090 0.1558 0.2352 0.6003 0.1329 0.2668 0.6523 0.1131 0.2346
0.6005 0.1676 0.2319 0.6199 0.1355 0.2446 0.8150 0.0000 0.1850
0.2729 0.0552 0.6719 0.6338 0.1367 0.2296 0.6641 0.1149 0.2211
0.3647 0.0843 0.5510 0.6477 0.1383 0.2139 0.7538 0.0692 0.1770
0.3879 0.0971 0.5149 0.6595 0.1397 0.2008
0.4255 0.1102 0.4643 0.6713 0.1405 0.1882
0.4643 0.1219 0.4138 0.6809 0.1413 0.1777
0.8330 0.0858 0.0812 0.9293 0.0000 0.0707
0.6632 0.1498 0.1869 0.8336 0.0857 0.0807
0.7814 0.1086 0.1100 0.7584 0.1326 0.1090
0.7602 0.1187 0.1211
0.7443 0.1312 0.1245
Titration uncertainty to a drop mass of butanol: 0.0052 ± 0.0002g. Titration uncertainty to a drop mass of water: 0.0151 ± 0.00003g.
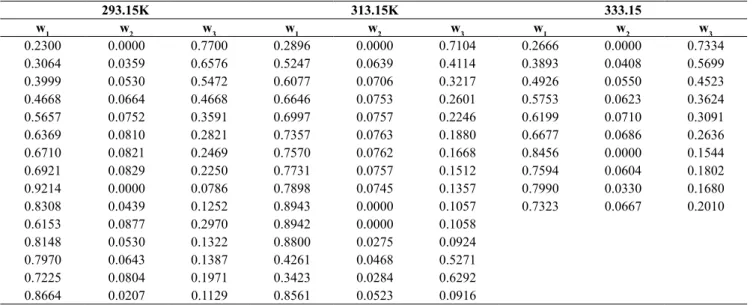
Table 4: Binodal curve data: Mass fraction (w) of Cloud Points of water (1) + m-2HEAP (2) +Butanol (3) Systems at P = 101.2 kPa and 293.15, 313.15 and 333.15 K
293.15K 313.15K 333.15
w1 w2 w3 w1 w2 w3 w1 w2 w3
0.2300 0.0000 0.7700 0.2896 0.0000 0.7104 0.2666 0.0000 0.7334
0.3064 0.0359 0.6576 0.5247 0.0639 0.4114 0.3893 0.0408 0.5699
0.3999 0.0530 0.5472 0.6077 0.0706 0.3217 0.4926 0.0550 0.4523
0.4668 0.0664 0.4668 0.6646 0.0753 0.2601 0.5753 0.0623 0.3624
0.5657 0.0752 0.3591 0.6997 0.0757 0.2246 0.6199 0.0710 0.3091
0.6369 0.0810 0.2821 0.7357 0.0763 0.1880 0.6677 0.0686 0.2636
0.6710 0.0821 0.2469 0.7570 0.0762 0.1668 0.8456 0.0000 0.1544
0.6921 0.0829 0.2250 0.7731 0.0757 0.1512 0.7594 0.0604 0.1802
0.9214 0.0000 0.0786 0.7898 0.0745 0.1357 0.7990 0.0330 0.1680
0.8308 0.0439 0.1252 0.8943 0.0000 0.1057 0.7323 0.0667 0.2010
0.6153 0.0877 0.2970 0.8942 0.0000 0.1058
0.8148 0.0530 0.1322 0.8800 0.0275 0.0924
0.7970 0.0643 0.1387 0.4261 0.0468 0.5271
0.7225 0.0804 0.1971 0.3423 0.0284 0.6292
0.8664 0.0207 0.1129 0.8561 0.0523 0.0916
Titration uncertainty to a drop mass of butanol: 0.0052 ± 0.0002g. Titration uncertainty to a drop mass of water: 0.0151 ± 0.00003g.
u(P)=0.1 kPa; u(T)=0.1 K; U(w)=0.001 (aqueous phase) and U(w)=0.003 (butanol phase)
Table 5: Binodal curve data: Mass fraction (w) of Cloud Points of water (1) + m-2HEAPr (2) +Pentanol (3) Systems at P = 101.2 kPa and 293.15, 313.15 and 333.15 K
293.15K 313.15K 333.15
w1 w2 w3 w1 w2 w3 w1 w2 w3
0.1254 0.0000 0.8746 0.1086 0.0000 0.8914 0.1476 0.0000 0.8524
0.1688 0.1034 0.7278 0.1526 0.0908 0.7566 0.1781 0.1051 0.7168
0.1849 0.1434 0.6717 0.2010 0.1402 0.6587 0.2163 0.1644 0.6194
0.2120 0.1724 0.6156 0.2384 0.1787 0.5829 0.2736 0.1979 0.5285
0.2308 0.2097 0.5595 0.2624 0.2255 0.5121 0.3098 0.2406 0.4496
0.2667 0.2392 0.4941 0.2805 0.2457 0.4738 0.3331 0.2509 0.4160
0.2813 0.2578 0.4610 0.2911 0.2574 0.4515 0.3484 0.2693 0.3822
0.2855 0.2762 0.4383 0.3118 0.2793 0.4089 0.3653 0.2807 0.3540
0.2994 0.2846 0.4160 0.3238 0.2922 0.3840 0.3808 0.2886 0.3306
0.3044 0.2968 0.3988 0.3421 0.3067 0.3512 0.3840 0.3100 0.3061
0.3127 0.3067 0.3807 0.3523 0.3177 0.3300 0.3966 0.3079 0.2955
0.3202 0.3185 0.3614 0.9638 0.0097 0.0264 0.4019 0.3250 0.2732
0.3342 0.3258 0.3400 0.8214 0.1408 0.0378 0.4141 0.3494 0.2366
0.3408 0.3338 0.3254 0.7460 0.2222 0.0319 0.4288 0.3721 0.1991
0.9061 0.0692 0.0248 0.7253 0.2421 0.0326 0.9599 0.0185 0.0216
0.8583 0.1182 0.0235 0.7203 0.2446 0.0352 0.9017 0.0703 0.0280
0.4198 0.5728 0.0074 0.9516 0.0196 0.0288 0.7726 0.1957 0.0317
0.7822 0.2008 0.0170 0.6880 0.2807 0.0312 0.6658 0.2978 0.0364
0.9568 0.0207 0.0226 0.6005 0.3649 0.0346 0.5986 0.3562 0.0452
0.9371 0.0408 0.0221 0.5284 0.4169 0.0547 0.5496 0.3871 0.0633
0.8982 0.0777 0.0242 0.4820 0.4232 0.0949 0.5214 0.3912 0.0874
0.6391 0.3335 0.0274 0.4267 0.4090 0.1642 0.5013 0.3908 0.1078
0.5170 0.4378 0.0451 0.3846 0.3825 0.2329 0.4880 0.3895 0.1225
0.4289 0.4618 0.1094 0.4831 0.3956 0.1213
0.4134 0.4528 0.1339
0.4021 0.4447 0.1532
0.3660 0.3914 0.2426
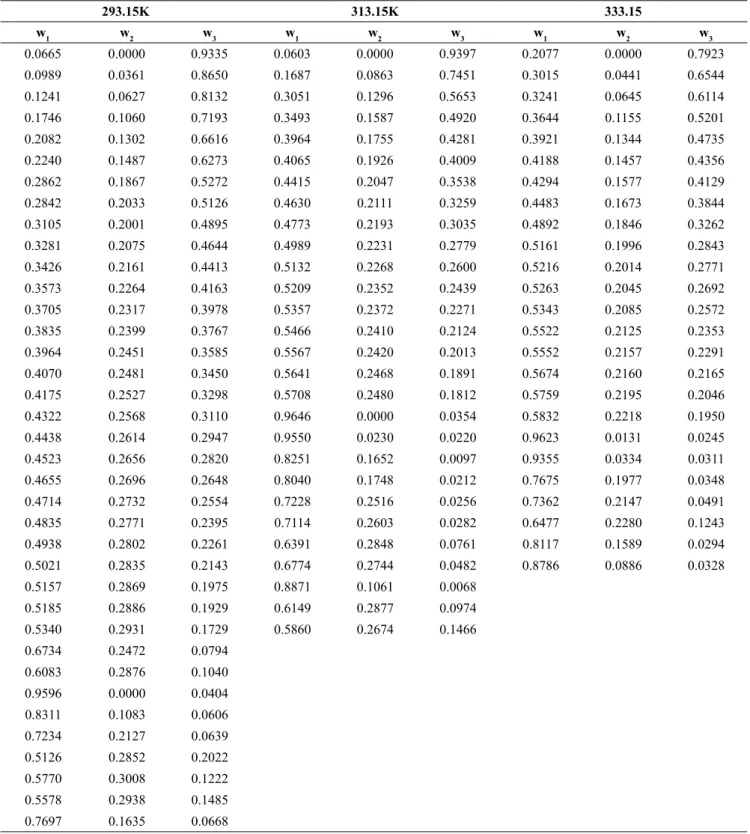
Table 6: Binodal curve data: Mass fraction (w) of Cloud Points of water (1) + m- 2HEAB (2) +Pentanol (3) Systems at P = 101.2 kPa and 293.15, 313.15 and 333.15 K
293.15K 313.15K 333.15
w1 w2 w3 w1 w2 w3 w1 w2 w3
0.0665 0.0000 0.9335 0.0603 0.0000 0.9397 0.2077 0.0000 0.7923
0.0989 0.0361 0.8650 0.1687 0.0863 0.7451 0.3015 0.0441 0.6544
0.1241 0.0627 0.8132 0.3051 0.1296 0.5653 0.3241 0.0645 0.6114
0.1746 0.1060 0.7193 0.3493 0.1587 0.4920 0.3644 0.1155 0.5201
0.2082 0.1302 0.6616 0.3964 0.1755 0.4281 0.3921 0.1344 0.4735
0.2240 0.1487 0.6273 0.4065 0.1926 0.4009 0.4188 0.1457 0.4356
0.2862 0.1867 0.5272 0.4415 0.2047 0.3538 0.4294 0.1577 0.4129
0.2842 0.2033 0.5126 0.4630 0.2111 0.3259 0.4483 0.1673 0.3844
0.3105 0.2001 0.4895 0.4773 0.2193 0.3035 0.4892 0.1846 0.3262
0.3281 0.2075 0.4644 0.4989 0.2231 0.2779 0.5161 0.1996 0.2843
0.3426 0.2161 0.4413 0.5132 0.2268 0.2600 0.5216 0.2014 0.2771
0.3573 0.2264 0.4163 0.5209 0.2352 0.2439 0.5263 0.2045 0.2692
0.3705 0.2317 0.3978 0.5357 0.2372 0.2271 0.5343 0.2085 0.2572
0.3835 0.2399 0.3767 0.5466 0.2410 0.2124 0.5522 0.2125 0.2353
0.3964 0.2451 0.3585 0.5567 0.2420 0.2013 0.5552 0.2157 0.2291
0.4070 0.2481 0.3450 0.5641 0.2468 0.1891 0.5674 0.2160 0.2165
0.4175 0.2527 0.3298 0.5708 0.2480 0.1812 0.5759 0.2195 0.2046
0.4322 0.2568 0.3110 0.9646 0.0000 0.0354 0.5832 0.2218 0.1950
0.4438 0.2614 0.2947 0.9550 0.0230 0.0220 0.9623 0.0131 0.0245
0.4523 0.2656 0.2820 0.8251 0.1652 0.0097 0.9355 0.0334 0.0311
0.4655 0.2696 0.2648 0.8040 0.1748 0.0212 0.7675 0.1977 0.0348
0.4714 0.2732 0.2554 0.7228 0.2516 0.0256 0.7362 0.2147 0.0491
0.4835 0.2771 0.2395 0.7114 0.2603 0.0282 0.6477 0.2280 0.1243
0.4938 0.2802 0.2261 0.6391 0.2848 0.0761 0.8117 0.1589 0.0294
0.5021 0.2835 0.2143 0.6774 0.2744 0.0482 0.8786 0.0886 0.0328
0.5157 0.2869 0.1975 0.8871 0.1061 0.0068
0.5185 0.2886 0.1929 0.6149 0.2877 0.0974
0.5340 0.2931 0.1729 0.5860 0.2674 0.1466
0.6734 0.2472 0.0794
0.6083 0.2876 0.1040
0.9596 0.0000 0.0404
0.8311 0.1083 0.0606
0.7234 0.2127 0.0639
0.5126 0.2852 0.2022
0.5770 0.3008 0.1222
0.5578 0.2938 0.1485
0.7697 0.1635 0.0668
Titration uncertainty to a drop mass of pentanol: 0.0063 ± 0.00004g. Titration uncertainty to a drop mass of water: 0.0151 ± 0.00003g.
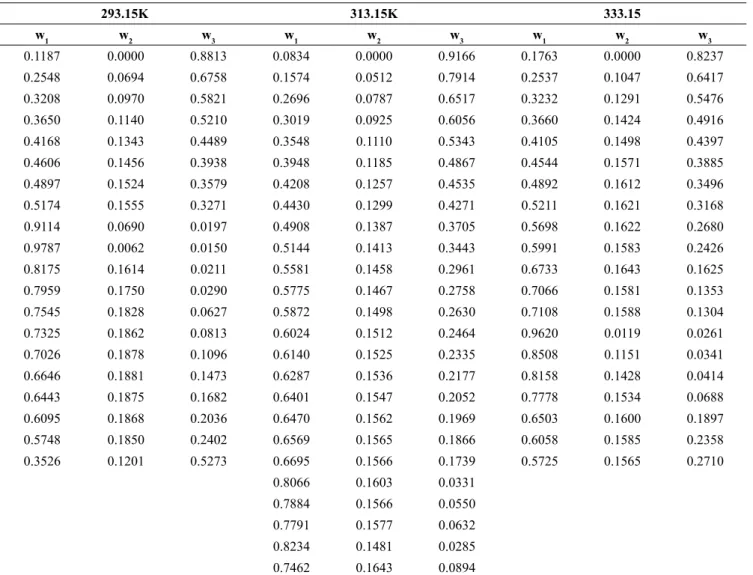
Table 7: Binodal curve data: Mass fraction (w) of Cloud Points of water (1) + m-2HEAP (2) + Pentanol (3) Systems at P = 101.2 kPa and 293.15, 313.15 and 333.15 K.
293.15K 313.15K 333.15
w1 w2 w3 w1 w2 w3 w1 w2 w3
0.1187 0.0000 0.8813 0.0834 0.0000 0.9166 0.1763 0.0000 0.8237
0.2548 0.0694 0.6758 0.1574 0.0512 0.7914 0.2537 0.1047 0.6417
0.3208 0.0970 0.5821 0.2696 0.0787 0.6517 0.3232 0.1291 0.5476
0.3650 0.1140 0.5210 0.3019 0.0925 0.6056 0.3660 0.1424 0.4916
0.4168 0.1343 0.4489 0.3548 0.1110 0.5343 0.4105 0.1498 0.4397
0.4606 0.1456 0.3938 0.3948 0.1185 0.4867 0.4544 0.1571 0.3885
0.4897 0.1524 0.3579 0.4208 0.1257 0.4535 0.4892 0.1612 0.3496
0.5174 0.1555 0.3271 0.4430 0.1299 0.4271 0.5211 0.1621 0.3168
0.9114 0.0690 0.0197 0.4908 0.1387 0.3705 0.5698 0.1622 0.2680
0.9787 0.0062 0.0150 0.5144 0.1413 0.3443 0.5991 0.1583 0.2426
0.8175 0.1614 0.0211 0.5581 0.1458 0.2961 0.6733 0.1643 0.1625
0.7959 0.1750 0.0290 0.5775 0.1467 0.2758 0.7066 0.1581 0.1353
0.7545 0.1828 0.0627 0.5872 0.1498 0.2630 0.7108 0.1588 0.1304
0.7325 0.1862 0.0813 0.6024 0.1512 0.2464 0.9620 0.0119 0.0261
0.7026 0.1878 0.1096 0.6140 0.1525 0.2335 0.8508 0.1151 0.0341
0.6646 0.1881 0.1473 0.6287 0.1536 0.2177 0.8158 0.1428 0.0414
0.6443 0.1875 0.1682 0.6401 0.1547 0.2052 0.7778 0.1534 0.0688
0.6095 0.1868 0.2036 0.6470 0.1562 0.1969 0.6503 0.1600 0.1897
0.5748 0.1850 0.2402 0.6569 0.1565 0.1866 0.6058 0.1585 0.2358
0.3526 0.1201 0.5273 0.6695 0.1566 0.1739 0.5725 0.1565 0.2710
0.8066 0.1603 0.0331
0.7884 0.1566 0.0550
0.7791 0.1577 0.0632
0.8234 0.1481 0.0285
0.7462 0.1643 0.0894
Titration uncertainty to a drop mass of pentanol: 0.0063 ± 0.00004g. Titration uncertainty to a drop mass of water: 0.0151 ± 0.00003g.
u(P)=0.1 kPa; u(T)=0.1 K; U(w)=0.004 (aqueous phase) and U(w)=0.01 (pentanol phase)
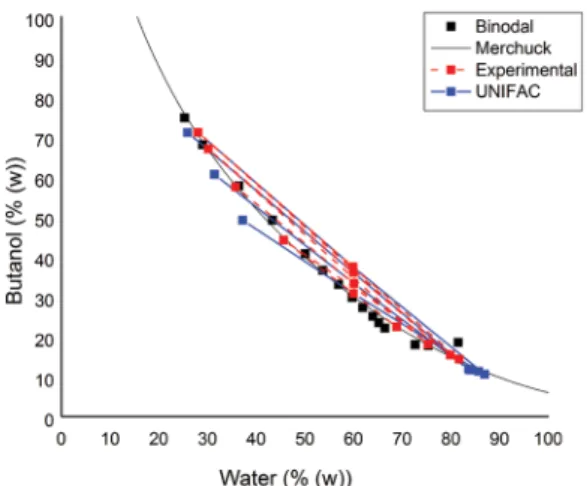
Figure 7: Tie-line data for water + m-2HEAB + butanol at 293.15K ,
UNIFAC model (continuous lines).
Figure 8: Tie-line data for water + m-2HEAB + butanol at 313.15K ,
Figure 9: Tie-line datas to water + m-2HEAB + butanol at 333.15K , UNIFAC model (continuous lines).
Figure 10: Tie-line data for water + m-2HEAB + pentanol at 293.15K ,
UNIFAC model (continuous lines).
Figure 11: Tie-line data for water + m-2HEAB + pentanol at 313.15K ,
UNIFAC model (continuous lines).
Figure 12. Tie-line data for water + m-2HEAB + pentanol at 333.15K , UNIFAC model (continuous lines).
The binodal curves were fitted according to Merchuk et al. (1998). After the identification of mis -cible and immis-cible regions, it is possible to deter-mine the LLE tie- lines with the measured weight of each phase in equilibrium Tables 8-9 show the mass
composition of each studied tie-line. Partition coeffi -cients of the ionic liquid in alcohol-water systems are gathered in Table 10.
The consistency of the measured tie-lines was checked using Hand (1930) and Othmer and Tobias (1942) correlations:
(3)
(4)
where , are the mole
fraction of the IL in the water-rich phase, water in the water-rich phase, IL in the alcohol-rich phase and al-cohol in the alal-cohol-rich phase, respectively, and kH ,
constH , kOT, and constOH are the constants obtained by
linear data fit. It is worth mentioning that water was
+ 1-pentanol at 333.15 passed the Hand test but failed the Othmer-Tobias test and water + m-2HEAP + 1-butanol, at 333.15 K failed both tests.
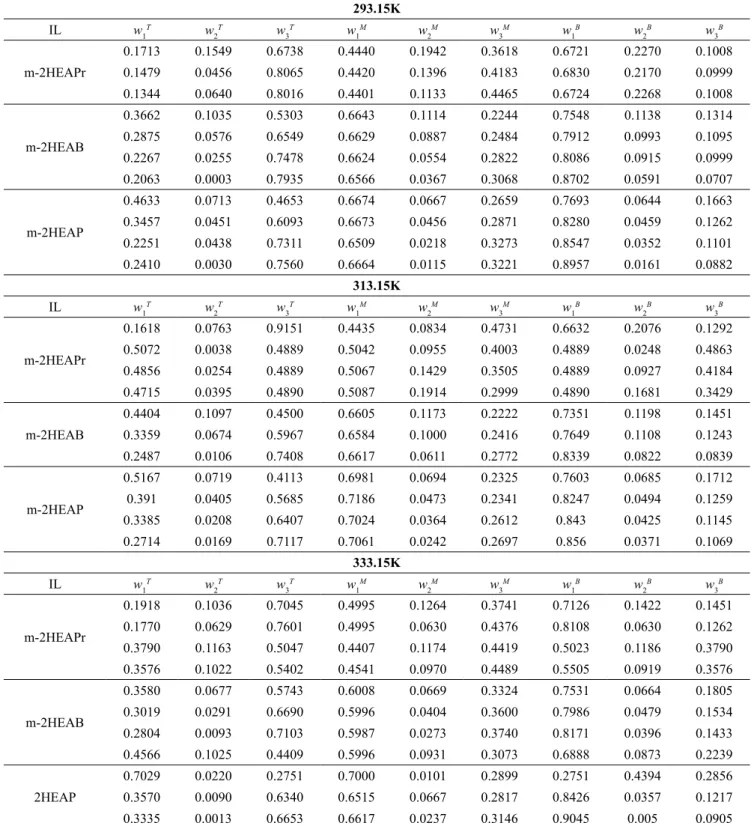
Table 8: Tie-Lines of water (1) + IL (2) + butanol (3), weight fractions in the Top (T) and Bottom (B) Phases and at the Initial Biphasic Composition of the Mixture (M) and 101.2 kPa
293.15K
IL w1T w
2 T w 3 T w 1 M w 2 M w 3 M w 1 B w 2 B w 3 B m-2HEAPr
0.1713 0.1549 0.6738 0.4440 0.1942 0.3618 0.6721 0.2270 0.1008
0.1479 0.0456 0.8065 0.4420 0.1396 0.4183 0.6830 0.2170 0.0999
0.1344 0.0640 0.8016 0.4401 0.1133 0.4465 0.6724 0.2268 0.1008
m-2HEAB
0.3662 0.1035 0.5303 0.6643 0.1114 0.2244 0.7548 0.1138 0.1314
0.2875 0.0576 0.6549 0.6629 0.0887 0.2484 0.7912 0.0993 0.1095
0.2267 0.0255 0.7478 0.6624 0.0554 0.2822 0.8086 0.0915 0.0999
0.2063 0.0003 0.7935 0.6566 0.0367 0.3068 0.8702 0.0591 0.0707
m-2HEAP
0.4633 0.0713 0.4653 0.6674 0.0667 0.2659 0.7693 0.0644 0.1663
0.3457 0.0451 0.6093 0.6673 0.0456 0.2871 0.8280 0.0459 0.1262
0.2251 0.0438 0.7311 0.6509 0.0218 0.3273 0.8547 0.0352 0.1101
0.2410 0.0030 0.7560 0.6664 0.0115 0.3221 0.8957 0.0161 0.0882
313.15K
IL w1T w
2 T w 3 T w 1 M w 2 M w 3 M w 1 B w 2 B w 3 B m-2HEAPr
0.1618 0.0763 0.9151 0.4435 0.0834 0.4731 0.6632 0.2076 0.1292
0.5072 0.0038 0.4889 0.5042 0.0955 0.4003 0.4889 0.0248 0.4863
0.4856 0.0254 0.4889 0.5067 0.1429 0.3505 0.4889 0.0927 0.4184
0.4715 0.0395 0.4890 0.5087 0.1914 0.2999 0.4890 0.1681 0.3429
m-2HEAB
0.4404 0.1097 0.4500 0.6605 0.1173 0.2222 0.7351 0.1198 0.1451
0.3359 0.0674 0.5967 0.6584 0.1000 0.2416 0.7649 0.1108 0.1243
0.2487 0.0106 0.7408 0.6617 0.0611 0.2772 0.8339 0.0822 0.0839
m-2HEAP
0.5167 0.0719 0.4113 0.6981 0.0694 0.2325 0.7603 0.0685 0.1712
0.391 0.0405 0.5685 0.7186 0.0473 0.2341 0.8247 0.0494 0.1259
0.3385 0.0208 0.6407 0.7024 0.0364 0.2612 0.843 0.0425 0.1145
0.2714 0.0169 0.7117 0.7061 0.0242 0.2697 0.856 0.0371 0.1069
333.15K
IL w1T w
2 T w 3 T w 1 M w 2 M w 3 M w 1 B w 2 B w 3 B m-2HEAPr
0.1918 0.1036 0.7045 0.4995 0.1264 0.3741 0.7126 0.1422 0.1451
0.1770 0.0629 0.7601 0.4995 0.0630 0.4376 0.8108 0.0630 0.1262
0.3790 0.1163 0.5047 0.4407 0.1174 0.4419 0.5023 0.1186 0.3790
0.3576 0.1022 0.5402 0.4541 0.0970 0.4489 0.5505 0.0919 0.3576
m-2HEAB
0.3580 0.0677 0.5743 0.6008 0.0669 0.3324 0.7531 0.0664 0.1805
0.3019 0.0291 0.6690 0.5996 0.0404 0.3600 0.7986 0.0479 0.1534
0.2804 0.0093 0.7103 0.5987 0.0273 0.3740 0.8171 0.0396 0.1433
0.4566 0.1025 0.4409 0.5996 0.0931 0.3073 0.6888 0.0873 0.2239
2HEAP
0.7029 0.0220 0.2751 0.7000 0.0101 0.2899 0.2751 0.4394 0.2856
0.3570 0.0090 0.6340 0.6515 0.0667 0.2817 0.8426 0.0357 0.1217
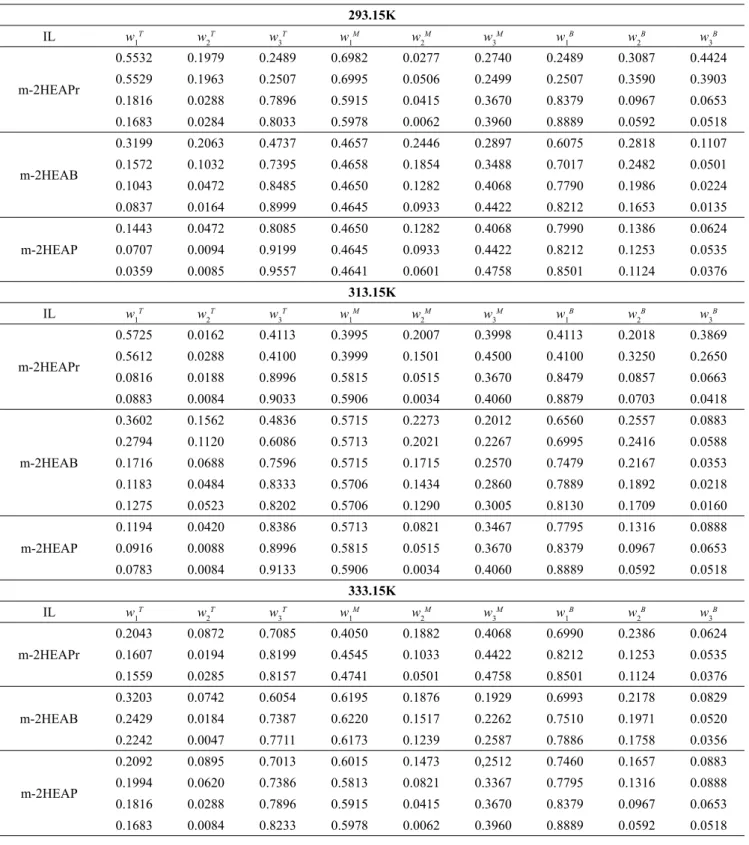
Table 9: Weight Fraction Compositions for TLs of water (1) + IL (2) + pentanol (3), in the Top (T) and Bottom (B) Phases and at the Initial Biphasic Composition of the Mixture (M) and 101.2 kPa
293.15K
IL w1T w
2 T w 3 T w 1 M w 2 M w 3 M w 1 B w 2 B w 3 B m-2HEAPr
0.5532 0.1979 0.2489 0.6982 0.0277 0.2740 0.2489 0.3087 0.4424
0.5529 0.1963 0.2507 0.6995 0.0506 0.2499 0.2507 0.3590 0.3903
0.1816 0.0288 0.7896 0.5915 0.0415 0.3670 0.8379 0.0967 0.0653
0.1683 0.0284 0.8033 0.5978 0.0062 0.3960 0.8889 0.0592 0.0518
m-2HEAB
0.3199 0.2063 0.4737 0.4657 0.2446 0.2897 0.6075 0.2818 0.1107
0.1572 0.1032 0.7395 0.4658 0.1854 0.3488 0.7017 0.2482 0.0501
0.1043 0.0472 0.8485 0.4650 0.1282 0.4068 0.7790 0.1986 0.0224
0.0837 0.0164 0.8999 0.4645 0.0933 0.4422 0.8212 0.1653 0.0135
m-2HEAP
0.1443 0.0472 0.8085 0.4650 0.1282 0.4068 0.7990 0.1386 0.0624
0.0707 0.0094 0.9199 0.4645 0.0933 0.4422 0.8212 0.1253 0.0535
0.0359 0.0085 0.9557 0.4641 0.0601 0.4758 0.8501 0.1124 0.0376
313.15K
IL w1T w
2 T w 3 T w 1 M w 2 M w 3 M w 1 B w 2 B w 3 B m-2HEAPr
0.5725 0.0162 0.4113 0.3995 0.2007 0.3998 0.4113 0.2018 0.3869
0.5612 0.0288 0.4100 0.3999 0.1501 0.4500 0.4100 0.3250 0.2650
0.0816 0.0188 0.8996 0.5815 0.0515 0.3670 0.8479 0.0857 0.0663
0.0883 0.0084 0.9033 0.5906 0.0034 0.4060 0.8879 0.0703 0.0418
m-2HEAB
0.3602 0.1562 0.4836 0.5715 0.2273 0.2012 0.6560 0.2557 0.0883
0.2794 0.1120 0.6086 0.5713 0.2021 0.2267 0.6995 0.2416 0.0588
0.1716 0.0688 0.7596 0.5715 0.1715 0.2570 0.7479 0.2167 0.0353
0.1183 0.0484 0.8333 0.5706 0.1434 0.2860 0.7889 0.1892 0.0218
0.1275 0.0523 0.8202 0.5706 0.1290 0.3005 0.8130 0.1709 0.0160
m-2HEAP
0.1194 0.0420 0.8386 0.5713 0.0821 0.3467 0.7795 0.1316 0.0888
0.0916 0.0088 0.8996 0.5815 0.0515 0.3670 0.8379 0.0967 0.0653
0.0783 0.0084 0.9133 0.5906 0.0034 0.4060 0.8889 0.0592 0.0518
333.15K
IL w1T w
2 T w 3 T w 1 M w 2 M w 3 M w 1 B w 2 B w 3 B m-2HEAPr
0.2043 0.0872 0.7085 0.4050 0.1882 0.4068 0.6990 0.2386 0.0624
0.1607 0.0194 0.8199 0.4545 0.1033 0.4422 0.8212 0.1253 0.0535
0.1559 0.0285 0.8157 0.4741 0.0501 0.4758 0.8501 0.1124 0.0376
m-2HEAB
0.3203 0.0742 0.6054 0.6195 0.1876 0.1929 0.6993 0.2178 0.0829
0.2429 0.0184 0.7387 0.6220 0.1517 0.2262 0.7510 0.1971 0.0520
0.2242 0.0047 0.7711 0.6173 0.1239 0.2587 0.7886 0.1758 0.0356
m-2HEAP
0.2092 0.0895 0.7013 0.6015 0.1473 0,2512 0.7460 0.1657 0.0883
0.1994 0.0620 0.7386 0.5813 0.0821 0.3367 0.7795 0.1316 0.0888
0.1816 0.0288 0.7896 0.5915 0.0415 0.3670 0.8379 0.0967 0.0653
Table 10: Hand Coefficients kH and constH and Othmer-Tobias Coefficientes kOT and constOT of water + IL +
butanol, and respective Correlation Coefficient (R2)
293.15 K
Systems Hand Test Othmer-Tobias Test
kH constH R2 k
OT constOT R
2
Water + m-2HEAPr + 1-Butanol 0.1137 -1.2560 0.9408 0.8724 -1.0998 0.9924
Water + m-2HEAB + 1-Butanol 0.1180 -1.6776 0.9857 0.6532 -1.5134 0.8090
Water + m-2HEAP + 1-Butanol 0.3970 -1.6562 0.9519 0.5992 -1.5891 0.8588
313.15 K
Water + m-2HEAPr + 1-Butanol 0.7841 -0.3368 0.9863 0.5901 -1.002 0.9905
Water + m-2HEAB + 1-Butanol 0.1792 -1.5701 0.9986 0.5693 -1.5113 0.9317
Water + m-2HEAP + 1-Butanol 0.3504 -1.6529 0.9786 0.5194 -1.5819 0.9717
333.15 K
Water + m-2HEAPr + 1-Butanol 1.0180 -0.5597 0,9319 1.0991 -1.2742 0.9910
Water + m-2HEAB + 1-Butanol 0.3302 -1.5693 0.9490 0.6706 -1.4568 0.9977
Water + m-2HEAP + 1-Butanol 1.5018 1.2683 0.9586 1.6525 -2.0691 0.9923
Table 11: Hand Coefficients kH and constH and Othmer-Tobias Coefficientes kOT and constOT of water + IL +
pentanol, and respective Correlation Coefficient (R2)
293.15 K
Systems Hand Test Othmer-Tobias Test
kH constH R2 k
OT constOT R
2
Water + m-2HEAPr + 1-Pentanol 0.8809 -0.5011 0.9804 1.2979 -1.6252 0.9956
Water + m-2HEAB + 1-Pentanol 0.2704 -1.1190 0.9911 0.5972 -1.3559 0.9681
Water + m-2HEAP + 1-Pentanol 0.1146 -1.5754 0.7818 0.2536 -1.4538 0.9624
313.15 K
Water + m-2HEAPr + 1-Pentanol 1.2432 0.6881 0.8973 0.8715 -1.3469 0.9820
Water + m-2HEAB + 1-Pentanol 0.3275 -1.1029 0.9002 0.5260 -1.4513 0.9455
Water + m-2HEAP + 1-Pentanol 0.4937 -1.0624 0.5808 -1.5397 -1.1233 0.9684
333.15 K
Water + m-2HEAPr + 1-Pentanol 0.5539 -0.7752 0.8711 1.7485 -1.5239 0.9460
Water + m-2HEAB + 1-Pentanol 0.1112 -1.3319 0.9996 0.8116 -1.5695 0.9352
Water + m-2HEAP + 1-Pentanol 0.4663 -1.1068 0.9949 2.2115 -1.7117 0.9783
Parameters for the UNIFAC model are listed in Tables 12 to 14. UNIFAC tie-lines for m-2HEAB in water-butanol and water-pentanol systems are shown
in Figures 7-12. First, fits were made for each alcohol separately as an initial estimate for overall data fitting.
This leads to unreal ionic liquid interaction parameters
with other groups because different sets are obtained
for the same ionic liquid, but is an interesting approach
to obtain a initial estimate for generating the final para -meters. However, a poor description was obtained for pentanol-water systems, as can be observed in Figures
10-12, and it was useless to try to fit a unique set of
parameters because the result would be even worse. A better way of modelling these systems in a group con-tribution manner is a challenge for future works. Thus,
liquid–liquid equilibria of the ionic liquid are well des-cribed by UNIFAC for water-butanol, but modelling for the water-pentanol system was not satisfactory.
Table 12: Volume (R) and area (Q) parameters for the UNIFAC model
Group R Q
CH2 * 0.6744 0.5400
CH3 * 0.9011 0.8480
H2O * 0.9200 1.4000
OH * 1.0000 1.2000
m2HEAPr 7.00 5.54
m2HEAB 7.65 5.51
m2HEAP 8.83 6.19
Table 13: UNIFAC Interaction parameters fitted for
the systems with butanol
CHn (i)-m2HEAPr(j)
H2O(i)- m2HEAPr(j)
OH(i)- m2HEAPr(j)
aij 13.35 29.694 433.75
aji 2750.5 -114.93 -60.479
CHn (i)-m2HEAP(j)
H2O(i)- m2HEAP(j)
OH(i)- m2HEAP(j)
aij 2766.6 920.22 377.75
aji 107.99 -343.52 684.64
CHn (i)-m2HEAB(j)
H2O(i)- m2HEAB(j)
OH(i)- m2HEAB(j)
aij 367.52 357.86 1142.90
aji 110.37 -192.07 1740.60
Table 14: UNIFAC Interaction parameters fitted for
the systems with pentanol
CHn (i)-m2HEAPr(j)
H2O(i)- m2HEAPr(j)
OH(i)- m2HEAPr(j)
aij 3000.0 329.22 796.27
aji -224.48 -182.39 2994.7
CHn (i)-m2HEAP(j)
H2O(i)- m2HEAP(j)
OH(i)- m2HEAP(j)
aij 2745.5 -648.14 513.12
aji 84.858 -205.11 -69.247
CHn (i)-m2HEAB(j)
H2O(i)- m2HEAB(j)
OH(i)- m2HEAB(j)
aij 205.27 -345.74 2554.4
aji 81.573 776.74 375.12
CONCLUSIONS
Liquid-liquid data for water + ionic liquid + alcohol were studied at P = 101.2 kPa and 293.15, 313.15 and 333.15 K. The alcohols used were butanol and pen-tanol and the ionic liquids are three protic N-methyl-2-hydroxyethylammonium alkylates (propionate, butanoate and pentanoate). It was found that, in all conditions evaluated, the IL showed a high miscibility
in both solvents, and induced a salting in effect in the
systems. Increasing the temperature, the miscibility gap is enhanced. The surfactant characteristics of the ionic liquid increase as the anion chain is increased and the mutual solubility of water-alcohol are augmented. Data were considered to be consistent. UNIFAC was used to correlate liquid-liquid equilibrium behavior for
water-alcohol systems. However, using fitting parame
-ters for each alcohol separately led to unreal and diffe -rent parameters for the same ionic liquid. The systems with water-pentanol were not satisfactorily described
by the UNIFAC method. A better way of modelling these data is a challenge for future work. The results
confirm the high hydrophilicity of these ionic liquids,
as their butanol-water and pentanol-water partition
co-efficients are normally lower than 1.
ACKNOWLEGMENTS
The authors are grateful to CAPES/Brazil for M.Sc. grants for F. Ganem and K. Amorim. Financial support from CNPq/Brazil is also acknowleged (Grant 306560/2013-5, project 475883/2012-8 and E. Souza MSc. Grant). The authors are also grateful to FAPESB/ SECTI for A. Soares’ undergraduate grant.
REFERENCES
Alvarez, V.H., Mattedi, S., Aznar, M., Density, Refraction Index and Vapor-Liquid Equilibria of N-Methyl-2-Hydroxyethylammonium Butyrate plus (Methyl Acetate or Ethyl Acetate or Propyl Acetate) at Several Temperatures. J. of Chem. Thermodyn., 62, 130-141 (2013).
Alvarez V.H., Dosil N., Gonzalez-Cabaleiro R., Mattedi S., Martin-Pastor M., Iglesias M., Navaza J.M., Brønsted Ionic Liquids for Sustainable Processes: Synthesis and Physical Properties. J. Chem. Eng. Data, 55, 625-632 (2010).
Carvalho, P.J., Coutinho, J.A.P., The polarity effect
upon the methane solubility in ionic liquids: a contribution for the design of ionic liquids for enhanced CO2/CH4 and H2S/CH4 selectivities, Energy Environ. Sci., 4, 4614 (2011).
Greaves, T.L.; Drummond, C.J., Solvent nanostructure,
the solvophobic effect and amphiphile
self-assembly in ionic liquids. Chem. Soc. Rev., 42, 1096-1120, 2013.
Hand, D. B., Dineric distribution, J. Phys. Chem. 34, 1961-2000 (1930).
Latala, A., Stepnowski P, Nedzi M., Mrozik W., Marine Toxicity Assessment of Imidazolium Ionic
Liquids: Acute Effects on the Baltic Algae Oocystis
submarina and Cyclotella meneghiniana. Aquatic Toxicolog., 73(1) 91-98 (2005).
Li, Y., Figueiredo, E.J.P., Santos, M., Santos, J., Talavera-Prieto, N.M.C., Carvalho, P.J., Ferreira, A.G.M., Mattedi, S., Volumetric and acoustical properties of aqueous mixtures of hydroxyethylammonium butyrate and N-methyl-2-hydroxyethylammonium pentanoate at T=(298.15 to 333.15)K., J. of Chem. Thermodyn., 97, 191-205 (2016).
Kennedy, D.F., Drummond C.J., Large Aggregated Ions Found in Some Protic Ionic Liquids. J. Phys. Chem., B, 113(17), 5690–5693 (2009).
Magnussen, T.; Rasmussen, P.; Fredenslund, A., UNIFAC Parameter Table for Prediction of Liquid-Liquid Equilibria. Ind. Eng. Chem. Process Des. Dev., 20(2), (331–339 (1981).
Merchuk J.C., Andrews B. A., Asenjo J.A., Aqueous two-phase systems for protein separation. Studies on phase inversion, J Chromatogr. B Biomed. Sci. Appl. 711, 285–293 (1998).
Nann, A.; Held, C.; Sadowski, G., Liquid−Liquid
Equilibria of 1-Butanol/Water/IL Systems. Ind.
Eng. Chem. Res., 52, 18472−18481 (2013).
Nemati-Kande, E., Shekaari, H., Zafarini-Moattar, M.T., Binodal Curves and Tie-Lines of Aliphatic Alcohols plus Diammonium Hydrogen Citrate plus Water Ternary Systems: Measurement and
Modeling, J. Chem. Eng., Data 57, 1678−1688
(2012).
Oliveira, L. H. de; Álvarez, V. H., Aznar, M., Liquid Liquid Equilibrium in N-Methyl-2-hydroxyethylammonium Acetate, Butanoate, or Hexanoate Ionic Liquids + Dibenzothiophene + n-Dodecane Systems at 298.2 K and Atmospheric Pressure. J. of Chem. & Eng. Data, 57, 744-750 (2012).
Oliveira, M.V.S., Vidal, B.T., Melo, C.M., Miranda, R.C.M., Soares, C.M.F.; Coutinho, J.A.P., Ventura, S.P.M., Mattedi, S., Lima, A.S., (Eco)toxicity and biodegradability of protic ionic liquids. Chemosphere (Oxford), 147, 460-466 (2016).
Oliveira, M.V., Ros, P.C.M., Castro, H.F., Mattedi,
S., Soares, C.M.F. , Lima, A.S., Transesterification
of babassu oil catalyzed by Burkholderia cepacia
encapsulated in sol-gel matrix employing protic ionic liquid as an additive. Acta Scientiarum. Technology, 36, 445-451 (2014).
Othmer, D.F., Tobias, P. E., Tie-line Correlation. Industrial and Engineering Chemistry, 34, 693-696 (1942).
Peric, B., Sierra, J., Martí, E., Cruañas, R., Garau, M. A., A comparative study of the terrestrial ecotoxicity of selected protic and aprotic ionic liquids, Chemosphere, 108, 418–425 (2014).
Santos, G.R., UNIFAC-CAMPINAS: Um novo modelo UNIFAC para a predição do equilíbrio líquido-líquido. DSc. Thesis. Chemical Engineering Faculty - UNICAMP. 2005. Campinas, São Paulo. Santos, D., Costa, F., Franceschi, E., Santos, A.,
Dariva, C., Mattedi, S., Synthesis and physico-chemical properties of two protic ionic liquids based on stearate anion. Fluid Phase Equilibria, 376, 132–140 (2014).
Souza, R.L., Faria, E.L.P., Figueiredo, R.T., Freitas, L.S., Iglesias, M., Mattedi, S., Zanin, G.M., Santos, O.A.A., Coutinho, J.A.P. ; Lima, A.S., Soares, C.M.F., Protic ionic liquid as additive on lipase immobilization using silica sol gel. Enzyme and Microbial Technology , 52, 141-150 (2013).
Stragevitch, L., d’Ávila, S.G., Application of a generalized maximum likelihood method in the reduction of multicomponent liquid-liquid equilibrium data. Braz. J. Chem. Eng., 14, 41-52 (1997)