acute phase of myocardial infarction: the
tenuous balance between effectiveness and
safety – a systematic review and meta-analysis of
randomized clinical trials
Paulo H. Negreiros1* Adriana Bau1* Wilson Nadruz1 Otavio R. Coelho-Filho1 José Roberto Matos-Souza1 Otavio R. Coelho1 Andrei C. Sposito1 Luiz Sergio F. Carvalho1
*The co-authors had an equal contribution for this present article. 1. Cardiology Department, Faculty of Medical Sciences, State University of Campinas (Unicamp), Campinas, SP, Brasil
http://dx.doi.org/10.1590/1806-9282.65.1.24
SUMMARY
INTRODUCTION: In acute myocardial infarction (AMI), each 18 mg/dl (1 mmol/L) increment is associated with a 3% increase in mortal-ity rates. All strategies applied for reducing blood glucose to this date, however, have not presented encouraging results.
METHODOLOGY: We searched the Medline (PubMed) and Cochrane Library databases for randomized clinical trials (RCTs) from 1995 to 2017 that used the intensive strategy or GIK therapy for blood glucose control during the acute stage of the AMI. We included eight studies. In order to identify the effects of GIK or insulin therapy, we calculated a overall risk ratio (RR) with meta-analysis of fixed and random effects models. A two-tail p-value of < 0.05 was considered statistically significant.
RESULTS: A total of 28,151 patients were included: 1,379 intensively treated with insulin, 13,031 in GIK group, and 13,741 in the control group. The total mortality was 10.5% (n=2,961) and the RR of 1.03 [95%CI 0.96–1.10]; I2 = 31%; p = 0.41 for the combined intensive insulin plus GIK groups in comparison with the control group. In meta-regression analyses, intense reductions in blood glucose (> 36 mg/dL) in relation to the estimated average blood glucose (estimated by HbA1c) were associated with higher mortality, whereas lower reductions in blood glucose (< 36 mg/dL) were not associated with mortality. The lowering of blood glucose in the acute phase of MI compared with the average blood glucose was more effective around 18 mg/dL.
CONCLUSION: This meta-analysis suggests that there may be a tenuous line between the effectiveness and safety of reducing blood glucose in the acute phase of MI. The targets must not exceed a reduction greater than 36 mg/dL in relation to estimated average blood glucose.
KEYWORDS: Hyperglycemia. Myocardial infarction. Meta-analysis as the subject. Effectiveness. Safety. Critical care.
DATE OF SUBMISSION: 12-Oct-2018
DATE OF ACCEPTANCE: 26-Oct-2018
CORRESPONDING AUTHOR:Luiz Sérgio F de Carvalho
Cardiology Department – Faculty of Medical Sciences – State University of Campinas (Unicamp) 13084-971, Campinas, São Paulo, Brasil
INTRODUCTION
Stress hyperglycemia is a powerful prognostic
marker for acute myocardial infarction (AMI)1,2. It
represents not only a consequence of inflammatory activation, adrenergic and endocrine but also con-tributes to the continuation of these phenomena. In AMI patients, each 18 mg/dl (1 mmol/L) increment is associated with a 3% increase in mortality due to all
causes1. In a different study, each increment of
capil-lary blood glucose over 140 mg/dl was translated as a directly proportional increase in the mortality of
these patients over five years2.
Overall, however, all strategies applied for re-ducing blood glucose to this date have not present-ed encouraging results. As the first strategy for the
intensive control of blood glucose, the Digami-13
pre-sented an aggressive reduction in the blood glucose of diabetic patients with AMI was associated with a decrease in mortality. However, these findings could not be reproduced by subsequent studies – both
Di-gami-24 and HI-55 failed to demonstrate the benefits
of using the intensive treatment for blood glucose during an acute coronary event. Randomized studies with the same purpose of comparing a more rigor-ous treatment for stress hyperglycemia with more conservative methods, in the context of other critical conditions, also failed, like the multicenter
Nice-Sug-ar6. This study suggested a 14% increase in patient
mortality with the intensive control of hyperglyce-mia, overall, due to an increase in the risk of hypo-glycemia.
The concept of metabolic modulation in the acute stage of AMI with the purpose of promoting electrical stability in the myocardium after an ischemic event started in 1960 with the glucose-insulin-potassium
therapy (GIK)7. However, there is an extremely
tenu-ous balance between the plasma glucose and insulin resistance in the ischemic myocardium, in which, on the one hand, there is a necessity for high blood glucose levels in order to defeat the cellular mecha-nisms for insulin resistance and, on the other hand, a relative insulin deficiency in the acute stage. The mere provision of glucose and insulin could facilitate the glucose uptake by the myocardium, provided that in balance with the glucose consumption rate. If that balance is broken, the deleterious effect of hypogly-cemia or hyperglyhypogly-cemia will prevail.
In studies such as Digami I and II, Gips I8 and II9,
Create-Ecla10, and other trials, the diametrically
op-posite impacts on cardiovascular mortality due to all
causes were not revealed. Although the proportion of hypoglycemia partially explains these findings, there is no clear explanation for such divergent re-sults. In order to answer that question, we propose a meta-analysis followed by meta-regression using data published from trials on the intensive control of blood glucose in the acute stage of AMI.
METHODS
A detailed description of all the procedures is included in the Supplementary Data (from the Data Source and Research section to the Studies Included and Excluded). In short, the Medline (PubMed), Co-chrane Library and ClinicalTrials.gov databases were searched for original articles from 1995 to 2017 in or-der to identify all randomized clinical trials (RCTs) that used an intensive strategy or GIK therapy for the control of blood glucose levels during the acute stage of AMI. Original essays were considered eligible for the present meta-analysis if they met the following criteria: 1) Phase 2 or 3 RCT; 2) participants of the AMI acute event; 3) the participants of the treatment group used insulin or GIK therapy during the study. We excluded the studies that, despite being related to this subject, did not present mortality data or a comparison between a more intensive strategy for the control of stress hyperglycemia with more con-servative strategies, or that presented biases in the randomization or data analysis. Two researchers an-alyzed the data using pre-set forms and independent-ly assessed the precision of the anaindependent-lysis, resolving any discrepancies through a consensus after a dis-cussion with the third researcher. The baseline data were obtained through weighted calculation. In order to identify the potential effects of GIK or insulin ther-apy in the AMI, we calculated an overall risk ratio (RR) with meta-analysis of fixed and random effects models. Odds Ratios and risk ratios were universal-ly identical during the data anauniversal-lysis. More details on the data analysis can be found in Annex 1 (Data Anal-ysis and Synthesis). For the estimate of the effects of the resumed treatment, a two-tail p-value of < 0.05 was considered statistically significant. We used Sta-ta 13 to analyze the daSta-ta.
RESULTS
infarction, out of which nine were included in our study (Table 1). All other studies were not included in our meta-analysis because they did not present assessments of the polarity of more intensive or con-servative approaches.
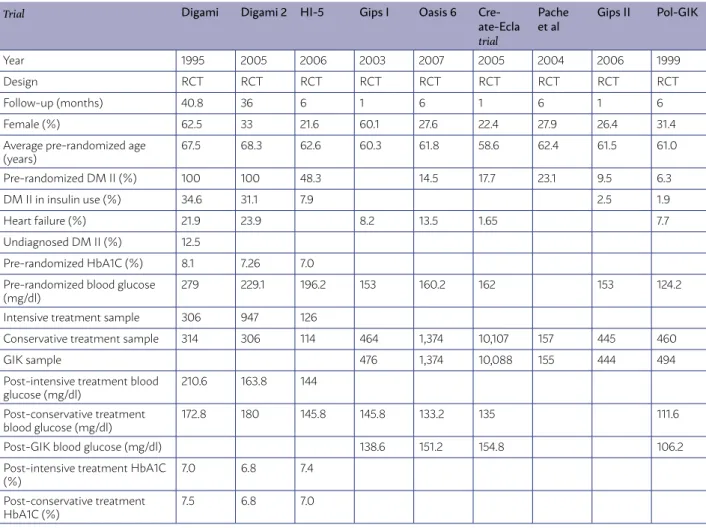
With that in mind, the studies analyzed were con-ducted between the years of 1995 and 2007 and all were clinical trials with a multicenter and random-ized design. The average of follow-up for all the stud-ies was of 11.5 months; Digami-1 was the one with the longest patient follow-up time (40.8 months), while all the others (except for Digami-2, which lowed-up with the patients for 36 months) had a fol-low-up time between one and six months. In total, there were 28,151 patients included; of these, 1,379 were included in the group for intensive capillary blood glucose treatment, while 13,031 were in the group for GIK treatment, and 13,741 in the control group (734 in the studies that were compared with the intensive strategy, and 13,007 in the studies that assessed the use of GIK). In total, about 34.7% of pa-tients were female, with an average age of 62.6 years.
After dividing the sample between the studies that sought blood glucose levels with an emphasis on a more intensive regimen of insulin in the acute stage of infarction, we had 2,113 patients in the intensive treatment group, and 734 in the control group, with 39% of patients being female, with an average age of 66.1 years. In this subgroup, the average pre-ran-domized blood glucose of patients was of 234.72 mg/ dl, with a 7.45% mean value for glycated hemoglobin (HbA1C) for these patients. After separating the pa-tients into the intensive and conservative treatment groups, for the first group, the average blood glucose value was of 148.68 mg/dl, while on the latter it was of 159.48 mg/dl, with post-follow-up HbA1C values of 7.06% and 7.1 %, respectively.
As for the studies that assessed the use of the glu-cose-insulin-potassium therapy solution, there was a total of 26,038 patients, with 13,031 in the GIK group and 13,007 in the conservative treatment group. There was an average of 32.6% female patients, with an av-erage age of 60.9 years. The avav-erage pre-randomized blood glucose was of 150.48 mg/dl between the
sub-TABLE 1 – DESCRIPTIVE ANALYSIS OF THE STUDIES ANALYZED
Trial Digami Digami 2 HI-5 Gips I Oasis 6
Cre-ate-Ecla
trial
Pache et al
Gips II Pol-GIK
Year 1995 2005 2006 2003 2007 2005 2004 2006 1999
Design RCT RCT RCT RCT RCT RCT RCT RCT RCT
Follow-up (months) 40.8 36 6 1 6 1 6 1 6
Female (%) 62.5 33 21.6 60.1 27.6 22.4 27.9 26.4 31.4
Average pre-randomized age (years)
67.5 68.3 62.6 60.3 61.8 58.6 62.4 61.5 61.0
Pre-randomized DM II (%) 100 100 48.3 14.5 17.7 23.1 9.5 6.3
DM II in insulin use (%) 34.6 31.1 7.9 2.5 1.9
Heart failure (%) 21.9 23.9 8.2 13.5 1.65 7.7
Undiagnosed DM II (%) 12.5
Pre-randomized HbA1C (%) 8.1 7.26 7.0
Pre-randomized blood glucose (mg/dl)
279 229.1 196.2 153 160.2 162 153 124.2
Intensive treatment sample 306 947 126
Conservative treatment sample 314 306 114 464 1,374 10,107 157 445 460
GIK sample 476 1,374 10,088 155 444 494
Post-intensive treatment blood glucose (mg/dl)
210.6 163.8 144
Post-conservative treatment blood glucose (mg/dl)
172.8 180 145.8 145.8 133.2 135 111.6
Post-GIK blood glucose (mg/dl) 138.6 151.2 154.8 106.2
Post-intensive treatment HbA1C (%)
7.0 6.8 7.4
Post-conservative treatment HbA1C (%)
7.5 6.8 7.0
groups, with 131.4 mg/dl for patients of the conserva-tive treatment and 137.7 mg/dl in the GIK group.
The mortality rates for all causes are described in Figure 1. The grouped data show that the total mortal-ity of the studies included was of 2,961 (10.5%). When once again divided into subgroups, there were 330 in the group for intensive control of capillary blood glucose, against 204 in the group for the conservative treatment (15.6% against 9.6%, respectively). Among the patients assessed for the GIK treatment, the total mortality was of 1,186 individuals (4.7%) for patients who used this strategy, against 1,186 patients of the conservative treatment (4.5%). Thus, the risk ratio for mortality due to all causes was of 1.03 [95% CI 0.96–
1.10]; I2 = 31%; p = 0.41). As shown in Supplementary
Figure 1, there was no significant publication bias in the funnel charts and no significant bias concerning small studies, according to the Egger tests (p = 0.57).
Finally, with the purpose of finding possible ex-planations for the discrepant findings between the trials, we conducted a series of meta-regressions (Supplementary Figures 2 and 3). As shown in figure 2, we can see that abrupt and intense reductions in blood glucose in relation to the average estimated blood glucose (> 2 mmol/L or > 35 mg/dL) were
asso-ciated with a higher risk of death, while reductions with low intensity (around zero) were not significant-ly associated with an increment or reduction in mor-tality due to all causes. Contrastingly, the lowering of blood glucose in the acute stage compared with the average blood glucose was more effective around 1 mmol/L 18 mg/dL (p = 0.008 for the tendency in the
restricted cubic spline).
DISCUSSION
The present systematic review assessed the im-pact of the intensive control of blood glucose levels in the acute stage of AMI, following different strat-egies, over the mortality due to all causes. A raw analysis of the impact of intensive control suggests there is no difference in comparison with the usu-al control. However, we have shown there is a fine limit between the magnitude of the fasting glucose reduction in relation with the average blood glucose levels before the AMI (based on the glycated hemo-globin) and the results of the intensive blood glucose control approach. In this context, intense and abrupt reductions of blood glucose (> 2 mmol/L or > 35 mg/ dL) seem to lead to a higher risk of death, while
ductions with low intensity (around zero) seem not to influence death risk. On the other hand, a reduc-tion of around 1 mmol/L (or 18 mg/dL) of the blood glucose during the acute stage compared with the estimated average seems to be the most secure and effective strategy to reduce the risk of death due to all causes in the context of AMI.
Stress hyperglycemia is common in the context
of critically ill patients6 and is not different from the
acute stage of the acute myocardial infarction1,2,11,12.
It is a powerful risk marker since it reflects the sys-temic and sympathetic activity and plasma levels of catecholamines, cortisol, and glucagon after the
isch-emic event13. When it is present at the AMI patient’s
admission into hospital, it is related with higher mor-tality rates, worse outcomes in primary angioplasty and an increase in the number of Timi 0 flows in coronary angiographies, as well as a more significant development of heart failure and cardiogenic shock. The pathophysiology is still little known; however, it is known that the hyperglycemia is associated with
endothelial dysfunction in the context of acute AMI15.
The cells of the vascular endothelium play an es-sential part in cardiovascular homeostasis, secret-ing a series of mediators that regulate the platelet
aggregation, coagulation, and vascular tonus16. The
term “endothelial dysfunction” refers to a condition in which the endothelium loses its physiological properties, with a tendency of promoting arteriolar vasodilation, fibrinolysis, and anti-aggregation. The mediators secreted by these cells can perform both vasoconstriction, through endothelin-1 and throm-boxane A2, and vasodilation through nitric oxide and prostacyclin. In patients with hyperglycemia and dia-betes, there is a deficiency in the production of nitric oxide, which causes a vascular imbalance towards
vasoconstriction16.
It is also known that., in physiological conditions, the myocardium metabolizes, preferably, free fatty acids; however, in ischemic conditions, it uses glu-cose in a relatively higher proportion. Nevertheless, the insulin resistance developed during the AMI acute stage generates an immediate limiting factor to the absorption of the energy substrate, which can contribute to the worsening of the myocardium in-jury. Thus, both endothelial dysfunction caused by hyperglycemia and insulin resistance can explain the adverse outcomes of exacerbated hyperglycemia in
the second acute stage of AMI1,11.
After these conclusions, the question was what
FIGURE 2
Incr
ement in mortalit
y due t
o all causes – I
nt
ensiv
e c
ontr
ol
would be the ideal blood glucose target after the AMI, since, for the reasons previously mentioned, even pa-tients who did not have diabetes were hyperglycemic upon the admission of the ischemic event. Thus, was
born the 1995 Digami3 study, which set out to study
620 patients grouped into a more permissive hyper-glycemic approach and a more intensive approach for the control of blood glucose levels through the use of a glucose-insulin solution. They were, initial-ly, encouraging of an intensive strategy, since after a 40.8 months follow-up there was a reduction of 11% of mortality in the intensive group, which was more evident in the low-risk groups who were not previ-ously treated with insulin therapy.
The following studies then – Digami-24 e HI-55
– tried to reproduce a similar design to the Digami but were not very successful. In the first one, there was no difference in mortality between the groups, possibly due to the excellent blood glucose levels on both. In the HI-5, the absence of significant differ-ences in mortality could be explained by the reduced number of patients in a study that, perhaps, was not adequately blinded.
When we analyze the results of these three stud-ies (Digami, Digami-2 e HI-5), we can see that the post-intensive treatment blood glucose level was of 172.8 mg/dl, 163.8 mg/dl, and 144 mg/dl, respective-ly, while in the groups randomized for the conser-vative treatment it was 210.6 mg/dl, 180 mg/dl, and 145.8 mg/dl; the average for HbA1c was 8.1%, 7.23%, and 7%, also respectively. The Digami data show that this study had the highest values for blood glucose in both groups in comparison with the other two stud-ies, while the HI-5 was the one with the lowest val-ues. This analysis suggests that higher blood glucose values might be related to better outcomes when compared with lower values in more intensive ap-proaches. Accordingly, the meta-regression results suggested there is a tenuous line between effective-ness and safety for the reduction of blood glucose in the acute stage.
The studies on GIK therapy were motivated by the theoretical benefits of the solution in increasing the availability of glucose and potassium to the myo-cardium associated with the insulin effect that facili-tates the glucose oxidation, reduces circulating fatty acids, thus improving the parameters for coagulation and the anti-inflammatory effects, and reducing ar-rhythmias and changes in contractility. The studies included in this meta-analysis assessed 13,031
pa-tients who underwent GIK therapy and 13,007 who
underwent the conventional treatment; Create-Ecla10
had the largest sample, with 20,201 patients.
The Gips-I8 study compared the GIK therapy
in-fusion or placebo in 940 AMI patients eligible for primary angioplasty in 8-12 hours, showing clinical benefits for the patients, with no signs of heart
fail-ure; however, the following study, Gips-II9, could not
confirm this finding.
Similarly, in the most recent Create-Ecla, a study that assessed the effects of a high dose of GIK did not present a significant difference in mortality. The
Oasis-617 study was prematurely interrupted after
2,748 patients were enrolled after the publication of the Create-Ecla; the Oasis-6 showed no benefits to the GIK treatment.
Despite that, a recent analysis of the Oasis-6 and Create-Ecla studies combined the populations of both, showing an increase in mortality for the treat-ment with GIK, especially over the first three days.
In a meta-analysis published in 1997 by
Fath-Or-doubadi & Beatt18 and reviewed by Mamas et al.19 in
2010, it was demonstrated that the GIK therapy in the studies analyzed conducted during a pre-revas-cularization/fibrinolysis period presented benefits for the clinical outcome. Upon comparing these data with more recent studies, it is possible that the GIK therapy benefits only patients in whom the reperfu-sion has not been reached.
When analyzing the studies, it is evident that the interventions by the GIK studies, overall, provid-ed better blood glucose control for patients in both groups. For those submitted to GIK therapy, there was a discrete increase in blood glucose in compari-son with the placebo group, whose average pre-ran-domization blood glucose was of 150.48. After the intervention, the blood glucose average in the treat-ment group was of 137.7, and the average in the pla-cebo group was 131.4. Both results were very similar, which might justify the absence of benefits for the reduction of mortality when both groups were com-pared.
CONCLUSION
should be sought during the acute stage of the AMI is inconsistent and that GIK therapy did not present any benefits for this same group of patients. On the other hand, our study supports the hypothesis that there must be a fine limit between effectiveness and safety for blood glucose reduction in the acute stage.
Thus, the reasonable blood glucose targets should be guided, preferably, by the average estimated blood glucose and should not exceed a reduction of 36 mg/ dL of blood glucose. Additional studies are still neces-sary to confirm the ideal targets and dissect the dif-ferences between diabetic and non-diabetic patients.
RESUMO
INTRODUÇÃO: No infarto agudo do miocárdio (IAM), cada incremento de 18 mg/dl (1 mmol/L) se associa a um aumento de 3% na mortalidade. As estratégias de redução da glicemia tentadas até o momento, entretanto, não trouxeram resultados animadores.
METODOLOGIA: Foram pesquisadas nas bases de dados Medline (PubMed) e Cochrane Library os ensaios clínicos randomizados (ECRs) de 1995 a 2017 que utilizaram estratégia intensiva ou a terapia GIK no controle glicêmico durante a fase aguda do IAM. Foram incluídos oito estudos. Para identificar os efeitos da insulinoterapia ou da terapia GIK, calculamos um risco relativo geral (RR) com meta-análises de modelos de efeitos fixos e aleatórios. Um valor de p-bicaudal < 0,05 foi considerado estatisticamente significativo.
RESULTADOS: Foram incluídos 28.151 pacientes, sendo 1.379 no grupo de tratamento intensivo da glicemia, 13.031 no GIK e 13.741 no controle. A mortalidade total foi de 2.961 (10,5%), computando um risco relativo de 1,03 [95%CI 0,96–1,10]; I2 = 31%; p = 0,41 para o
grupo intensivo ou GIK contra o grupo conservador. Reduções intensas (> 36 mg/dL) em relação à glicemia estimada média se asso-ciaram à maior mortalidade, enquanto reduções menores não se assoasso-ciaram com seu incremento ou redução. A redução glicêmica na fase aguda em relação à glicemia estimada média foi mais efetiva e segura na faixa em torno de 18 mg/dL.
CONCLUSÃO: Esta meta-análise levanta a hipótese de haver um limite tênue entre efetividade e segurança para a redução glicêmica na fase aguda, sendo que os alvos não devem exceder uma redução maior do que 36 mg/dL de glicemia.
PALAVRAS-CHAVE: Hiperglicemia. Infarto do miocárdio. Meta-análise como assunto. Efetividade. Segurança. Cuidados críticos.
REFERENCES
1. Stranders I, Diamant M, van Gelder RE, Spruijt HJ, Twisk JW, Heine RJ, et al. Admission blood glucose level as risk indicator of death after myocar-dial infarction in patients with and without diabetes mellitus. Arch Intern Med. 2004;164(9):982-8.
2. Mulder M, Cornel JH, van der Ploeg T, Boersma E, Umans VA. Elevat-ed admission glucose is associatElevat-ed with increasElevat-ed long-term mortality in myocardial infarction patients, irrespective of the initially applied reperfu-sion strategy. Am Heart J. 2010;160(3):412-9.
3. Malmberg K, Rydén L, Efendic S, Herlitz J, Nicol P, Waldenström A, et al. Randomized trial of insulin-glucose infusion followed by subcutane-ous insulin treatment in diabetic patients with acute myocardial
infarc-tion (DIGAMI study): effects on mortality at 1 year. J Am Coll Cardiol. 1995;26(1):57-65.
4. Malmberg K, Rydén L, Wedel H, Birkeland K, Bootsma A, Dickstein K, et al. DIGAMI 2 Investigators. Intense metabolic control by means of insulin in patients with diabetes mellitus and acute myocardial infarction (DIGA-MI 2): effects on mortality and morbidity. Eur Heart J. 2005;26(7):650-61.
5. Cheung NW, Wong VW, McLean M. The hyperglycemia: intensive insulin infusion in infarction (HI-5) study: a randomized controlled trial of insulin in-fusion therapy for myocardial infarction. Diabetes Care. 2006;29(4):765-70.
6. Inzucchi SE, Siegel MD. Glucose control in the ICU: how tight is too tight? N Engl J Med. 2009;360(13):1346-9.
7. Sodi-Pallares D, Testelli MR, Fishleder BL, Bisteni A, Medrano GA, Fried-land C, et al. Effects of an intravenous infusion of a potassium-glucose-in-sulin solution on the electrocardiographic signs of myocardial infarction. A preliminary clinical report. Am J Cardiol. 1962;9:166-81.
8. Van der Horst IC, Zijlstra F, van’t Hof AW, Doggen CJ, de Boer MJ, Suryapranata H, et al.; Zwolle Infarct Study Group. Glucose-insulin-po-tassium infusion in patients treated with primary angioplasty for acute myocardial infarction: the glucose-insulin-potassium study: a randomized trial. J Am Coll Cardiol. 2003;42(5):784-91.
9. Timmer JR, Svilaas T, Ottervanger JP, Henriques JP, Dambrink JH, van den Broek SA, et al. Glucose-insulin-potassium infusion in patients with acute myocardial infarction without signs of heart failure: the Glucose-Insu-lin-Potassium Study (GIPS)-II. J Am Coll Cardiol. 2006;47(8):1730-1.
10. Mehta SR, Yusuf S, Diaz R, Zhu J, Pais P, Xavier D, et al.; CREATE-EC-LA Trial Group Investigators. Effect of glucose-insulin-potassium infu-sion on mortality in patients with acute ST-segment elevation myocar-dial infarction: the CREATE-ECLA randomized controlled trial. JAMA. 2005;293(4):437-46.
11. Kosiborod M, Rathore SS, Inzucchi SE, Masoudi FA, Wang Y, Havranek EP, et al. Admission glucose and mortality in elderly patients hospitalized with acute myocardial infarction: implications for patients with and without recognized diabetes. Circulation. 2005;111(23):3078-86.
12. Goyal A, Mahaffey KW, Garg J, Nicolau JC, Hochman JS, Weaver WD, et al. Prognostic significance of the change in glucose level in the first 24 h after acute myocardial infarction: results from the CARDINAL study. Eur Heart J. 2006;27(11):1289-97.
13. Oswald GA, Smith CC, Betteridge DJ, Yudkin JS. Determinants and impor-tance of stress hyperglycaemia in non-diabetic patients with myocardial infarction. Br Med J. 1986;293(6552):917-22.
14. Capes SE, Hunt D, Malmberg K, Gerstein HC. Stress hyperglycaemia and increased risk of death after myocardial infarction in patients with and without diabetes: a systematic overview. Lancet. 2000; 355(9206):773-8.
15. Chen SM, Tsai TH, Hang CL, Yip HK, Fang CY, Wu CJ, et al. Endothelial dysfunction in young patients with acute ST-elevation myocardial infarc-tion. Heart Vessels. 2011;26(1):2-9.
16. Fadini GP, Sartore S, Agostini C, Avogaro A. Significance of endothelial progenitor cells in subjects with diabetes. Diabetes Care. 2007;30(5):1305-13.
17. Díaz R, Goyal A, Mehta SR, Afzal R, Xavier D, Pais P, et al. Glucose-insu-lin-potassium therapy in patients with ST-segment elevation myocardial infarction. JAMA. 2007;298(20):2399-405.
18. Fath-Ordoubadi F, Beatt KJ. Glucose-insulin-potassium therapy for treat-ment of acute myocardial infarction: an overview of randomized place-bo-controlled trials. Circulation. 1997;96(4):1152-6.
ANNEX 1
Data Source and Research
The following terms were used in our search: “acute myocardial infarction”, “diabetes mellitus” and “stress hyperglycemia” and “stress hyperglyce-mia in acute myocardial infarction” and (ensaio clíni-co aleatório clíni-controlado OU ensaio clíniclíni-co clíni-controlado OU randomizado OU placebo OU terapia medica-mentosa OU aleatoriamente OU julgamento ou gru-pos NÃO animais) and (ensaio clínico randomizado controlado e humanos) and (ensaio clínico controla-do aleatório e humanos).
During the search strategy, we selected the follow-ing languages: English, Spanish, and Portuguese. How-ever, all relevant articles were published in English, con-ducted in human beings, and classified as RCTs.
– Definitions
Hyperglycemia in an acute myocardial infarc-tion event was characterized according to the defi-nition of each researcher. Usually, these defidefi-nitions included the following terms from the MedDRA ter-minology: “hyperglycemia after acute myocardial in-farction” and “hyperglycemia and mortality in acute myocardial infarction.”
– Data Extraction and Quality Assessment
Two researchers who were not involved in any of the studies selected collected the data using a pre-set table and assessed, independently, the precision of the data, solving any discrepancies through consen-sus after a discussion with a third researcher. The following items were extracted from the studies in-cluded: name of the first author, year of publication, study design, characteristics of the patients, sample size, duration of the intervention, type of dose con-trol, clinical outcomes, and adverse events. If a study was published more than once, we included the most recent report. If the patients were recruited for more than one study, they were not counted twice. The Co-chrane Collaboration¹ tool to assess the risk of bias was used to assess the different types of bias within the studies included in our meta-analysis, and the quality of the study was assessed using the Grade² system. Two unblinded researchers independently assessed the potential risk of bias in the RCTs using the methods described in the Cochrane Collaboration guidelines. Our co-primary outcomes were: 1) Blood glucose levels after one of the approaches had been applied, and 2) mortality for each of the approaches.
– Studies Included and Excluded
Using the Medline/PubMed, Cochrane Library and ClinicalTrials.gov databases, we identified 36 citations that used the search terms previously de-fined. After implementing our inclusion/exclusion criteria, we excluded 25 studies that did not present data on mortality or a comparison between a more intensive approach for the control of stress
hyper-FIGURE 1
FIGURE 2
glycemia and more conservative approaches, or that presented randomization or data analysis (n=2) bias-es, or were previous meta-analysis, which then re-sulted in 11 studies considered relevant for this me-ta-analysis.
Data Handling and Analysis
Dichotomous variables are reported as percent-ages, while continuous variables are reported as average ± SD or median (interquartile range). The baseline data were obtained through weighted calcu-lation. To identify the potential effects of the inten-sive strategy for blood glucose control, we calculated an overall risk ratio (RR) with meta-analyses of fixed and random effects models. Probability indexes and risk ratios were universally identical during the data
analysis. We assessed the statistical heterogeneity
between the trials using I2 statistics (with 95% CI)³,
which provides a measure of the proportion of over-all variation that can be attributed to heterogeneity between trials. We used risk ratios obtained through a fixed and random effects meta-analysis because they can be used as a sensitivity analysis. We used meta-regression analyses to investigate the possible sources of heterogeneity among the trials.
REFERENCES
1. Higgins JP, Altman DG. Assessing risk of bias in included studies. In: Co-chrane handbook for systematic reviews of interventions. Chichester: John Wiley & Sons; 2008. p.187-241.
2. Guyatt GH, Oxman AD, Vist GE, Kunz R, Falck-Ytter Y, Alonso-Coello P, et al. GRADE: an emerging consensus on rating quality of evidence and strength of recommendations. BMJ. 2008;336(7650):924-6.