Ecology of the green sea turtle
(
Chelonia mydas
L) in a
changing world
Submitted by
Ana Rita Caldas Patrício
to the University of Exeter as a thesis for the degree of
Doctor of Philosophy in Biological Sciences
August 2017
This thesis is available for Library use on the understanding that it is copyright material and that no quotation from the thesis may be published without proper
acknowledgement.
I certify that all material in this thesis that is not my own work has been identified and that no material has been previously submitted and approved for
the award of degree by this or any other University.
Signed:
2
3 Abstract
Climate change is threatening biodiversity, causing populations and species to adapt, or otherwise, become extinct. Sea turtles have survived dramatic climate changes in the past, however, due to a history of intense human exploitation, and the current anthropogenic threats, their current resilience may be
jeopardized. The main pursuits of this thesis were to i) evaluate the resistance of green turtles to predicted climate change impacts, using a globally significant rookery, in Poilão, Guinea-Bissau, as a case study; and ii) assess key
population parameters to inform the conservation management of this resource. As the work developed I additionally had the opportunity to study the dynamics of an emerging disease in a juvenile foraging aggregation from Puerto Rico, which contributed to a broader understanding of resilience in this species. Specifically, I investigate the nest site selection behaviour of green turtles, their nesting environment, and the outcomes for their offspring, at Poilão, and apply this information to infer on the resilience of this population under future
4 Acknowledgements
I am most thankful to my wonderful supervisory team; Brendan Godley, Paulo Catry and Annette Broderick, for their guidance, advice and support. Thank you Brendan for taking me as your student without knowing me, for being so
optimistic and supportive, and for pointing me in the right direction throughout my PhD. Thank you Paulo for being so enthusiastic about this project, for the incredible opportunity of conducting research at the most spectacular sea turtle rookery in the world, and for believing in me. Thank you Annette for being inspirational, and always caring.
Thank you to the amazing duo, Carlos Diez and Robert van Dam, the first sea turtle gurus I met, in 2006, with whom I collaborated for my masters, and have continued to collaborate to this day, including the present thesis. A big thanks to Carlos Carreras, for his support with the genetic analyses, and for his
friendship. Thank you also Lucy Hawkes, Rui Rebelo, and Angela Formia, for the important contributions to this thesis.
Throughout my PhD I was funded by a scholarship from the Foundation for Science and Technology of Portugal (FCT). Additional financial support for fieldwork and laboratory analyses was granted by the MAVA Foundation, the Rufford Foundation, NOAA's National Marine Fisheries Service, US Fish and Wildlife Service, Chelonia, and Widecast.
5
people; the IBAP park rangers César Banca, Paulino da Costa, Carlos Banca, Santinho da Silva, Saído Gomes, Seco Cardoso, João Pereira and Tio Zé, and the participants from Canhabaque Island; Sana, Beto, Matchu, Rapaz, Sene, Correia, Tó, Cândido, Neto, Iaia, Chiquinho, Mário, and Joaquim, for their help in the fieldwork, and for sharing their culture with me, an invaluable gift.
At Puerto Rico support was provided by the Department of Natural and
Environmental Resources (DNER-PR), and numerous national and international volunteers, and DNER biologists participated in the fieldwork.
A special thanks to my partner Miguel Varela, for his continuous support, his contribution for this thesis, and for joining ‘my world’ of sea turtle research and conservation.
6 Table of contents
Abstract ... 3
Acknowledgements ... 4
Table of contents ... 6
List of tables and figures ... 7
Author’s declaration ... 21
List of notations and abbreviations ... 24
General introduction ... 27
Chapter 1: Balanced primary sex ratios and resilience to climate change in a major sea turtle population ... 31
Chapter 2: Nest site selection repeatability and success of green turtle Chelonia mydas clutches ... 75
Chapter 3: Climate change resilience of a globally important green turtle population ... 113
Chapter 4: Dispersal of green turtles from Africa’s largest rookery assessed through genetic markers ... 149
Chapter 5: Novel insights into the dynamics of green turtle fibropapillomatosis ... 185
Final remarks ... 213
Conservation implications... 213
7 List of tables and figures
Chapter 1: Balanced primary sex ratios and resilience to climate change in a major sea turtle population
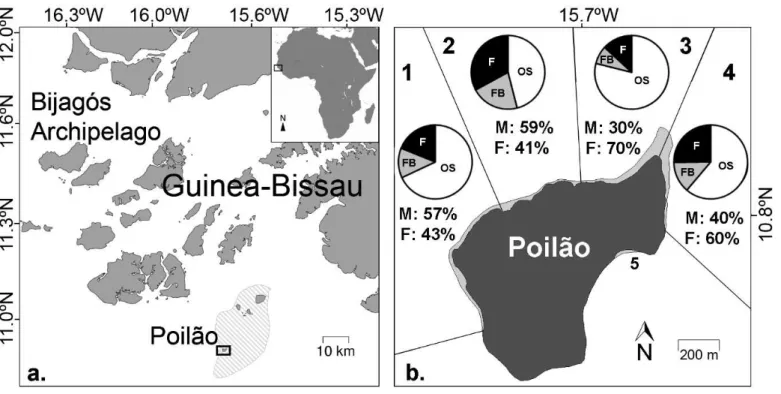
Figure 1a. Map of the Bijagós Archipelago, Guinea-Bissau: the João Vieira and Poilão Marine National Park is represented by the striped area, and the black frame depicts Poilão Island; b. Map of Poilão Island showing the four green turtle nesting beach sections monitored in this study (1-Farol, 2-Acampamento Oeste, 3-Acampamento Este, 4-Cabaceira). Pie charts present the mean nesting distribution across three habitats: ‘open sand’ (OS: white), ‘forest border’ (FB: grey), and ‘forest’ (F: black), in each section. Estimated mean proportion of males (M) and females (F) produced in each section are given (average across 2013 and 2014). Section 5-Praia Militar, was not monitored in this study due to difficult access and the small proportion of nests hosted there. (Maps created using www.seaturtle.org/maptool).
Figure 2a, b. Mean bi-weekly air temperature (open circles) and precipitation (bar) at Bolama Island (http://cdo.ncdc.noaa.gov/CDO/cdo); c, d. estimated mean incubation temperature during the thermosensitive period (TSP) experienced by green turtle clutches laid from 15 June to 15 December at
Poilão Island, at three habitats (OS-‘open sand’, FB-‘forest border’, F-‘forest’); e, f. bi-weekly proportion of green turtle nesting distribution at Poilão.
8
Figure 4a, b. Bi-weekly proportion of female (light grey) and of male (dark grey) green turtle hatchlings predicted to have been produced in Poilão Island,
Guinea-Bissau, with error bar showing upper 95% confidence interval (CI); and c.d. estimated mean sex ratio, with 95% CI, along the nesting season, in 2013 and 2014 (average across years).
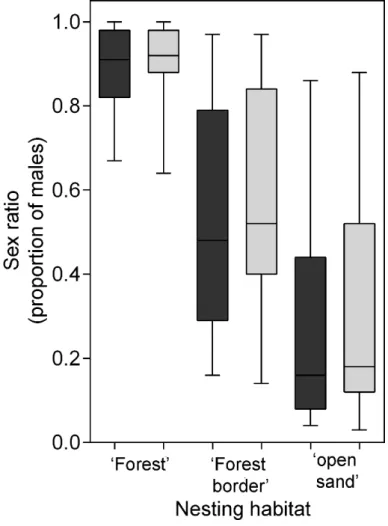
Figure 5. Estimated mean primary sex ratio (proportion of males) of green turtle hatchlings in each of three habitats: ‘forest’, ‘forest border’ and ‘open sand’, at Poilão Island, Guinea-Bissau, for 2013 (dark grey) and 2014 (light grey). Boxes show median, upper and lower quartile, and whiskers show highest and lowest observation.
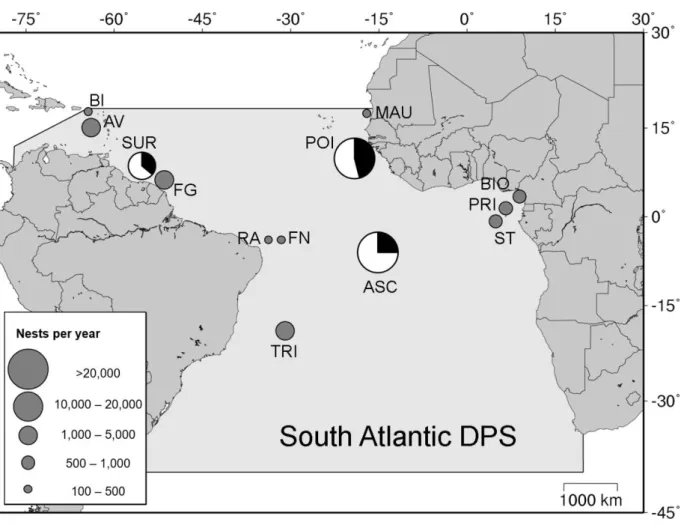
Figure 6. Limits of green turtle South Atlantic distinct population segment (DPS), showing rookeries with 100 or more nests per year. Pie charts indicate primary sex ratio (females: white, males: black), estimated for the three main nesting sites: Suriname (SUR, Godfrey et al. 1996, Seminoff et al. 2015), Ascension Island, UK (ASC, Godley et al. 2002, Weber et al. 2014), and Poilão Island, Guinea-Bissau (POI, this study, Catry et al. 2009). Other rookeries represented by grey circles do not have estimates of primary sex ratios: Buck Island, UK (BI, Seminoff et al. 2015), Aves Island, Venezuela (AV, Garcia Cruz et al. 2015), Yalimapo, French Guiana (FG, Chambault et al. 2016.), Rocas Atol, Brazil (RA, Bellini et al 2013), Fernando de Noronha, Brazil (FN, Bellini, Centro Tamar, pers. comm.), Trindade Island, Brazil (TRI, Almeida et al. 2011), Mauritania (MAU, Fretey pers. comm.), Bioko Island, Equatorial Guinea (BIO, Honarvar et al 2016), and Sao Tome (ST, ATM/MARAPA 2016) and Principe (PRI, Principe Trust Foundation pers. comm.), Sao Tome and Principe (Map created using www.seaturtle.org/maptool).
Chapter 1: supplementary Information
9
Table S2. Summary of Tukey HSD test results, looking at differences in mean incubation temperature during the middle third of development at four beach sections (see Fig.1b) and three habitats: ‘open sand’ from ≥ 1 m of vegetation or tree canopy to high tide line, ‘forest border from 0 – 1 m of vegetation or tree canopy,’ and ‘forest’, under vegetation or tree canopy. ‘diff’ is the difference in mean temperatures between beach sections, ‘lwr’ and ‘upr’ are the low and upper 95% confidence intervals, and P gives the significant level after
adjustment for the multiple comparisons.
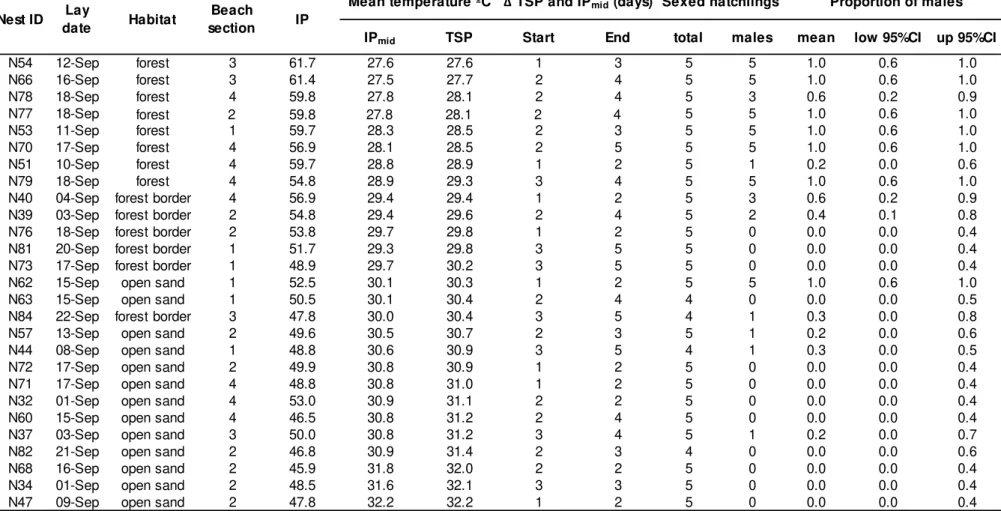
Table S3. Summary information for 27 green turtle clutches, incubated under natural conditions at Poilão Island, Guinea-Bissau, and respective number and proportions of male hatchlings sexed from each clutch. IP: incubation period to hatching; IPmid: middle third of IP; TSP: thermo-sensitive period; Δ: difference in days between start and end of TSP (estimated using 'embryogrowth' v.6.4 R package, Girondot and Kaska 2014) and IPmid (TSP – IPmid); CI: confidence interval. Habitat definitions can be found in the 'Materials and methods' section in the main article. For beach section definitions see Fig.1b.
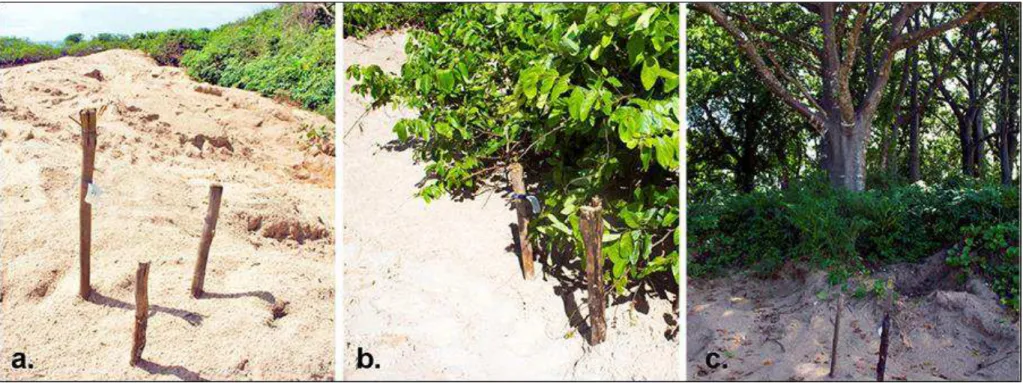
Figure S1. Nesting habitats utilized by green turtles at Poilão Island, Guinea-Bissau, according to vegetation cover: a. ‘open sand’ habitat, from >1m of the vegetation to high tide line, completely exposed to the sun; b. ‘forest border’, comprised between 0 – 1m of the vegetation line, with partial shade; c. ‘forest’, nesting area completely surrounded by trees or tall bushes, shaded throughout most or all of the day. Wooden poles surround clutches.
Figure S2. Mean incubation temperature during the thermosensitive period (middle third of development) of green turtle nests in three different habitats and four beach sections, at Poilão Island, Guinea-Bissau. For beach sections see Fig.1b. Habitat definitions can be found in the methods section and Fig. S1.
10
denotes mean difference between habitats. Habitat definitions can be found in the methods section and Fig. S1.
11
Chapter 2: Nest site selection repeatability and success of green turtle Chelonia mydas clutches
Table 1. Estimated area and proportion of each of three habitats, and each of four beach sections, used by green turtles nesting at Poilão Island, Guinea-Bissau, with the distribution of expected and observed nests at each
habitat/beach section, and respective chi-square test results for random
distribution hypothesis. For habitat and beach sections definitions see methods.
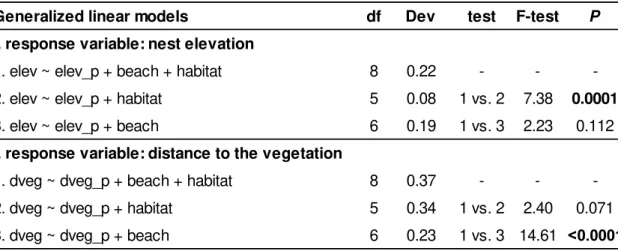
Table 2. Summary of model comparison, to determine which environmental factors, beach section (beach), and nesting habitat (habitat: ‘forest’, ‘forest border’ or ‘open sand’) predict i. nest elevation (elev), and ii. clutch distance to the vegetation (dveg), using as control variables “same female previous nest elevation (elev_p)” and “same female previous distance to the vegetation (dveg_p)”, accordingly. df: degrees of freedom, Dev: deviance explained by model. Bold indicates significant values (P<0.05).
Table 3. Summary of generalized addditive models (GAMs) looking at effects of nesting site (spatial predictors) on green turtle clutch survival at Poilão Island, Guinea-Bissau, with maternal and temporal variables as covariates. SE: standard error, df: estimated degrees of freedom of smooth term (1 = linear), NA: not applicable.
Table 4. Summary of generalized linear models (GLMs) looking at the effect of nesting habitat (‘open sand’ –OS, ‘forest border’ –FB, ‘forest’ – F) on green turtle hatchlings straight-carapace-length (SCL, cm), weight (g) and condition index (K=weight/SCL3), at Poilão Island, Guinea-Bissau, with maternal and temporal variables as covariates.
12
Figure 2. Orthophoto of green turtle nesting beach at Poilão Island, Guinea-Bissau, with kernel nesting density along four beach sections, based on 1,559 nest locations. FE: forest edge. Coloured contours indicate the smallest region containing each probability number of nests (25%, 50%, 75%).
Figure 3. Distribution of green turtle nests (N=1,559) at four beach sections (1: 470; 2: 306; 3: 433; 4: 350), at Poilão Island, Guinea-Bissau: a. across beach width, at three habitats: F - ‘forest’ (dark grey), FB –‘forest border’, and OS –‘open sand’ (light grey): each bar at the‘open sand’ represents a fourth of the habitat’s extension from the forest border to the sea. Mean beach width ± SD is given for each beach section; b. along elevation: the shaded area highlights the nests that are above the highest spring tide (HST=4.7m, João Vieira Island tidal table, 17km distant). The mean nest elevation ± SD is given for each section.
Figure 4. Frequency distribution of differences between two consecutive nests of green turtle females (n=220 nests, from 110 females), at Poilão island, Guinea-Bissau in: a. distance along the beach, b. distance to the vegetation, and c. elevation, with respective measure of repeatability (R), along with 95% confidence intervals (CI) and significant values. Arrows indicate the mean
difference between any two random nests after 10,000 iterations, for each of the variables observed. Only two nests from each female were considered to avoid introducing bias by pseudoreplication (i.e. if females with three or more clutches are highly consistent or vive-versa).
Figure 5. Hatching success of green turtle nests against nest elevation, at Poilão, Guinea-Bissau: circles represent raw values (2013: grey, 2014: open), curves show fitted logistic regression (2013: black, 2014: light grey).
13
Figure 6. Effect of nesting habitat on green turtle hatchling phenotype, at Poilão Island, Guinea-Bissau: a. straight-carapace-length (SCL), and b. condition index (K = weight / SCL3), in 2013 (dark grey), and 2014 (light grey). F: ‘forest’; FB: ‘forest border’; OS: ‘open sand’.
Chapter 2: supplementary information
Table S1. Distribution of expected and observed nests at three nesting habitats for green turtles, at Poilão Island, Guinea-Bissau, and respective chi-square test results for random distribution hypothesis, for each of four beach sections, and for the total extension of the beach.
Figure S1. Orthophoto of Poilão Island, Guinea-Bissau, showing green turtle kernel nest density, in 2013 and 2014. Nest distribution was assessed through surveying all females found nesting in each of three nights in 2013 (n=407), and six nights in 2014 (n=1,152), during the peak of the nesting seasons. Coloured contours indicate the smallest region containing each probability number of nests (25%, 50%, 75%).
Figure S2. Distribution of nests from 110 green turtles, at Poilão Island, Guinea-Bissau: a. along the beach, b. in relation to the distance to the vegetation (negative numbers indicate nests under the vegetation), and c. across elevation. These are not meant to represent the population distribution, but to show that there was sufficient between-individual variation on nest site selection, such that the measure of repeatability would reflect within-individual variability.
14
Chapter 3: Climate change resilience of a globally important green turtle population
Table 1. Representative concentration pathways (RCPs) from the IPCC fifth assessment report (Collins et al., 2013), and estimated values for each of nine criterion used to assess the resistance to climate change of the major green turtle population nesting at the Bijagós Archipelago, Guinea Bissau, and respective score in parenthesis, following the framework proposed in Abella-Perez et al. (2016).
Figure 1. Historical and projected a. incubation temperatures, and b. proportion of hatchlings expected to be female, in three nesting microhabitats for green turtles, at Poilão Island, Guinea-Bissau. OS –‘open sand’, FB –‘forest border’, F –‘forest’. Orange curve (overall) shows projection of primary sex ratio
accounting for the current nesting distribution across microhabitats, and for the emergence success at each microhabitat. Solid horizontal line indicates a. pivotal temperature for this population (29.4 ºC, Patrício et al. 2014), and b. 1:1 sex ratio.
Figure 2. a. Mean bi-weekly air temperature, b. precipitation and c. green turtle nesting distribution with density curve of thermosensitive period distribution (dashed red line), at Poilão Island, Guinea-Bissau, averaged across four years: 2013-2016. Climate data obtained from the National Climatic Data Centre (http://cdo.ncdc.noaa.gov/CDO/cdo, closest meteorological station Bolama Island, 50km distant).
Figure 3. Proportions of male (black) and female (grey) green turtle hatchlings (x-axes), in three nesting microhabitats, across the nesting season, at Poilão Island, Guinea-Bissau: current estimates and projections for 2100, under three climate models, RCP4.5, RCP6 and RCP8.5 (Collins et al., 2013). See Table 1 for climate model details, see methods for habitat definitions.
15
of SLR: a. RCP4.5-0.47m, and RCP6-0.48m; b. RCP8.5-0.63m (from IPCC AR5; Collins et al. 2013), and c. projection derived from semi-empirical models: 1.2m (Horton et al. 2014).
Figure 5. Frequency distributions of nitrogen stable isotopic signature (δ15N) for nesting green turtles from Poilão Island, Guinea-Bissau, in 2013 (11.6 ‰ ± 2.4 SD, n=78, black), 2014 (11.2 ‰ ± 2.2 SD, n=71, grey), and 2016 (11.8 ‰ ± 2.3 SD, n=37, white).
Figure 6. Nesting female recruitment to the green turtle rookery in Poilão Island, Guinea-Bissau, in relation to the present (i.e. 2013-2016), considering a minimum age at maturity of 20 years (Bell et al. 2005, Patrício et al. 2014). In the y-axis, a 0 (dashed line) indicates no change in the number of nesting females, and a recruitment of 100% indicates a doubling. The black curve accounts for the temperature-linked hatchling mortality effect, absent in the grey curve.
Chapter 3: supplementary information
Table S1. Climate change resistance scoring for sea turtles, adapted from Abella-Perez et al. (2016), defined as: 1. Primary sex ratio: % of female hatchlings; 2. emergence success: % of hatchlings emerging from nests; 3. availability of spatial microrefugia: % of clutches laid in the warmest
microhabitat (see methods section for definition of microhabitats); 4. availability of temporal microrefugia: % of clutches laid during the warmest periods (above the mean annual temperature); 5. sea level rise: % of current nesting habitat expected to become completed flooded; 6. foraging plasticity: putative number of prey species consumed, from highly specialized to generalist diets; 7. other threats: combination of presence of direct harvest at breeding site and a
16
Chapter 4: Dispersal of green turtles from Africa’s largest rookery
assessed through genetic markers
Table 1. Nesting populations (n=14) and foraging grounds (n=17) for Atlantic green turtles Chelonia mydas included in a many-to-many mixed-stock analysis,
using the control region of mtDNA as a marker (490bp).
Table 2. Haplotype and nucleotide diversity (means ± SD) of Atlantic green turtle Chelonia mydasnesting populations (n=14) included in a ‘many-to-many’
mixed-stock analysis, using the control region of mtDNA as a marker (490bp). Number of females refers to total number of reproductive females in each population (Seminoff et al., 2015). The present study population is in bold. Site abbreviations as in Table 1.
Figure 1. a. Atlantic green turtle Chelonia mydasnesting populations (Δ; n=14)
and foraging grounds (n=17) used in a ‘many-to-many’ mixed-stock analysis (MSA), and results of foraging ground-centric MSA (pie charts: in black proportion of each foraging site that originates from the study population in bold; see Table 1 for abbreviations and data sources. Arrows indicate general direction of major currents. GfC: Gulf Current, NEC: North Equatorial Current, SEC: South Equatorial Current, BrC: Brazil Current, GC: Guinea Current, BgC: Benguela Current. b. Region map with study site, Poilão, and three juvenile foraging grounds likely to partly originate at Poilão, but genetically
uncharacterized: Unhocomo/Unhocomozinho and Varela (Guinea-Bissau), and Banc d’Arguin (Mauritania). Dashed arrow illustrates the direction of four adult female green turtles tracked from Poilão to Banc d’Arguin (Godley et al., 2010). (Maps created using www.seaturtle.org/maptool).
Figure 2. Principal coordinate analysis (PCoA) of 14 Atlantic green turtle
Chelonia mydaspopulations using ΦST distances, and considering the 490bp
17
Figure 3. Mean relative contribution of the Poilão nesting population of Atlantic green turtles Chelonia mydas to 17 foraging grounds, estimated by a ‘
many-to-many’ mixed-stock analysis. Error bars show 95% confidence intervals. See Table 1 for site abbreviations. Dashed lines separate geographic regions.
Chapter 4: supplementary information
Table S1. mtDNA control region haplotype frequencies (490bp), at 14 Atlantic green turtle nesting populations with total no. of samples per area. See Table 1 for site abbreviations. Long haplotypes (856bp) for study area are shown in the table below
Table S2. Pairwise exact test P-values (above diagonal) and pairwise FST
values (below diagonal), among 14 Atlantic green turtle Chelonia mydas nesting
populations, based on ~490bp sequences of the control region of the mtDNA. The study site is in grey and in bold, and abbreviations follow those in Table 1. Asterisks indicate statistically significant comparisons (*P<0.05, **P<0.01,
***P<0.001) i) prior to corrections, in the low diagonal, ii) after false discovery
rate (FDR) correction, in the above diagonal. Non-significant values, after FDR (Narum, 2006) correction, are marked in bold (for a P< 0.05 FDR=0.0098, P<
0.01 FDR=0.0020, P< 0.001 FDR=0.0002).
Table S3. Summary of source-centric mixed stock analysis of Atlantic green turtle Chelonia mydas nesting populations (n=14) and juvenile foraging grounds
(n=17), using ~490bp sequences of the control region of the mtDNA.
Table 4. Summary of foraging ground-centric mixed stock analysis of Atlantic green turtle Chelonia mydas rookeries (n=14) and foraging grounds (n=17),
18
Figure S1. Comparison of mean contributions, and 95% confidence intervals, from Poilão rookery (West Africa) to 17 green turtle Atlantic foraging
aggregations, estimated through a ‘many-to-many’ mixed stock analysis, using different simulated datasets against the actual dataset - black squares. Grey circle – including a rare haplotype (CM-A42) found at Poilão in Ascension Island sample, white triangle – including CM-A42 in Costa Rica sample, and grey diamond – adding a putative foraging ground fixed for haplotype CM-A8 (n=99). SIM: simulated foraging ground, WA: ‘Western Africa’ – Liberia to Benin, ST: Sao Tome, COR: Corisco Bay, CV: Cape Verde, BuA: Buenos Aires, UB: Ubatuba, ALF: Almofala, CB: Cassino Beach, FN: Fernando de Noronha, ES: Espírito Santo, BA: Bahia, AI: Arvoredo Island, RC: Rocas Atol, BRB:
19
Chapter 5: Novel insights into the dynamics of green turtle fibropapillomatosis
Table 1. Summary of linear mixed effects models fitted to captures of immature green turtles from Puerto Rican foraging grounds. BCI=body condition index, FP=fibropapillomatosis, ID=turtle ID, TS=tumour score.
Table 2. Summary of generalized additive mixed models (GAM) fitted to captures of immature green turtles from 2 Puerto Rican foraging grounds, Puerto Manglar and Tortuga Bay, to model the relationship between
fibropapillomatosis expression (FP, response variable) and straight carapace length (SCL) and sampling year (predictor variables or covariates). edf: estimated degrees of freedom of smooth term, ref.df: estimated residual degrees of freedom of smooth term (1=linear)
Figure 1. Percentage of captures of healthy green turtles (light grey) and those with fibropapillomatosis (FP; dark grey), at two juvenile turtle foraging grounds, Tortuga Bay (N = 321) and Puerto Manglar (N = 443), Puerto Rico, throughout 18 yr of capture-mark-recaptures.
Figure 2. Graphical summary of generalized additive models fitted to an 18 yr green turtle mark-recapture dataset. Response variable: probability of
fibropapillomatosis (FP) among immature green turtles from (a,b) Puerto Manglar and (c,d) Tortuga Bay foraging grounds, Culebra, Puerto Rico.
Predictor variables: (a,c) straight carapace length and (b,d) year. P-values are
displayed for significant effect of covariates in FP incidence.
Figure 3. Distribution of straight carapace lengths (SCLs) at first capture of green turtles: (a) healthy, (b) with fibropapillomatosis (FP), and (c) after
20
Figure 4. Straight carapace length at the first capture of resident green turtles at Puerto Manglar, Puerto Rico, that (a) were healthy and subsequently
developed fibropapillomatosis (FP; n=12), and (b) had FP and later recovered from the disease (n=12). The x-axes show the time (in yr) for each transition. Circled numbers identify unique individuals, and grey circles highlight turtles for which both transitions were recorded (n = 5). Dashed vertical line: mean time for each transition (light grey bars: SD).
Figure 5. Percentage of captures of immature green turtles foraging at Puerto Manglar, Puerto Rico, corresponding to four straight carapace length (SCL) size classes (cm), throughout 18 yr of capture-mark-recaptures. The white size class (SCL<40cm) is indicative of recruitment
Chapter 5: supplementary information
Table S1. Population parameters at two foraging grounds for immature green turtles: Puerto Manglar and Tortuga Bay, Puerto Rico. Ni: abundance.
Table S2. Number of individual captures per year of immature green turtles, at two foraging grounds in Puerto Rico; Puerto Manglar and Tortuga Bay, and annual prevalence of fibropapillomatosis (FP).
21
Author’s declaration
All chapters presented in this thesis were written by Ana R. Patrício, under the supervision of Brendan J. Godley, Paulo Catry, and Annette C. Broderick.
Molecular analyses were conducted at the Centre for Ecology and Conservation (CEC) of the College of Life and Environmental Sciences, University of Exeter, and DNA sequencing was carried out by Macrogen Europe (Macrogen ®). Histological analyses were conducted at the Centre for Ecology, Evolution and Environmental Changes of the Faculty of Sciences, University of Lisbon. Isotope analysis was conducted at the Stable Isotope Facility of the
Environment and Sustainability Institute (ESI; University of Exeter, Penryn Campus). Fieldwork was carried at Poilão Island, Bijagós Archipelago, Guinea-Bissau, under the coordination of the Institute for Biodiversity and Protected Areas of Guinea-Bissau (IBAP-GB), and at Culebra and Culebrita Islands, Puerto Rico, under coordination of the Department of Natural and
Environmental Resources of Puerto Rico (DNER-PR). Several community members from the Bijagós participated in monitoring and data collection at Poilão Island, and numerous national and international volunteers contributed to the in-water capture-mark-recaptures of green turtles in Puerto Rico.
Chapter 1: Balanced primary sex ratios and resilience to climate change in a major sea turtle population
Ana R. Patrício, Ana Marques, Castro Barbosa, Annette C. Broderick, Brendan J. Godley, Lucy A. Hawkes, Rui Rebelo, Aissa Regalla and Paulo Catry
ARP, PC, BJG, ACB and LAH planned fieldwork methods. ARP, AM, CB, and PC conducted fieldwork. CB and AR coordinated fieldwork logistics and
22
Chapter 2: Nest site selection repeatability and success of green turtle Chelonia mydas clutches
Ana R. Patrício, Miguel R. Varela, Castro Barbosa, Annette C. Broderick, Brendan J. Godley, Maria B. Ferreira Airaud, Aissa Regalla, Dominic Tilley, Paulo Catry
ARP, PC, BJG, and ACB planned fieldwork methods. ARP, MRV, CB, MBFA, DT, and PC conducted fieldwork. CB and AR coordinated fieldwork logistics and research permits. MRV conducted drone aerial surveys, photogrammetry
analysis and created the orthophotos and digital elevation models (DEMs) of the nesting beach. ARP assembled and analysed data, produced all figures and tables, and was lead author on the manuscript. PC, BJG and ACB provided guidance on data analysis and writing, and all co-authors provided useful comments on the manuscript.
Chapter 3: Climate change resilience of a globally important green turtle population
Ana R. Patrício, Miguel R. Varela, Annette C. Broderick, Paulo Catry, Lucy A. Hawkes, Aissa Regalla, Brendan J. Godley
23
Chapter 4: Dispersal of green turtles from Africa’s largest rookery assessed through genetic markers
Ana R. Patrício, Angela Formia, Castro Barbosa, Annette C. Broderick, Mike Bruford, Carlos Carreras, Paulo Catry, Claudio Ciofi, Aissa Regalla, Brendan J. Godley
ARP, CB and PC conducted fieldwork. CB and AR coordinated fieldwork logistics and research permits. AF contributed partially to the molecular analyses, with the collaboration of MB and CCiofi. CCarreras supervised molecular analyses conducted by ARP. ARP assembled and analysed data, produced all figures and tables, and was lead author on the manuscript. BJG, CCarreras, PC, and ACB provided guidance on data analysis and writing, and all co-authors provided useful comments on the manuscript.
Chapter 5: Novel insights into the dynamics of green turtle fibropapillomatosis
Ana R. Patrício, Carlos E. Diez, Robert P. van Dam and Brendan J. Godley
24 List of notations and abbreviations
Notations:
h– Haplotype diversity
π– Nucleotide diversity ΦST – Genetic distances
K –Fulton’s body condition index R - Repeatability
Abbreviations:
AR5 – Fifth assessment report BCI – Body condition index
BLAST - Basic Local Alignment Search Tool bp – Base pairs
CCL – Curved-carapace-length ChHV5 – Chelonid herpesvirus-5 CMA –Chelonia mydas Atlantic
CMR – Capture-mark-recapture CSI – Cumulative Impact Score DEM – Digital elevation model DPS – Distinct population segment
ESD – Environmental-dependent sex determination F –‘Forest’
FB –‘Forest border’
FDR – False discovery rate FP - Fibropapillomatosis
GAM – Generalized additive model GCP – Ground control point
GLM – Generalized linear model GSD – Genotypic sex determination HST – Highest spring tide
25 IPmid – middle third of the incubation period
IPCC – Intergovernmental Panel on Climate Change m2m MSA – Many to many mixed stock analysis MPA – marine protected area
MSA – Mixed stock analysis mtDNA – Mitochondrial DNA OS –‘Open sand’
OSR – Operational sex ratio
PCoA – Principal components analysis PIT – Passive integrated transponder (tag)
PNMJVP – National Marine Park of João Vieira and Poilão RCP - Representative concentration pathways
SCL – Straight-carapace-length SLR – Sea level rise
STR – Short tandem repeats
TRT – Transitional range of temperatures TS – Tumour score
27 General introduction
Marine turtles have been swimming in the world’s oceans and nesting on its fringing beaches for over 200 million years, surviving the mass extinction which saw the loss of dinosaurs. Since prehistory these resilient, long-living, marine ectotherms have been part of the human culture, playing important roles in mythology around the world (Stookey 2004), and used in religious ceremonies (Allen 2007, Catry et al. 2009), as well as representing an important protein source for coastal populations (Frazier 2003, Allen 2007). More recently, extensive trading of their meat, eggs, cartilage, oil, carapaces, and body parts, used as talismans, jewellery or other luxury items, led to the over-exploitation of sea turtles globally, and depletion of local populations (Bjorndal & Jackon 2002).
Among the seven extant sea turtle species, the green turtle Chelonia mydas L,
is probably the most charismatic (Rieser 2012), and historically the most widely exploited for human consumption (Aiken et al. 2001, Rieser 2012).
Conservation efforts for the past decades, leading to laws protecting sea turtles and their habitats and increased awareness, have contributed to the recovery of several of the major green turtle populations worldwide (Broderick et al. 2006, Chaloupka et al. 2008). However, the list of threats to these animals remains considerable, most notably bycatch from industrial and artisanal fisheries, illegal harvesting, habitat degradation, plastic ingestion, and climate change (Hamann et al. 2010). Sea turtles have endured pronounced climate changes in the past (Poloczanska et al. 2009), yet, it is uncertain whether they will be able to adapt to the current rapid changes, particularly as they face other human-induced threats that may act synergistically with climate change impacts (Brook et al. 2008).
In the present thesis, ‘Ecology of the green sea turtle (Chelonia mydas L) in
28
juvenile aggregation in Puerto Rico to assess the current impacts of an emerging disease, which may be enhanced by climate change (Harvell et al. 2002).
In the first chapter, ‘Balanced primary sex ratios and resilience to climate change in a major sea turtle population’, we model the population-specific sex determination response to incubation temperatures at Poilão, Guinea-Bissau, and apply the fitted model to estimate the primary sex ratio across the nesting season and nesting habitats. Our results are surprisingly different from the most common reports of highly-female biased primary sex ratios, and we found that the native vegetation was crucial for the production of male
hatchlings. Additionally, we highlight the importance of using population-specific parameters and of estimating the transitional range of temperatures, to
understand the response of populations to climate change.
In the second chapter, ‘Nest site selection repeatability and success of green turtle Chelonia mydas clutches’, we monitor the nest site selection behaviour of adult females in the same rookery, and the consequences for their offspring. We conduct the first repeatability analysis of nest site choice in green turtles, and found that individuals were both highly repeatable on their nesting habitat, and highly philopatric at a very fine-scale. Nest site selection involved tradeoffs in hatchling phenotype, but overall it enhanced clutch survival, suggesting it is an adaptive behaviour, while the high repeatabilities indicate potential for heritability of this trait. We explore here the potential of this behaviour for mitigation of predicted climate change impacts.
In the third chapter, ‘Climate change resilience of a globally important green turtle population’, we apply a vulnerability framework to conduct a comprehensive assessment of climate change resistance, using the most
uptodate climate models by the IPCC, together with empirical data. We estimate the impacts of global warming on the primary sex ratio and on female hatchling output, and of sea level rise on the current nesting habitat. We further explore the availability of spatial and temporal microrefugia, and, based on the
knowledge obtained from this and the two previous chapters, discuss the
29
be resistant to climate change with potential for resilience to expected impacts. The methodology used is transferrable to other rookeries, allowing comparisons between populations, and region-wide assessments.
Due to their migratory behaviour, marine turtles establish important links between distant geographic areas, encountering a range of threats throughout their movements. It was therefore important for us to unravel the connectivity of this major green turtle rookery. So, in the fourth chapter, ‘Dispersal of green
turtles from Africa’s largest rookery assessed through genetic markers’, we analyse the genetic composition of the rookery at Poilão, and conduct a regional mixed stock analysis, incorporating all data available from Atlantic green turtle nesting populations and juvenile foraging aggregations. We
identified a haplotype previously only detected among green turtle juveniles, in African and South American aggregations. We estimated that the majority of the post-hatchlings disperse along the west coast of Africa, recruiting to African foraging grounds, but a meaningful proportion accomplishes a transatlantic migration, lilkely recruiting to South American juvenile aggregations.
In the fifth and final chapter, ‘Novel insights into the dynamics of green
turtle fibropapillomatosis’, we model the dynamics of Fibropapillomatosis (FP), an infectious neoplastic disease of marine turtles, using a long-term dataset from a juvenile aggregation in Puerto Rico. Although in this last chapter we study green turtles belonging to a different regional management unit, the work is relevant to the population in Guinea-Bissau, and globally, as insight gained should be applicable to other foraging aggregations affected by this disease. This is in fact the case of some West African aggregations, namely in Príncipe Island and Corisco Bay, to which the rookery of Poilão contributes, as revealed in chapter 4. We found that FP does not currently seem to be a major threat to green turtle populations, however, there is a paucity of data on disease prevalence in many regions, which needs to be addressed, particularly as
30 References
Aiken JJ, Godley BJ, Broderick AC, Austin T., Ebanks‐Petrie G, Hays GC (2001) Two hundred years after a commercial marine turtle fishery: the current status of marine turtles nesting in the Cayman Islands. Oryx 35: 145-151 doi: 10.1046/j.1365-3008.2001.00168.x
Allen MS (2007) Three millennia of human and sea turtle interactions in Remote Oceania. Coral Reefs 26: 959-970 doi: 10.1007/s00338-007-0234-x
Bjorndal KA, Jackson JBC "10 Roles of Sea Turtles in Marine Ecosystems: Reconstructing the Past." The Biology of Sea Turtles 2 (2002): 259. Broderick AC, Frauenstein R, Glen F, Hays GC, Jackson AL, Pelembe T,
Ruxton GD, Godley BJ (2006) Are green turtles globally endangered? Glob Ecol Biogeogr 15: 21-26 doi: 10.1111/j.1466-822x.2006.00195.x Brook BW, Sodhi NS, Bradshaw CJA (2008) Synergies among extinction
drivers under global change. Trends Ecol Evol 23: 453–460. doi:10.1016/j.tree.2008.03.011
Catry P, Barbosa C, Paris B, Indjai B, Almeida A, Limoges B, Silva C, Pereira H (2009) Status, ecology, and conservation of sea turtles in Guinea-Bissau. Chelonian Conserv Biol 8: 150-160 doi: 10.2744/CCB-0772.1
Chaloupka M, Bjorndal KA, Balazs GH, Bolten AB, Ehrhart LM, Limpus CJ, Suganuma H, Troëng S, Yamaguchi M (2008) Encouraging outlook for recovery of a once severely exploited marine megaherbivore. Glob Ecol Biogeogr 17: 297-304 doi: 10.1111/j.1466-8238.2007.00367.x
Frazier J (2003) Prehistoric and ancient historic interactions between humans and marine turtles. The biology of sea turtles, 2, pp.1-38.
Hamann M, Godfrey MH, Seminoff JA, Arthur K, Barata PCR, Bjorndal KA, Bolten AB, Broderick AC, Campbell LM, Carreras C, Casale P (2010) Global research priorities for sea turtles: informing management and conservation in the 21st century. Endanger Species Res 11: 245-269 doi: 10.3354/esr00279
Harvell CD, Mitchell CE, Ward JR, Altizer S, Dobson AP, Ostfeld RS, Samuel MD (2002) Climate warming and disease risks for terrestrial and marine biota. Science 296: 2158−2162 doi: 10.1126/science.1063699
Poloczanska ES, Limpus CJ, Hays GC (2009) Vulnerability of marine turtles to climate change. Adv Mar Biol 56: 151-211 doi:
10.1016/S0065-2881(09)56002-6
Rieser A (2012) The case of the green turtle: An uncensored history of a conservation icon. JHU Press.
31
Chapter 1: Balanced primary sex ratios and resilience
to climate change in a major sea turtle population
Ana R. Patrício1, 2, Ana Marques3, Castro Barbosa4, Annette C. Broderick1, Brendan J. Godley1, Lucy A. Hawkes1, Rui Rebelo3, Aissa Regalla4 and Paulo Catry2
1 Centre for Ecology and Conservation, University of Exeter, TR10 9FE, Penryn, UK
2 MARE – Marine and Environmental Sciences Centre, ISPA – Instituto Universitário, 1140-041, Lisbon, Portugal
3 Centre for Ecology, Evolution and Environmental Changes (CE3C), Faculdade de Ciências, Universidade de Lisboa, Bloco C2, Campo Grande, 1749-016 Lisboa, Portugal
4 Institute of Biodiversity and Protected Areas of Guinea-Bissau (IBAP), CP – 70, Bissau, Guinea Bissau
32 Abstract
Global climate change is expected to have major impacts on biodiversity. Sea turtles have temperature-dependent sex determination, and many populations produce highly female-biased offspring sex ratios, a skew likely to increase further with global warming. We estimated the primary sex ratio at one of the world’s largest green turtleChelonia mydas rookeries in Guinea-Bissau, West
Africa, and explored its resilience to climate change. In 2013 and 2014, we deployed dataloggers recording nest (n=101) and sand (n=30) temperatures, and identified hatchling sex by histological examination of gonads. A logistic curve was fitted to the data, to allow predictions of sex ratio across habitats and through the nesting season. The population-specific pivotal temperature was 29.4ºC, with both sexes produced within incubation temperatures from 27.6 to 31.4ºC: the transitional range of temperatures (TRT). Primary sex ratio changed from male- to female-biased across relatively small temporal and spatial scales. Overall it was marginally female biased, but we estimated an exceptionally high male hatchling production of 47.7% (95% CI: 36.7–58.3%) and 44.5% (95% CI: 33.8–55.4%) in 2013 and 2014, respectively. Both the temporal and spatial variation in incubation conditions and the wide range of the TRT suggest resilience and potential for adaptation to climate change, if the present nesting habitat remains unchanged. These findings underline the importance of
33 Introduction
Sex ratio is an important parameter to assess population viability and resilience (Melbourne and Hastings 2008, Mitchell et al. 2010). Balanced sex ratios, where males and females are approximately equal in numbers, seem to be the norm among species with genotypic sex determination (GSD) where frequency-dependent selection on the primary sex ratio is strong (Fisher 1930). In species with environmental-dependent sex determination (ESD) however, deviations from this equilibrium are widely observed (Bull 1983). Temperature-dependent sex determination (TSD) is the most common mechanism of ESD, in which offspring sex is determined by the incubation temperatures experienced during the thermosensitive period (TSP), corresponding approximately to the middle third of embryogenesis (Bull 1983). This is the mechanism of sex differentiation among crocodilians (Lang & Andrews, 1994), sphenodontians (Mitchell et al. 2010), some lizards (Viets et al. 1994), and most turtle species (Mrosovsky & Yntema 1980).
Among sea turtles, clutches demonstrate a thermal tolerance of 23 ºC to 35 ºC during incubation (Ackerman 1997, Howard et al. 2015). During the TSP, higher incubation temperatures produce female offspring, and lower incubation
temperatures produce males (Mrosovsky & Yntema 1980). Between these extremes, there is a transitional range of temperatures (TRT) at which both sexes can be produced (Mrosovsky & Yntema 1980). The constant temperature resulting in a 1:1 sex ratio is known as the pivotal temperature, and it has been shown under laboratory conditions to be approximately 29 ºC for most sea turtle species (Ackerman 1997, Hawkes et al. 2009; Witt et al. 2010). Under natural conditions incubation temperatures fluctuate, typically associated with rainstorm events (Godfrey et al. 1996, Houghton et al. 2007, Lolavar & Wyneken, 2015, Matsuzawa et al. 2002) or diel temperature variation (Georges 2013), therefore, the equivalent of the pivotal temperature is given as the mean of the
temperatures experienced during the middle third of development leading to a balanced sex ratio (Mrosovsky & Pieau 1991, Girondot & Kaska 2014).
34
Because extreme temperatures could lead to the production of hatchlings of a single sex, sea turtles have been considered vulnerable to rapid climate and habitat change, as these may modify the thermal environment of their nests, skewing primary sex ratios (Hawkes et al. 2009, Mitchell & Janzen 2010, Poloczanska et al. 2009, Witt et al. 2010). Only one study thus far has
described male-biased primary sex ratios (Esteban et al. 2016). The majority of studies at sea turtle rookeries have estimated female-biased hatchling sex ratios, likely to worsen with future climate change (Hawkes et al. 2007, Fuentes et al. 2009, Fuentes et al. 2010a, Katselidis et al. 2012, Reneker & Kamel 2016), and beachfront deforestation (Kamel & Mrosovsky 2006a, Kamel 2013) . Feminising temperatures prolonged through generations could potentially lead to adaptive responses; by phenotypic plasticity and/or microevolutionary shifts in threshold temperatures, or otherwise lead to population extinction (Hulin et al. 2009, Mitchell & Janzen 2010). Although sea turtles have endured pronounced past climate variations (Poloczanska et al. 2009), it is uncertain whether they can adapt to the predicted future scenarios of change. Additionally, despite the fact that many major populations are recovering from historical exploitation following conservation efforts (McClenachan et al. 2006, Weber et al. 2014), climate change impacts may act synergistically with other existing threats to arrest population growth (Brook et al. 2008). Populations of sea turtles that nest across a wider range of thermal conditions should produce a broader variation in offspring sex ratio and thus should be more resilient to climate change and have higher chances of adaptation (Fuentes et al. 2013, Abella Perez et al. 2016).
Despite the increase in research on sea turtle primary sex ratios, and on the impacts of climate change in this trait (Rees et al. 2016), there are significant gaps in information at both regional and species levels (Fuller et al. 2013, Hawkes et al. 2009). The majority of research has been focused on loggerhead turtles Caretta caretta, followed by green turtles Chelonia mydas, with less data
on the remaining species (Hawkes et al. 2009). Geographically, most studies have been conducted on Mediterranean (Broderick et al. 2000, Casale et al. 2000, Godley et al. 2001a, Kaska et al. 2006, Zbinden et al. 2007, Katselidis et al. 2012, Fuller et al. 2013, Candan & Kolankaya 2016), West Atlantic
35
Houghton et al. 2007, Mrosovsky et al. 2009, LeBlanc et al. 2012, Patino-Martinez et al. 2012, Kamel 2013, Marcovaldi et al. 2014, Braun McNeill et al. 2016, Laloë et al. 2016, Marcovaldi et al., 2016, Reneker & Kamel 2016) and Australian (Booth & Freeman 2006, Fuentes et al. 2009, Fuentes et al. 2010a) turtle populations. Very limited information is yet available for most of the Pacific (King et al. 2013, Kobayashi et al. 2017), the Indian (Esteban et al. 2016), and the Eastern Atlantic Oceans (Abella Perez et al. 2016).
36 Materials and methods
Study site
In Guinea-Bissau, green turtles nest throughout the Bijagós Archipelago, with the vast majority of the clutches laid at Poilão (10°52’N, 15°43’W, Catry et al. 2002, Catry et al. 2009), the smallest and southernmost island within the João Vieira and Poilão Marine National Park (JVPMNP, Fig. 1a). An estimate of 29,000 clutches are laid annually here (Catry et al. 2009). Poilão has a total area of 43 ha, is covered by undisturbed tropical forest, and sandy beaches extend for 2km of the ca. 4km coastline (Fig. 1b). The nesting season (mid-June to mid-December, peaking in August and September; Catry et al. 2002), largely coincides with the rainy season (May to November), although sporadic nesting occurs year-round (C. Barbosa, pers. obs.).
Temporal nesting distribution
37 Spatial nesting distribution
The nesting area was divided in four beach sections, from West to East (1-4, Fig.1b). A smaller beach in the east (5; Fig.1b) was not monitored due to difficult access; nests there represented <5% of the overall numbers (C.
Barbosa, pers. obs.). Within each section we classified the distribution of nests
according to three habitats: ‘forest’, ‘forest border’ and ‘open sand’. The forest habitat encompassed the nesting area surrounded by vegetation and was shaded, the forest border comprised a band within 0-1m of the vegetation and experienced partial shade, and the open sand corresponded to the area from >1m of the vegetation to the high tide line, which was exposed to the sun throughout all or most of the day (see Fig. S1).
Due to the exceptionally high nesting density at Poilão, females typically disturb each other’s nests (Catry et al. 2009), making it impractical to locate these, even on the subsequent morning. Thus, to determine nest distribution across habitats we monitored turtle nesting activity at night, for three nights in 2013 (n=407 nests identified) and six nights in 2014 (n=1,152 nests identified), during the peak of the nesting season, and determined the habitat and beach section for all 1,559 nests. During these focused assessments we surveyed all four beach sections (2km), at high tide (see Catry et al. 2002), and as quickly as possible (typically <1 hour), to ensure that most females were detected. Only females that were laying, covering or camouflaging nests were counted, as otherwise turtles could still change their location or abandon nesting activity. To avoid counting the same female twice, this survey was conducted by one
person only, and only in one direction (i.e. on return no turtles were counted), additionally, in wider beach sections with higher density, temporary marks were drawn in the sand to identify a counted animal. We used chi-square statistics to test if the distribution of nests among beach sections, and among habitats within each beach section, was independent of survey date, within and between years.
Nest and sand temperatures
38
clutch (n=101 nests; 46 and 55 in 2013 and 2014, respectively), after ca. 50
eggs were laid, and we encircled each nest with three wooden poles, to help prevent destruction by other nesting females. The dataloggers had a long red string attached, extended to the subsurface, so it was easier to find them upon nest excavation, additionally, we surveyed these nests daily, to detect any perturbation. For a subset of nests (n=30; 16 and 14 for 2013 and 2014
respectively), control dataloggers were deployed 1m from the clutch, at a mean mid-clutch depth of ~70cm (local unplubl. data), to estimate the difference in sand temperature associated with metabolic heat produced by the eggs (Broderick et al. 2001a). Nest and control loggers were distributed across the four beach sections (section 1: n=19 nests; 5 control sites, section 2: n=25; 7, section 3: n=26; 8, section 4: n=31; 10), and the three habitats identified (‘open sand’: n=64 nests; 11 control sites, ‘forest border’: n=21; 9, ‘forest’: n=16; 10). All dataloggers were calibrated before and after each field season in a constant temperature room (24h at 28ºC) and used only if accuracy was ≤0.3ºC. Data were used to calculate mean temperatures during the middle third of incubation (IPmid), with the incubation period (IP) ending at hatching (identified as a peak in temperature followed by a decrease until emergence; Matsuzawa et al. 2002). We discarded the initial four hours of temperature records, to enable data loggers to equilibrate with the surrounding sand (Broderick et al. 2001a). For each nest we recorded beach section and habitat. At nest excavation we further recorded: nest chamber depth (after all nests contents were removed), clutch size (from a count of hatched and unhatched eggs), hatching success (H%=n hatched egg shells/clutch size), and emergence success (E%=(n egg shells – n dead and live hatchlings found inside nest chamber)/clutch size). A ‘reference’ datalogger was left to measure sand temperature from March 2013 to March 2015, to encompass both nesting seasons, and to enable comparisons with local air temperature. Due to the risk of dataloggers being removed outside of the monitoring campaign (by turtles or people), the
39
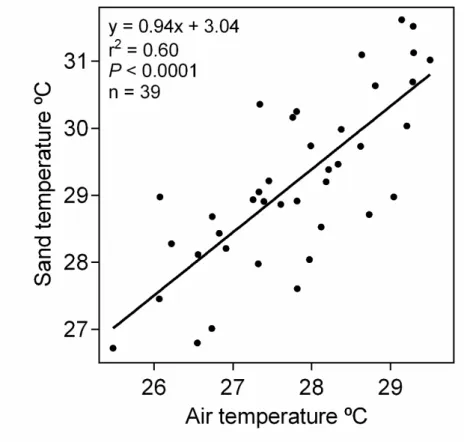
temperatures for nests laid from 15 June to 15 December (2013 and 2014) by calculating an 18-day moving average of sand temperature at each habitat, 18 days corresponding to the mean duration of IPmid (this study), and added mean metabolic heating (0.5 ± 0.4 ºC, mean value for this study). Sand temperature was regressed against air temperature, obtained from the National Climatic Data Centre (http://cdo.ncdc.noaa.gov/CDO/cdo, Bolama station, 50km distance), to reconstruct sand temperatures for periods of missing data (i.e. when no dataloggers recorded sand temperature).
Sex ratio estimations
In 2013 we deployed wire traps (50cm diameter x 30cm height, wire mesh 1cm2) above 27 of the monitored nests (i.e. nest with dataloggers) from Day 45 of incubation, checking them daily for emergent hatchlings. A random sample of four to five hatchlings per nest (total 131 hatchlings) were sacrificed, following procedures in Stocker (2005), for sex identification. Straight-carapace-length (SCL) of hatchlings was measured to 0.01cm with a digital caliper. Sampling and handling protocols were approved by the research ethics committee of the University of Exeter, and the government of the Republic of Guinea-Bissau. Kidney-gonad complexes were extracted through dissection and stored in 96% ethanol. In an effort to compensate for this action, across the two field seasons, we saved over 2,000 hatchlings from stranding on the intertidal rocks, where they generally die from exposure to sunshine and avian predators.
40
was 95% (compared for 131 hatchlings); for mismatched assignments (n=7) observers conferred until reaching agreement.
Data analysis
Generalised Linear Models (GLM) with Gaussian error structure and identity link function were used to test for the effects of beach, habitat, nest depth and clutch size (independent variables) on i) IPmid mean incubation temperature (response variable); and ii) hatching and emergence successes (response variables).
Most studies consider the IPmid as the TSP, however, as gonad differentiation depends on embryonic development rather than incubation duration, the TSP in nests with fluctuating temperatures may differ from the IPmid (Girondot &
Kaska, 2014). We thus used R package embryogrowth v.6.4 (see Girondot & Kaska, 2014 for detailed methods), which accounts for the stages of embryonic development in response to temperature, to estimate the beginning, end, and mean incubation temperatures of the TSP, for each nest with sexed hatchlings, using gastrula size for C. mydas from Kaska & Downie (1999), mean hatchling
41 Results
Nesting distribution
During our daily surveys, from early August to late November, we counted 48,696 green turtle tracks in 2013, and 83,304 in 2014, corresponding to 24,348 and 41,652 female emergences, respectively (each emergence corresponding to an ascending and a descending track). Following Catry et al (2009), we multiplied the number of emergences by 1.05, to account for the period of the nesting season that we did not monitor, and by 0.813 to adjust for nesting success (Catry et al. 2009). We estimate that in total 20,785 clutches (95% CI: 18,049 – 22,855) were laid in 2013 and 35,556 clutches (95% CI: 30,877 – 39,099) were laid in 2014. Peak nesting activity in both years was from August to September, coinciding with heavier precipitation (Fig. 2a, b, e, f).
The largest proportion (34.7 ± 1.4%) of tracks were found in section 1, followed by 24.9 ± 0.2% in section 4 and 20.4 ± 0.6%, and 20.0 ± 1.0% in sections 3 and 2 respectively. There was no difference in nesting distribution among beach sections (χ2(3)=0.14, P=0.98) or habitats (‘forest’, ‘forest border’, ‘open sand’;
Table S1) within and between study years. We thus calculated the mean nesting distribution among habitats; within each beach section (Fig.1b), and overall. Most of the clutches were laid in the open sand 64.2 ± 7.9 %, followed by the forest 22.1 ± 7.8%, and forest border 13.7 ± 5.1%.
Incubation temperatures
Clutch size (120.3 ± 30.2, n=98, F1,95=0.7, P=0.4) and bottom nest depth (0.8 m
± 0.2, n=98, F1,97=0.8, P=0.4) were poor predictors of IPmid mean incubation
temperatures. However, there were significant differences among nesting habitats (F2,89=27.1, P<0.01), with IPmid mean incubation temperatures
increasing from the ‘forest’ (28.3 ºC ± 0.7; range: 27.5 – 29.0 ºC, n=16), to the ‘forest border’ (29.7 ºC ± 0.7; range: 28.5 –30.3 ºC, n=21), and to the ‘open sand’ (30.6 ºC ± 0.8; range: 29.2 – 32.3 ºC, n=64). Additionally, there were significant differences in IPmid mean incubation temperatures among beach sections (F3,89=27.1, P<0.01), and within habitats among beach sections (i.e.
interaction of beach section and habitat: F6,89=27.1, P=0.04). A post hoc Tukey
42
warmer (31.1 ºC ± 0.6; range: 29.7 – 32.8 ºC, n=38, Fig. S2, Table S2) than in the western sections (1 and 2 in Fig.1b). In addition, IPmid mean incubation temperatures of the open sand nests located in the western sections (29.9 ºC ± 0.6; range: 29.2 – 31.1 ºC, n=25) were not significantly different from the nests located in the ‘forest border’ (P=0.45). Thus, clutches laid at the open sand in
the western beach sections’ experienced the same incubation temperatures predicted for the forest border habitat.
To estimate mean incubation temperatures at each habitat throughout both nesting seasons, we added mean daily differences in sand temperature, at the open sand (1.0 ºC; Fig. S3a, b) and at the forest habitat (-1.5 ºC; Fig. S3a, b), to the 18-day moving averages of the reference sand temperatures (‘forest
border’). Sand temperatures were highly correlated among habitats (open sand vs. forest border r2=0.96, and forest border vs. forest r2=0.94; Fig. S3c). We were unable to get sand temperatures for December 2013 and for July 2014, so we reconstructed these with air temperature using the equation Tsand=0.94Tair + 3.04 (T=temperature ºC, F1,37=54.53, P<0.0001, r2=0.60; Fig. S4). Finally, we
added 0.5 ºC of mean metabolic heating, estimated for the IPmid (0.5 ºC ± 0.4, range: -0.4 – 1.2 ºC, n=20). There were no significant differences among habitats in metabolic heating (F12, 17=1.7, P=0.22). Lower IPmid incubation
temperatures were predicted for nests laid in July and August, with higher temperatures expected for clutches laid in September and October (Fig. 2c, d).
Incubation period
We were able to estimate the IP (to hatching) of 88 nests, ranging from 40 to 70 days, with a mean of 53.5 ± 5.0 days. For the remaining 13 nests we estimated the IP by subtracting from the emergence date the mean length of the period between hatching and emergence, which was 5.0 ± 1.4 days. The IP was inversely correlated with mean incubation temperature (IP = -3.4644 * mean incubation temperature + 156.92, r2=0.87, P<0.0001). Consequently, mean IP decreased from the forest habitat (60.2 ± 5.1 days, n=13), to the forest border (55.5 ± 3.9 days, n=16), and to the open sand (51.3 ± 3.5 days, n=59).
Hatching and emergence successes
43
nest depth (F1, 92= 0.2, P=0.647), beach section (F3, 94=1.9, P=0.126), or habitat
(F2, 95=2.2, P=0.119). The emergence success was also independent of clutch
size (F1, 93=3.6, P=0.062), nest depth (F1, 92=0.3, P=0.592), and beach section
(F3, 94=3.1, P=0.052), but dependent on nesting habitat (F2, 95=3.7, P= 0.028).
Emergence success decreased from the open sand (66.1 ± 30.8%, range: 0.0 – 100%, n=62), to the forest border (51.9 ± 38.3 %, range: 0.0 – 98.2%, n=20), to the forest habitat (42.2 ± 41.6%, range: 0.0 – 96.2%, n=16). It should be noted that nests in this study were relatively protected from the destructive action of nesting females, such that these parameters may be slightly overestimated.
Sex ratio estimates and hatchling size
We identified the sex of 131 hatchlings from 27 nests, laid from 1 to 22 of September and distributed across the three habitats and the four beach sections (Table S3), with an average of 4.9 ± 0.4 hatchlings per nest. Male hatchlings were significantly larger (4.95 ± 0.19cm, range: 4.44 – 5.33cm, n=83) than females (4.73 ± 0.18cm, range: 4.26 – 5.11cm, n=48, t(95)=-6.542,
P<0.0001). The beginning of the TSP was 2.0 ± 0.7 days later than the start of
the IPmid (range: 0.8 – 3.2 days), and the end of the TSP was 3.3 ± 1.1 days later than the end of the IPmid (range: 2 – 5 days). Thus, the mean length of the TSP was highly coincident with the mean length of the IPmid (differing only by 1.3 ± 0.6 days), justifying the use of the 18-day average to predict the
incubation temperature felt by clutches during the critical period of gonad differentiation. Additionally, the resulting difference in mean incubation
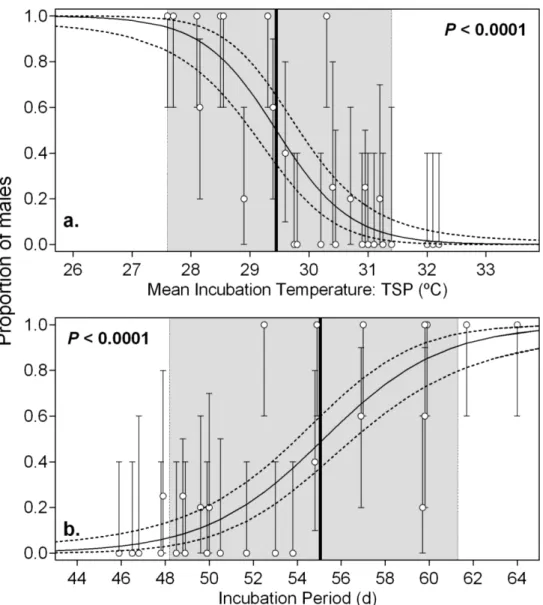
temperatures between the TSP and the IPmid was negligible; 0.3 ± 0.1ºC (range: 0.0 – 0.5ºC). All three covariates: i) IPmid mean incubation temperature, ii) TSP mean incubation temperature, and iii) IP (to hatching) were significantly
correlated with expected sex ratio; P<0.0001. We used the logistic equation
with TSP mean temperatures as the independent variable to estimate sex ratios across habitats and nesting seasons, as this model had smaller residual
44
45 Discussion
We report here the first field-based estimates of primary sex ratio, pivotal temperature and transitional range of temperatures (TRT), from one of the major green turtle nesting rookeries worldwide, and the largest in the Southern Atlantic DPS (Seminoff et al. 2015, Fig. 6). We found temporal and spatial heterogeneity in incubation conditions, leading to variation in estimated sex ratios, but an overall balanced primary sex ratio when the entire nesting season was considered. These estimates diverge from the primarily reported female-biased hatchling sex ratios at most rookeries. Our site-specific sex ratio curve enabled us to generate robust population-specific estimates, and can be applied for future monitoring of climate change impacts on the primary sex ratio.
Insights gained from this work have broad application for the conservation management of sea turtle nesting habitats, and will specifically inform local decision makers towards an improved management of the marine protected area (MPA) of João Vieira and Poilão. We recommend conservation actions, and highlight a way forward to more fully understand the full scope of population resilience to climate change, and its potential for adaptation.
Population-specific pivotal temperature and TRT
46
laboratory-derived curves are applied to infer primary sex ratios in the wild. However, because these curves rely on a small number of clutches (2-4
clutches; Mrosovsky 1988, Godfrey et al. 1999, Mrosovsky et al. 2002, Godfrey & Mrosovsky 2006), that are exposed to less variable incubation conditions than those in the nesting beach, they have resulted in steep logistic curves with narrow TRTs, which may not reflect the real population variability and resilience. Here we estimated a TRT of 3.8ºC, suggesting that even with substantial
increases in incubation temperatures, as predicted by the Intergovernmental Panel on Climate Change (i.e. 2-3ºC; Stocker et al. 2013) some nests would continue to produce males.
Within-population variability in primary sex ratio response
We found inter-clutch variation on the sex ratio response to mean incubation temperatures and to incubation period, similar to other field studies (Spotila et al. 1987, Godfrey & Mrosovsky 1997, Mrosovsky et al. 1999, Godley et al. 2002, King et al. 2013, Wyneken & Lolavar 2015). Such variation has been attributed to the effect of fluctuating temperatures in embryos’ development (Girondot et al. 2010). However, this should not be the case here, as we accounted for the embryo thermal reaction norm to estimate the beginning and end of the TSP (Girondot & Kaska 2014). Interestingly, these were mostly coincident with the middle third of incubation, which normally is expected under constant
temperature environments (Bull 1983), possibly due to the buffering effect against sudden temperature changes facilitated by the depth of the green turtle nests (Kaska et al. 1998). Both the spatial variation in incubation temperatures within clutches (<1ºC, decreasing from the top to the bottom; Kaska et al. 1998, Booth & Astill 2001), and our small sample size (inherent to studies involving lethal sampling of hatchlings), may contribute to some of the variation, but are unlikely to explain more atypical observations (e.g. 100% males under a TSP mean incubation temperature of 30.3ºC). Heritability, on the other hand, could be a more reasonable explanation, as similar within-population divergence is seen under constant incubation conditions (Bull et al. 1982, Mrosovsky 1988). Alternatively, overlooked environmental parameters could be influencing hatchling sex. Recently, moisture was shown to override the effect of
47
expected (Wyneken & Lolavar 2015). Relative humidity is likely an important attribute of nests at Poilão, given the coincidence between the nesting and the rainy seasons. Moreover, the groundwater level after heavy rain episodes or spring tides is sufficiently high, that accumulated water can be seen inside abandoned nest chambers and body pits at areas with low elevation.
Interestingly, the atypical nest mentioned above, with 100% males at feminizing incubation temperatures, was very close to the high tide line (~1m). An
interaction between the effects of humidity and those of heritability, on the mechanisms of TSD, may be driving the observed variation within the TRT. Most important, both the variability in sex ratio response to incubation
temperatures, and the wide TRT, are suggestive of resilience and potential for adaptation to climate change. It should be noted that the observed variation is not expected to bias sex ratio estimations, as the atypical values (i.e. more males than predicted under ‘female-biased’ temperatures, and vice versa), to some extent, cancelled each other out, because incubation temperatures during the TSP are fairly evenly distributed above and below the pivotal temperature at Poilão (Mrosovsky et al. 1999).
48
The heterogeneity found here, across space and time, suggests that nesting females at Poilão may very well be capable of adaptation through phenotypic plasticity, if air temperatures and/or changes in precipitation lead to unfavorable incubation conditions. For example, in the future, females may adjust the start of the nesting season, to have peak activity coinciding with the colder months (December and January). This would enhance male hatchling production, and clutch survival, under future global warming scenarios, as extremely high incubation temperatures induce hatchling mortality (Godley et al. 2001c,
Santidrián Tomillo et al. 2014, Hays et al. 2017). Changes in nesting phenology in response to climate change have been reported, however it remains unclear whether the start of nesting is triggered by the sea surface temperatures at breeding sites (Weishampel et al. 2004), or at foraging grounds (Mazaris et al. 2009). Additionally, other aspects influence sea turtle reproductive phenology, such as availability of food and energy allocated for reproduction (Broderick et al. 2001b), making predictions of phenological adaptations to climate change a challenge. Another possible way for females to adapt would be through nest-site selection, as some TSD species seem to adjust their nesting nest-site to achieve optimal thermal conditions (Doody et al. 2006, Mitchell et al. 2013), although others have displayed behaviors that increased, rather than minimize, their vulnerability to warmer temperatures (Telemeco et al. 2017). Interestingly, individual inter-annual consistence in nest-site selection has been observed in sea turtles (Kamel & Mrosovsky 2006b). This provides scope for natural
selection to occur, as females choosing to nest at cooler sites will probably have enhanced fitness under future global warming scenarios (Hays et al. 2017). There may be a trade-off however, between improved thermal conditions and reduced emergence success, as we found the latter to be significantly lower at the vegetated area, likely a consequence of the presence of roots entangling hatchlings, as is frequently observed upon nest excavations.
Primary sex ratio and implications for breeding sex ratio
Overall we estimated a balanced seasonal primary sex ratio. This may imply a male-biased operational (breeding) sex ratio (OSR) for the green turtle