Green turtles (
Chelonia mydas
) foraging at Arvoredo Island in Southern
Brazil: Genetic characterization and mixed stock analysis through mtDNA
control region haplotypes
Maíra Carneiro Proietti
1, Paula Lara-Ruiz
2, Júlia Wiener Reisser
1, Luciano da Silva Pinto
3,
Odir Antonio Dellagostin
3and Luis Fernando Marins
41
Programa de Pós-Graduação em Oceanografia Biológica, Universidade Federal do Rio Grande,
Rio Grande, RS, Brazil.
2
Grupo de Identificación, Unidad de Especies Silvestres, Instituto de Genética,
Universidad Nacional de Colombia, Ciudad Universitaria, Bogotá, Colombia.
3Centro de Biotecnologia, Universidade Federal de Pelotas, Campus Universitário, Pelotas, RS, Brazil.
4Departamento de Ciências Fisiológicas, Universidade Federal do Rio Grande, Rio Grande, RS, Brazil.
Abstract
We analyzed mtDNA control region sequences of green turtles (Chelonia mydas) from Arvoredo Island, a foraging ground in southern Brazil, and identified eight haplotypes. Of these, CM-A8 (64%) and CM-A5 (22%) were dominant, the remainder presenting low frequencies (< 5%). Haplotype (h) and nucleotide (p) diversities were 0.5570±0.0697 and 0.0021±0.0016, respectively. Exact tests of differentiation and AMOVAF
STpairwise values between the study
area and eight other Atlantic foraging grounds revealed significant differences in most areas, except Ubatuba and Rocas/Noronha, in Brazil (p > 0.05). Mixed Stock Analysis, incorporating eleven Atlantic and one Mediterranean rookery as possible sources of individuals, indicated Ascension and Aves islands as the main contributing stocks to the Arvoredo aggregation (68.01% and 22.96%, respectively). These results demonstrate the extensive relation-ships between Arvoredo Island and other Atlantic foraging and breeding areas. Such an understanding provides a framework for establishing adequate management and conservation strategies for this endangered species.
Key words:foraging grounds, genetic diversity, green turtle, mtDNA haplotypes, natal origins.
Received: September 22, 2008; Accepted: April 22, 2009.
The green turtle (Chelonia mydas) is a marine reptile of worldwide tropical and subtropical distribution, cur-rently classified by the World Conservation Unit as endan-gered (IUCN, 2007). These animals present complex and long life histories, together with a highly migratory behav-iour (Meylan, 1995; Godleyet al., 2003). Due to the large temporal and spatial scales involved, various aspects of their life cycle are quite difficult to elucidate by conven-tional approaches, and must be solved by using indirect re-search methods, such as molecular genetics (Avise, 2007; Bowen and Karl, 2007).
Mitochondrial DNA (mtDNA) control region studies have been increasingly applied to marine turtles, whereby the development of genetic tags for these animals has con-tributed to the acquisition of valuable data on their molecu-lar evolution, population structure, reproductive behavior
and migration ecology, besides providing a foundation for conservation and management strategies (Moritz, 1994; Avise, 2007; Bowen and Karl, 2007). In this context, green turtles have emerged as model organisms for such studies (Avise, 2007). These animals forage in “mixed stocks” composed of individuals from several cohorts and from various nesting beaches (rookeries) which aggregate at feeding grounds (Bass and Witzell, 2000; Basset al., 2006; Avise, 2007; Bowen and Karl, 2007). Due to the phylo-patric behaviour of the females of this species, nesting assemblages are genetically structured in terms of mater-nally-inherited characters, thereby permitting the evalua-tion of the natal origins of individuals found in mixed ag-gregations (Bowen, 1995; Bowen and Karl, 2007). The assessment of the genetic composition of mixed aggrega-tions is currently one of the research priorities for this spe-cies (Formiaet al., 2006). This, together with the determi-nation of the relationships among foraging and breeding populations of sea turtles, are essential for constituting se-cure guide lines in the development of successful conserva-tion strategies for these endangered animals.
www.sbg.org.br
Send correspondence to M.C. Proietti. Programa de Pós-Gradua-ção em Oceanografia Biológica, Universidade Federal do Rio Grande, Avenida Itália km 8, 96200-300 Rio Grande, RS, Brazil. E-mail [email protected].
Sampling was undertaken at Arvoredo Island, located within the Arvoredo Marine Biological Reserve (27° 17’ S and 48° 22’ W), in July 2005, January-February 2006 and July 2006, at five different sites located on the western and northern parts of the island (Figure 1). Tissue samples were obtained from the flippers of 49 juvenile green turtles hand-captured through free and SCUBA dives, by using 5 mm disposable biopsy punches. The samples were then conserved in absolute ethanol and kept at -20 °C. Curved carapace length and the weight of sampled individuals ranged from 35 to 72.5 cm (mean 52 cm) and 7.5 to 45 kg (mean 19.9 kg), respectively.
DNA extraction was performed through the standard phenol:chlorophorm method with precipitation in absolute ethanol (Hilliset al., 1996). Control region fragments were amplified via polymerase chain reactions (PCR) using the primers LTCM1 and HDCM1 (Allardet al., 1994), under the following conditions: initial denaturation of 1 min at 94 °C, 35 cycles of 30 s at 94 °C, 1 min at 50 °C, 1 min at 72 °C, and a final 5 min extension at 72 °C. Products were purified using Illustra GFX purification kits (GE Health-care, U.S.A.), and sequenced in both directions using DYEnamic ET dye terminator kits in a MegaBACE 500 DNA sequencer (GE Healthcare, U.S.A.).
Sequences (491 bp) were aligned by means of Clustal X 1.83 software (Thompsonet al., 1997), and haplotypes classified according to the Archie Carr Center for Sea
Tur-tle Research online genetic bank (Florida University). A minimum spanning network demonstrating relationships among haplotypes was set up using TCS 1.3 software (Clementet al., 2000). Exact tests of differentiation be-tween Arvoredo Island and other Atlantic foraging grounds were carried out with Arlequin 3.11 (Excoffieret al., 2005), using Markov Chain Monte Carlo (MCMC) of 10000 per-mutations with 1000 dememorization steps. Pairwise F
-statistics (FST, which summarizes the degree of
differentia-tion between populadifferentia-tions) were checked through Analysis of Molecular Variance (AMOVA) conducted with 10000 permutations with Arlequin 3.11, according to the Tamu-ra-Nei model of nucleotide substitution. The Brazilian for-aging grounds included in these analyses for comparison were Ubatuba (SP), Almofala (CE) (Naro-Macielet al., 2007), Rocas Atoll (RN) and Fernando de Noronha (PE) (Bjorndalet al., 2006). The latter two were grouped into one single unit for all analyses, due to geographic proximity (c.a. 150 km) and small sample size, being hereafter re-ferred to as Rocas/Noronha. Nicaragua (Basset al., 1998), Barbados (Lukeet al., 2004), Bahamas (Lahanas et al., 1998), Florida (Bass and Witzell 2000) and North Carolina (Basset al., 2006), in the Caribbean and North Atlantic, were also included for comparison. Structuring between foraging areas grouped into North and South Atlantic ag-gregations was checked through AMOVA.
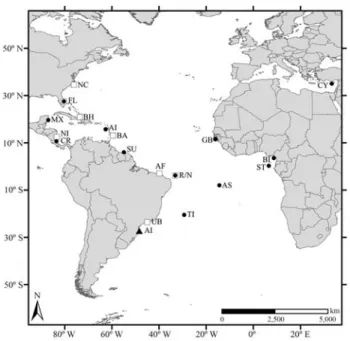
Probable natal origins were defined through Mixed Stock Analysis (MSA) employing Bayes software (Pella and Masuda, 2001), and considering equal prior probabili-ties assigned to each source. Source populations employed as possible contributors to the Arvoredo Island group corre-spond to all the Atlantic and Mediterranean rookeries de-scribed in literature by Bjorndalet al.(2005, 2006), Formia
et al. (2006, 2007), Encalada et al. (1996) and Kaska
(2000), namely, Trindade Island and Rocas/Noronha (Bra-zil), Ascension Island (United Kingdom), Poilão (Guinea Bissau), Bioko Island (Equatorial Guinea), São Tomé (De-mocratic Republic of São Tomé and Príncipe), Aves Island (Venezuela), Matapica (Surinam), Quintana Roo (Mexico), Tortuguero (Costa Rica), Florida (United States) and Lara Bay (Cyprus). Principe (Democratic Republic of São Tomé and Príncipe) was excluded from this analysis due to the small size of the sample.
We encountered eight polymorphic sites which de-fined eight previously described Atlantic Ocean haplo-types. The predominant haplotype was CM-A8 (64%), commonly found in South Atlantic rookeries, followed by CM-A5 (22%), mainly found in the Costa Rica, Surinam and Aves Island rookeries. The remaining haplotypes were relatively rare, with less than 5% frequency. To date, CM-A9 (2%), CM-A24 (4%) and CM-A32 (2%) have only been observed in the South Atlantic rookeries of Rocas Atoll, Trindade and Ascension Island, whereas CM-A10 (2%) has been found in Rocas Atoll and Ascension Island. CM-A39 (2%), previously unregistered in foraging areas, and
A45 (2%), with only one register in feeding grounds, have been described only in animals from the Ascension Island rookery. Haplotypes were distinguished by a maximum of two variations, as shown in the Minimum Spanning Net-work (Figure 2).
Haplotype (h) and nucleotide (p) diversity estimates
encountered for the study area were 0.5570±0.0697 and
0.0021±0.0016, respectively. Diversity estimates for
Ar-voredo Island and other Atlantic foraging grounds are listed in Table 1. Exact tests of differentiation based on haplotype frequencies demonstrated general differentiation among all feeding areas (p = 0.000). According to these tests, Ar-voredo Island was significantly different from most
forag-ing areas, with the exception of Ubatuba and Rocas/No-ronha in Brazil (p = 0.4776 and 0.3077, respectively). Simi-lar results were inferred from AMOVA (p = 0.1292 and 0.6261). By grouping foraging aggregations into North and South Atlantic and using AMOVA, strong structuring was revealed (FST= 0.6913 p < 0.01). From MSA, it was
indi-cated that Ascension and Aves Islands are the main contri-butors to the Arvoredo aggregation, with lesser contribu-tions from Guinea Bissau and Trindade Island, as shown in Table 2.
High CM-A8 frequency in the study area is in accor-dance with the predominance of this haplotype in various nesting and feeding areas in the Atlantic, and is consistent with the suggestion of it being the closest relative to an an-cestral haplotype in the Atlantic basin. Haplotype CM-A5 was the second most frequent, as was noted in other south Atlantic feeding grounds, and in accordance with its high frequency in large Caribbean rookeries (Bjorndal et al., 2005, 2006; Formiaet al., 2006, 2007; Naro-Macielet al., 2007). Elevatedhvalues are found in most green turtle for-aging areas, as expected when considering that these aggre-gations are composed of mixed stocks (Bass and Witzell, 2000). Lowpvalues were also expected due to the slight
variation observed between haplotypes.
The distribution of haplotypes among foraging grounds is apparently non-random, with significant differ-entiation among individual areas and strong structuring between North and South Atlantic aggregations. The life history patterns of sea turtles may account for such structur-ing, with the pelagic stage determining the areas to which these animals will recruit, possibly at the whim of ocean currents (Musick and Limpus, 1997; Luschiet al., 2003). Arvoredo Island was not significantly different from the closest genetically-described southwestern Atlantic forag-ing ground, Ubatuba (ca. 755 km), thereby indicatforag-ing that foraging areas can present similarity in mtDNA at small spatial scales. Such a hypothesis is corroborated by
Al-Figure 2- Minimum spanning network of mtDNA control region relation-ships encountered at Arvoredo Island. Hash lines represent 1 basepair sub-stitution between haplotypes.
Table 1- Haplotype (h) and nucleotide (p) diversity estimates±standard deviations for all compared foraging aggregations.
Foraging ground Haplotypes h p Sample size
Arvoredo Island 8 0.5570±0.0697 0.0021±0.0016 49
Ubatubaa 10
0.4460±0.0556 0.0020±0.0015 113
Rocas/Noronhab 6
0.5887±0.0911 0.0019±0.0015 32
Almofalaa 13
0.7168±0.0306 0.0067±0.0039 117
Barbadosc 8
0.7734±0.0276 0.0105±0.0057 60
Bahamasd 6
0.3703±0.0650 0.0066±0.0038 79
Nicaraguae 2
0.1831±0.0621 0.0039±0.0025 60
Floridaf 6
0.4855±0.0668 0.0032±0.0021 62
North Carolinag 8
0.6778±0.0310 0.0052±0.0031 106
Average 7 0.5334 0.0040 68
aNaro-Maciel
et al.2007.bBjorndal
et al.2006.cLuke
et al.1994.dLahanas
et al.1998.eBass
et al.1998.fBass and Witzell 2000.gBass
mofala, the most distant southwestern Atlantic foraging ground from Arvoredo Island (ca. 3800 km), being signifi-cantly different from the study area. This difference could also be due to its proximity to the Caribbean region, with its strong structuring within the Atlantic Ocean (Basset al.
2006). The similarity observed between relatively close feeding grounds could possibly be attributed to movements along the coast, which may be influenced by factors such as current intensity, variations in temperature, food availabil-ity and continuous recruitment to coastal zones (Basset al., 2006). Despite many animals presenting high fidelity to foraging areas, it is known that non-reproductive costal movements of juvenile green turtles may occur (Godleyet al., 2003; Basset al., 2006), the geographic nearness of the areas and major coastal currents also possibly constituting important factors in these movements. Green turtles present at least short-term fidelity to Arvoredo Island, as demon-strated by various recaptures over a three-year study period (Reisseret al., 2008). Nevertheless, one animal tagged in
the area was encountered six months later by members of Project Tamar-ICMBio, stranded at Caraguatatuba in São Paulo state, over 700 km away, thus giving evidence of non-reproductive migration in coastal waters. Migration between São Paulo and southern Brazil has also been ob-served by Marcovaldiet al.(2000), in which a green turtle, initially tagged at Ubatuba, was recaptured three months later in Bombinhas, SC, only 10 km from Arvoredo Island.
As was the case for other south Atlantic foraging ar-eas (Bjorndalet al., 2006; Naro- Macielet al., 2007), the main stock contributing to the Arvoredo aggregation longs to Ascension Island. Green turtle movements be-tween Ascension and Brazil have often been noted through mark-recapture and telemetry studies (Meylan, 1995,
Lus-chiet al., 1998, Hayset al., 2002). The large nesting
popu-lation (the second largest in the Atlantic, with
approximately 3800 females nesting annually; Brodericket al., 2006) and favorable ocean currents are the most proba-ble explanations for such a high contribution. The second largest contributor was Aves Island, although there is a lack of tagging evidence on migrations to-and-from Brazil. However, the relatively large rookery size (300-500 fe-males nesting annually; Seminoff, 2002), and the strong link between Caribbean rookeries and Brazilian foraging grounds, as demonstrated by Limaet al., (2008), give sup-port to this conclusion. The connection between African rookeries and Brazilian foraging grounds is not evident, possibly due to the limited number of studies dealing with the African continent. Estimates inferred from MSA indi-cated that African contributions as a whole to Arvoredo Is-land were generally low, although those from Guinea Bissau and Bioko were relatively high compared to other African nesting areas. Naro-Macielet al.(2007) also ob-served a relatively high contribution from Guinea Bissau to Ubatuba. This could be a consequence of the fixed charac-teristics of this area for the commonly found haplotype CM-08 (Formiaet al., 2006), which could have affected MSA estimates. Bioko also presents a high frequency of haplotype CM-08 (90%), also possibly interfering with the analysis. The contribution from Trindade Island is appar-ently underestimated when considering that this island sup-ports the largest nesting area in Brazil (approximately 300-400 females during the last nesting season - Soares LS, personal communication to PLR), and is the nearest rook-ery to the study area (ca. 2100 km). Furthermore, numerous recaptures of green turtles tagged in this area have been reg-istered along the Brazilian coast (Marcovaldiet al., 2000). Low estimated contributions from Trindade Island have also been registered for the previously cited mixed stocks described in Brazil (Almofala, Ubatuba, Rocas/Noronha). However, in a recent study by Bolker et al. (2007), a
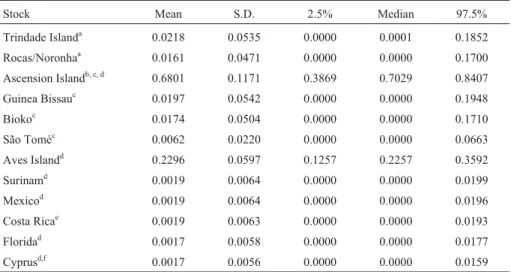
Table 2- Mixed stock analysis based on Bayesian methods considering equal priors, with mean, standard deviation (S.D.), 2.5% quantile, median and 97.5% quantile.
Stock Mean S.D. 2.5% Median 97.5%
Trindade Islanda 0.0218 0.0535 0.0000 0.0001 0.1852
Rocas/Noronhaa 0.0161 0.0471 0.0000 0.0000 0.1700
Ascension Islandb, c, d 0.6801 0.1171 0.3869 0.7029 0.8407
Guinea Bissauc 0.0197 0.0542 0.0000 0.0000 0.1948
Biokoc 0.0174 0.0504 0.0000 0.0000 0.1710
São Toméc 0.0062 0.0220 0.0000 0.0000 0.0663
Aves Islandd 0.2296 0.0597 0.1257 0.2257 0.3592
Surinamd 0.0019 0.0064 0.0000 0.0000 0.0199
Mexicod 0.0019 0.0064 0.0000 0.0000 0.0196
Costa Ricae 0.0019 0.0063 0.0000 0.0000 0.0193
Floridad 0.0017 0.0058 0.0000 0.0000 0.0177
Cyprusd,f 0.0017 0.0056 0.0000 0.0000 0.0159
‘many-to-many’ MSA approach with the incorporation of multiple mixed stocks gave evidence of higher contribu-tions from Trindade Island to northeastern Brazil than those previously published. This could corroborate the hypothe-sis that Trindade’s contribution to the study area is underes-timated. Nonetheless, further investigation is necessary to clarify this.
The assumption that all sources and all mixtures are well described is a great problem with MSA, since this is not always the case. The presence of foraging ground haplotypes which have not been described at nesting areas clearly indi-cates that some rookeries may be inadequately described or not even at all, as was noted by Basset al.(2006), Formiaet al.(2007) and Naro-Macielet al.(2007). Furthermore, ha-plotypes being encountered in rookeries but not in foraging areas demonstrates insufficient research at feeding grounds. Therefore, this analysis should be interpreted together with all available evidence (i.e.demographic, ecological, and mo-lecular), in order to reach conclusive information on the life history patterns of sea turtles.
Describing the genetic characteristics of juvenile green turtle foraging grounds and defining their relation-ship with other feeding and breeding grounds provide a framework for successfully conserving and managing this species. The extensive Brazilian coastline and oceanic is-lands harbor countless foraging grounds, besides three rookeries of which two are relatively large, thereby urging investigation and protection for conservation purposes. Im-pacts affecting foraging areas may also influence distant rookeries. Thus, the protection of feeding zones could be a big step towards the protection of their contributing stocks. The distribution and migrations of green turtles surpass na-tional boundaries, wherefore urging nana-tional and interna-tional efforts and cooperation is essential for assuring the survival of this species.
Acknowledgments
We thank Pata da Cobra Diving and the Brazilian Navy for logistic support in expeditions. We also thank Projeto Tamar-ICMBIO for partnership, in particular Alice Grossman and Pablo Mendonça for training in field work. We acknowledge all involved in biological sampling, be-sides Liane Artico for generous laboratorial aid and Tiago Gandra for map design. The authors have received financial support from the Conselho Nacional de Pesquisa (CNPq -Brazil), Rufford Small Grants (RSG - UK) and The People’s Trust for Endangered Species (PTES - UK). This work was licensed by Instituto Chico Mendes para Conservação da Biodiversidade (ICMBio), authorization #13334-1.
References
Allard MW, Miyamoto MM, Bjorndal KA, Bolten AB and Bowen BW (1994) Support for natal homing in green turtles from mitochondrial DNA sequences. Copeia 1994:34-41.
Avise JC (2007) Conservation genetics of marine turtles - Ten years later. In: Hewitt D and Fulbright T (eds) Frontiers in Wildlife Science: Linking Ecological Theory and Manage-ment Applications. CRC Press, Boca Raton, pp 295-314. Bass AL, Lagueux CJ and Bowen BW (1998) Origin of green
tur-tles,Chelonia mydas, at ``Sleeping Rocks’’ off the northeast coast of Nicaragua. Copeia 1998:1064-1069.
Bass AL and Witzell WN (2000) Demographic composition of immature green turtles (Chelonia mydas) from the east cen-tral Florida coast: Evidence from mtDNA markers. Herpe-tologica 56:357-367.
Bass AL, Epperly SP and Braun-Mcneill J (2006) Green Turtle (Chelonia mydas) foraging and nesting aggregations in the Caribbean and Atlantic: Impact of currents and behavior on dispersal. J Hered 97:346-354.
Bjorndal KA, Bolten AB and Troeng S (2005) Population struc-ture and genetic diversity in green turtles nesting at Tortu-guero, Costa Rica, based on mitochondrial DNA control re-gion sequences. Mar Biol 147:1449-1457.
Bjorndal KA, Bolten AB, Moreira L, Bellini C and Marcovaldi MA (2006) Population structure and diversity of Brazilian green turtle rookeries based on mitochondrial DNA se-quences. Chelonian Conserv Biol 5:262-268.
Bolker BM, Okuyama T, Bjorndal KA and Bolten AB (2007) In-corporating multiple mixed stocks in mixed stock analysis: ‘Many-to-many’ analyses. Mol Ecol 16:685-695.
Bowen BW (1995) Tracking marine turtles with genetic markers -Voyages of the ancient mariners. Bioscience 45:528-534. Bowen BW and Karl SA (2007) Population genetics and
phylo-geography of sea turtles. Mol Ecol 16:4886-4907.
Broderick AC, Frauenstein R, Glen F, Hays GC, Jackson AL, Pelembe T, Ruxton GD and Godley BJ (2006) Are green tur-tles globally endangered? Global Ecol Biogeogr 35:21-26. Clement M, Posada D and Crandall K (2000) TCS: A computer
program to estimate gene genealogies. Mol Ecol 9:1657-1660.
Encalada SE, Lahanas PN, Bjorndal KA, Bolten AB, Miyamoto MM and Bowen BW (1996) Phylogeography and popula-tion structure of the Atlantic and Mediterranean green turtle
Chelonia mydas: A mitochondrial DNA control region se-quence assessment. Mol Ecol 5:473-483.
Excoffier L, Laval G and Schneider S (2005) Arlequin ver. 3.0: An integrated software package for population genetics data analysis. Evol Bioinform Online 1:47-50.
Formia A, Godley BJ, Dontaine J-F and Bruford MW (2006) Mi-tochondrial DNA diversity and phylogeography of endan-gered green turtle (Chelonia mydas) populations in Africa. Conserv Genet 7:353-369.
Formia A, Broderick AC, Glen F, Godley BJ, Hays GC and Bruford MW (2007) Genetic composition of the Ascension Island green turtle rookery based on mitochondrial DNA: Implications for sampling and diversity. Endang Species Res 3:145-158.
Godley BJ, Lima EHSM, Åkesson S, Broderick AC, Glen F, Godfrey MH, Luschi P and Hays GC (2003) Movement pat-terns of green turtles in Brazilian coastal waters described by satellite tracking and flipper tracking. Mar Ecol Prog Ser 253:271-288.
Hillis D, Mable BK, Larson A, Davis SK and Zimmer EA (1996) Nucleic acids IV: Sequencing and cloning. In: Hillis DM, Moritz C and Mable BK (eds) Molecular Systematics. 2nd edition. Sinauer Associates, Sunderland, pp 321-381. Kaska Y (2000) Genetic structure of Mediterranean sea turtle
pop-ulations. Turk J Zool 24:191-197.
Lahanas PN, Bjorndal KA, Bolten AB, Encalada SE, Miyamoto MM, Valverde RA and Bowen BW (1998) Genetic compo-sition of a green turtle (Chelonia mydas) feeding ground population: Evidence for multiple origins. Mar Biol 130:345-352.
Lima EHSM, Melo MTD, Severo MM and Barata PCR (2008) Green Turtle tag recovery further links Northern Brazil to the Caribbean region. Mar Turtle Newsl 119:14-15. Luke K, Horrocks JA, LeRoux RA and Dutton PH (2004) Origins
of green turtle (Chelonia mydas) feeding aggregations around Barbados, West Indies. Mar Biol 144:799-805. Luschi P, Hays GC, Del Seppia C, Marsh R and Papi F (1998) The
navigational feats of green sea turtles migrating from Ascen-sion Island investigated by satellite telemetry. Proc R Soc Lond B 265:2279-2284.
Luschi P, Hays GC and Papi F (2003) A review of long-distance movements by marine turtles, and the possible role of ocean currents. Oikos 103:293-302.
Marcovaldi MA, da Silva ACCD, Gallo BMG, Baptistotte C, Lima EP, Bellini C, Lima EHSM, de Castilhos JC, Thome JCA and Moreira LM de P (2000) Recaptures of tagged tur-tles from nesting and feeding grounds protected by Projeto Tamar-Ibama, Brazil. In: Kalb HJ and Wibbels T (eds) Proc. 19th Ann Symp Sea Turtle Biol Cons NOAA Technical Memorandum NMFS-SEFSC 443:164-166.
Meylan PA (1995) Sea turtle migration - Evidence from tag re-turns. In: Bjorndal KA (ed) Biology and Conservation of Sea Turtles. Revised edition. Smithsonian Institution Press, Washington DC, pp 91-100.
Moritz C (1994) Applications of mitochondrial DNA analysis on conservation: A critical review. Mol Ecol 3:401-411. Musick JA and Limpus CJ (1997) Habitat utilization and
migra-tion in juvenile sea turtles. In: Lutz PL and Musick JA (eds) The Biology of Sea Turtles. CRC Press, Boca Raton, pp 137-163.
Naro-Maciel E, Becker JH, Lima EHSM, Marcovaldi MA and Desalle R (2007) Testing dispersal hypotheses in foraging green sea turtles (Chelonia mydas) of Brazil. J Hered 98:29-39.
Pella J and Masuda M (2001) Bayesian methods for analysis of stock mixtures from genetic characters. Fish Bull 9:151-167. Reisser JR, Proietti MC, Kinas PG and Sazima I (2008) Photo-graphic identification of sea turtles: Method description and validation, with an estimation of tag loss. Endang Species Res 5:73-82.
Seminoff JA (2002) 2002 IUCN red list global status assessment: Green turtle (Chelonia mydas). IUCN/SSC Marine Turtle Specialist Group, Gland, 87 pp.
Thompson JD, Gibson TJ, Plewniak F, Jeanmougin F and Higgins DG (1997) The ClustalX windows interface: Flexible strate-gies for multiple sequence alignment aided by quality analy-sis tools. Nucleic Acids Res 25:4876-4882.
Internet Resources
Archie Carr Center for Sea Turtle Research genetic bank, http://accstr.ufl.edu/cmmtdna.html. Accessed on May 5th
2008.
IUCN red list of threatened species, http://www.iucnredlist.org. Accessed on June 18th2009.
Associate Editor: João S. Morgante