© 2020 The Author(s)
This work is licensed under the Creative Commons Attribution 4.0 International (CC BY 4.0). To
Destination image perceived by domestic tourists:
The influence of Generation Gap
Cláudia Seabra
1*, Andreia Pereira
2, Carla Silva
2,
José Luís Abrantes
2, Manuel Reis
2and Odete Paiva
21 University of Coimbra, Faculty of Arts & Humanities; Centre of Studies in Geography and Spatial Planning
(CEGOT); CI&DETS - Centre for the Study of Education, Technologies and Health; NOVASBE - Nova School of Business and Economics; Colégio de S. Jerónimo, Largo da Porta Férrea, 3004-530 Coimbra, Portugal. E-mail: [email protected]
2 Polytechnic Institute of Viseu, School of Technology and Management; CI&DETS - Centre for the Study of
Education, Technologies and Health; CISeD – Research Centre in Digital Services, Polytechnic of Viseu, Portugal.
E-mails: [email protected]; [email protected]; [email protected]; [email protected];
*Corresponding author
Abstract
The first type of tourism was essentially domestic. However, tourist activities have become a major trend lately, particularly in some locations. According to UNWTO (2016), domestic tourism involves an estimated volume of 5 to 6 billion tourists across the whole world. As a result, some destinations consider it imperative to promote and develop domestic tourism, since it represents an important input to local and national economy. Notwithstanding these facts, most actions taken and research conducted focus on international tourists.
An empirical study involving 622 domestic tourists reveals that the main cognitive destination image dimensions are Simplicity and Authenticity, Good Environment, Relaxation and Socialization, Good Infrastructures, Nostalgia and History and Culture. Regarding the affective attributes, most tourists in the sample have strong positive feelings regarding the visited destination. In addition, results prove that those tourists’ generational differences influence the way they build the cognitive and affective images of a certain destination. The discussion focuses on the kind of implications tourism destinations may have for Management and Marketing.
Keywords: Domestic Tourism; Destination Image; Cognitive Image; Affective Image; Generation Gap Citation: Seabra, C., Pereira, A., Silva, C., Abrantes, J.L., Reis, M. and Paiva, O. (2020). Destination image perceived by domestic tourists: Тhe influence of Generation Gap. European Journal of Tourism Research 25, 2506.
Introduction
Domestic tourism involves the activities of resident visitors within the country of reference alone (UNWTO, 1994). This is an important segment within the tourism industry which accounts for over 70% of total tourist flow and represents 74% of total arrivals and 73% of total overnight stays (Stylidis, Belhassen & Shani, 2017). Despite its contribution to national economies and in spite of being one of the most ancient forms of tourism (Pierret 2011), domestic tourism is one of the most neglected forms of tourism in the literature (Stylidis et al., 2017). Despite the development of research conducted on domestic tourism (Bonn, Joseph & Dai, 2005; Canavan, 2013; Mutinda & Mayaka, 2012; Singh & Krakover, 2015; Stylidis et al., 2017; Yang, Liu & Qi, 2014), empirical research dealing with the factors that influence domestic tourists’ consumption behaviours is still quite scarce.
The assumption that the understanding of the tourists’ behaviours is generic or, in other words, that international and domestic tourists have similar behaviour patterns is quite problematic (Stylidis et al., 2017). As far as destination image formation is concerned for instance, there may be major differences between national and international tourists. International tourists often have vague and unclear perceptions about different destinations based on their own personal knowledge and on details provided by common sources of tourist information, such as advertising and the media (Govers, Go, & Kumar, 2007). Domestic tourists, on the other hand, know more about the destination, are more familiar with the places and with what they have to offer. This acquired knowledge make their destination image more complex and multifaceted (Stylidis et al., 2017).
The image tourists have of a given destination is one of the main challenges referred in current research (Nicoletta & Servidio, 2012) and its influence on tourists’ behaviour is constantly highlighted throughout tourism research literature (Beerli & Martín, 2004; Chang, Stylos, Yeh & Tung, 2014; Chen, Lai, Petrick & Lin, 2016; Pike, 2008; Stylos, Bellou, Andronikidis & Vassiliadis, 2017; Tseng, Wu, Morrison, Zhang & Chen, 2015). The importance of the perceived image in tourists’ decision-making process and behaviour is consensual (Lee & Lee, 2009; Lu, Chi & Liu, 2015; Nadeau, Heslop, O'Reilly, & Luk, 2008).
Studies dealing with domestic tourism and that analyse the correlation between destination image perceptions and tourists’ actions are still scarce (Stylidis et al., 2017), since domestic flows are very difficult to quantify (Turner & Reisinger, 2001). However, it is a crucial field of research since the features of a given location will directly influence tourists’ destination image (Bonn et al., 2005). Analyzing the perceived destination image from a domestic tourist’s perspective may add attributes that are surely different from those valued by international tourists. Domestic tourists know more about the destination and have a higher level of familiarity with that specific location (Stylidis et al., 2017). In general, international tourists’ perceived image is based on their own personal knowledge and on the most common sources of tourist information (Govers et al., 2007).
Tourists’ identity, cultural background, social, personal and psychological characteristics mediate the formation of the perceived destination image (Govers & Go, 2005). In addition, individual characteristics or internal factors will substantially affect that image formation (Ashworth & Voogd, 1990). Personal factors such as sociodemographic characteristics will have the same influence (Beerli & Martin, 2004). The tourists’ age or their generational group are also important factors that will undoubtedly have a strong effect on their behaviours (Gardiner, Grace, & King, 2014; Rivera, Semrad, & Croes, 2015).
After an extensive review of the literature on tourism, there was no evidence of any study assessing the impact of generational differences on the way domestic tourists build destination affective and cognitive images. The main purpose of this study is therefore to close this research gap. This study is strongly influenced by the assumptions laid down in The Consumer Behaviour Theories and in the Theory of Reasoned Action (Bray, 2008; Fishbein, 1975). Both studies strive to understand how tourists form a destination image based on their beliefs and feelings and how the effect of belonging to a certain generational group will condition the building of such image. Within this context, this study aims at identifying the cognitive and affective dimensions of destination image perceived by domestic tourists and measuring the influence of the generational differences in its formation.
Drawing on past studies, mainly based on data collected from international tourists, it was developed a cluster analysis based on different generational groups. This analysis was performed using Portuguese domestic tourists who have visited the Center of Portugal. This paper will expand knowledge on consumer behaviour and marketing and specifically on the relationship between destination image and generational differences within a domestic tourism context. The results might help marketers develop marketing and promotion campaigns that will prove useful when they plan actions focusing on this important segment.
Literature Review
Since the first studies in destination image (Gunn, 1972; Hunt, 1975; Mayo and Jarvis, 1981), that has been identified as a complex process that influence tourist behaviour before, during and after visit (Tegegne, Moyle & Becken, 2018) In fact, destination image is a key issue to understand the travel decision-making process (Cherifi, Smith, Maitland & Stevenson, 2018). The way a person pictures a particular tourist site creates an image that sets that destination apart from others significantly affecting the decision-making and planning phases and the tourists’ behaviour and attitudes (Cherifi, Smith, Maitland, & Stevenson, 2014; Jenkins, 1999; Lee & Lee, 2009; Lu et al., 2015; Molina & Esteban, 2006). Destination image plays an important role in potential tourists’ involvement, decision-making and in the level of satisfaction with the travel experience (Chon, 1992; Gursoy, Chen & Chi, 2014; Prayag & Ryan, 2012; Stylos et al., 2017).
It is quite difficult to perceive the image tourists create in their mind when they imagine a certain place, mainly is based on their holistic impressions (Kim, Stylidis & Oh, 2019; Qu, Kim & Im, 2011); nevertheless, it is essential to determine it since it assumes the role of the representative symbol of a destination (Souiden, Ladhari, & Chiadmi, 2017). Given the relevance of the association between destination image and the destination itself, it is vital to understand how the different factors act in this perception construction (Özdemir & Şimşek, 2015; Wang & Hsu, 2010).
Taking into account the Fishbein model that advocates, “a person’s overall attitude toward an object is derived from his beliefs and feelings about various attributes of the object” (Bray, 2008, p.20), it becomes clear that the destination itself has a major influence on tourists’ attitudes and behaviours. Fishbein’s behavioural model known as Theory of Reasoned Action (TRA) (Bray, 2008) states, in a simplistic way, that individual attitudes plus beliefs will affect consumer behaviour (Fishbein, 1963; Fishbein, 1967; Fishbein & Ajzen, 1975; Fishbein, 1980). Hence, individual beliefs and feelings affect tourists’ behaviour.
In order to understand how tourists create an image of a certain destination, the TRA conceptualization approach can be suitable and adjusted. If we consider the object as a destination, it is possible to classify the variables related to tourist image creation. Under those circumstances, a
behaviour influenced by a location will highly depend on the beliefs and conceptions the tourist has about it (Jenkins, 1999). Previous knowledge of a destination and the characteristics related to that location perceived by tourists form the cognitive dimensions of image (Baloglu & Mcleary, 1999). The feelings and affections that tourists have towards a place represent the affective component of such image. Considering the TRA model, the affective image integrates the subjective norms that influence the perceived image and the decision-making process.
The perceived image of a tourist destination is a personal mental construction and is, therefore, quite different from the image created by the other visitors (Sarma, 2007). Despite being the expression of expressive knowledge, impressions, prejudices, imaginations and emotional thoughts individuals might have of a particular place (Lawson & Baud-Bovy, 1977), destination image comes from collective notions that comprise cognitive and evaluative components (Embacher & Buttle, 1989). Hence, destination image appears to be associated with a subjective interpretation of the feelings and beliefs tourists have towards a place (Bigné et al., 2001). In sum, each individual builds a global, variable and holistic impression of a given tourist destination (Kotler & Gartner, 2002).
Burgess (1978) established that most studies have highlighted the physical assets of places. However, the image of a destination is much more complex. The tourist’s overall image is the sum of two dimensions: cognitive and affective (Baloglu & McCleary, 1999; Lu et al., 2015). Perceptual/cognitive assessments refer to beliefs and knowledge about the objective attributes of a destination, while affective evaluation refers to feelings and the destination’s subjective quality (Baloglu, 1999; Genereux, Ward, & Russell, 1983; Pyke & Ryan, 2004). Past research agrees that destination image depends on a cognitive evaluation of the places that will directly influence the individuals’ affective responses (Baloglu & McCleary, 1999; Silva, Kastenholz & Abrantes, 2013). Therefore, destination image is a subjective interpretation of the tourists' beliefs that influences their feelings or their mental representations of a certain place (Bigné et al., 2001).
Generational groups and the influence on destination image formation
The image perceived by individuals is determined by their identity, cultural background, social, personal and psychological characteristics (Govers & Go, 2005) that include sociodemographic factors (Baloglu & McCleary, 1999), such as age (Huang & Petrick, 2010) or in a more concrete way, the generational group in which a person was born. Segmentation based on generations has gained considerable attention in the marketing literature. In fact, it is crucial we analyze the demands and needs of the different generations, since the generational perspective is more homogenous in comparison with others (Rivera et al., 2015). This approach derives from the assumption that the time in which a person was born, the experiences he/she went through and the environmental context in which he/she grew up, particularly during adulthood, will affect his/her behaviour, attitudes and values. In addition, the generational segmentation perspective stems from the idea that the values and behaviour of individuals belonging to different generations will stay relatively constant over the life span of a generation and set them apart from previous and subsequent generations (Pendergast, 2010; Fountain & Lamb, 2011).
The most accepted generational labelling advocates three generations: i) the Baby Boomers generation who is the oldest and includes individuals who were born between 1946 and 1964; ii) Generation X composed by those who were born between 1965 and 1982; and iii) the youngest generation, the so-called Millennials, whose members were born between 1982 and 2004 (Bloomberg News, 2016).
Baby Boomers are those individuals who were born after World War II (Patterson, Sie, Balderas-Cejudo, & Rivera-Hernae, 2017). They represent a generation influenced by Western industry, by new consumer tendencies and fast social changes (Katz, 2017). That context shaped new lifestyles and a rebellious youth culture at that time. These individuals are an example of how sociocultural changes affect behaviours and mentalities. Baby Boomers grew up in a world of fast industrial and technological progress and are frequently part of work contexts that include three and four generations (Perfect Labor Storm, 2016). They are competitive, committed, loyal, materialistic, and strive to achieve self-fulfilment (Devaney, 2015). They do not feel "old" and do not recognize their real age (Forbes, 2014). Their perception of the world, their habits and preferences are not those one would expect from such an age group (Perfect Labor Storm, 2016). Due to the aging of the world’s population, they have become the largest generational group and one of the fastest growing tourist segments (Li, Li, & Hudson, 2013). Baby Boomers or “Silver Hair Tourists”, according to the Tourism Megatrends Report terminology, usually travel with their cohorts or alone, have higher financial power, a good health, less domestic responsibilities and more free time (Horwath, 2015). Boomers try to take advantage of all the pleasures of life (Shevchenko, 2013), so they are curious about trying new things (Creative Marketing Alliance, INC, 2018). Online information sources are not their primary option. Some still maintain traditional habits such as looking for travel agencies to plan their trips. These tourists are usually loyal customers. Generally, they visit the same destination and travel with the same airline companies. On vacation, Baby Boomers want to relax and spend time with their families. “Silver Hair Tourists” have the desire to travel; yet, they have some concerns, like the cost of the trip or issues related with health and safety. In some cases, being in control of the planning of their journeys or being able to solve unexpected problems leads to a sense of self-fulfilment that is quite evident in the way they share their stories. Although they clearly show a preference for familiar places, they show interest in living memorable experiences. Therefore, these features will directly affect their travel choices. It seems that the image of comfort and safety attached to a destination will be more attractive to this group, but, on the other hand, they also seem to favour a certain level of independence and adventure (Patterson et al., 2017).
Generation X are flexible, creative, technologically advanced and entrepreneurial (Devaney, 2015) and they value the power of choice and freedom above anything else (Peratinskaya, 2004). They show greater empathy with the problems that surround them and hold a high intergenerational perception (Poo, 2017). This independence and sensitivity derives from the fact that they have witnessed some of the world’s major events like the collapse of the Soviet Union or the fall of the Berlin Wall (Unglaub & Unglaub, 2012). It is also worth mentioning the changes in the role played by women in society that have led to greater gender equality. Most of Gen X women work while the previous generation had to stay at home and take care of the family (Poo, 2017). As for their consumption profile, Gen X tends to spend more money with others than with themselves. They care about their parents and children. They are a very practical generation and so, they actively look for information before buying new goods, pay attention to the composition of the products, and constantly look for low prices and multi-functional items (Shevchenko, 2013). At this stage of their lives, Gen X tourists’ income is higher than ever and they are the best example of business travelers (Huang & Petrick, 2010). When they travel for leisure, Gen X’s try to look for active recreation, so they can experience the adventure (Peratinskaya, 2004). They will be satisfied with something simple and mysterious at the same time. They like to travel with their families, so Gen X will first make sure that destinations are suitable for their family and more specifically for their children. This generation is therefore attracted to destinations that have a family and safety image (Peltomäk, 2015). When they travel with their families, they look for well-being and relaxation activities and choose to travel according to their children’s school holidays (Groups Today, 2018).
Millennials is the generational group that is currently changing the world paradigm. They are technologically innovative, globally conscious and much more willing to try new products (Gen C Travel, 2018). This generational group was raised in a protected environment, so they have developed a sense of safety (Gong, Ramkissoon, Greenwood, & Hoyte, 2018). Millennials live in a more volatile and competitive world and are highly educated people. After graduating, they come back to their parents' house, marry later, do not buy their own house and they are interested in creating their own business. They are reluctant to purchase luxury items, such as cars or music. They prefer using other types of services that will not force them to purchase any kind of physical property, giving rise to the so-called shared economy phenomenon (Goldman Sachs, 2018). Millennials are usually characterized by their optimism, closeness, and by their ability to balance personal and professional life. This generation is also impatient, multifaceted and group work-oriented (Devaney, 2015). As consumers, Millennials want to make the best out of life, always searching for and trying anything that they might look fascinating. They enjoy their time very much, so for them it is important to do everything in due time. They want to explore the world and discover new things. They are more positive than the previous generations. Millennials are made of paradoxes: they still live by traditional family values but are very tolerant and open as well. They have strong work ethics but want a balanced life and lots of leisure time as well (Van den Bergh & Behrer, 2016).
This generation is one of the fastest growing segments in the tourism sector. Millennials will represent 50% of all travellers by 2025. They want to discover and to live emotional experiences (Horwath, 2015). According to Bloomberg News (2016), Millennials are a nostalgic generation that opts to spend more on experiences than on material goods. They pursue health and wellness products, they exercise, eat healthier, smoke and drink less, and they use the Internet to look for information about healthy lifestyles (Goldman Sachs, 2018). Younger Millennials are less wealthy, so one may speculate that luxury destinations will not be their first travel choice, since they have no financial independence. Most of them cannot afford long journeys, and few of them travel on business (Barton, Haywood, Jhunjhunwala, & Bhatia, 2013). They are mainly interested in volunteering activities and want to know local cultures (Pendergast, 2010). They also wish to explore and want to get as much information as possible (Moscardo & Benkendorf, 2010).
Millennials are the first generation to have lived in continuous interface with technology. Hence, they are digital natives (Prensky, 2001, Goldman Sachs, 2018). Under those circumstances, young Millennials are in constant contact with a highly globalized world where information is always available (Kim, Knight & Pelton, 2009). Most of them use social networks and websites to expand their knowledge (Djamasbi, Siegel, Skorinko, & Tullis, 2011). It is also online that they get information about tourist destinations. Since the formation of any destination image depends on a cognitive assessment and on the consequent affective response, Millennials’ destination image will be highly influenced by what they see online (Kima, Leeb, Shinc, & Yangd, 2017).
Methodology
Research was conducted using a survey applied in a European country, Portugal, to domestic tourists travelling across the Center Region of that country. The empirical collection was conducted from March 21st to April 5th 2018.
With huge international recognition and many tourism awards granted to its many regions, cities and destinations, Portugal’s performances regarding tourist arrivals and receipts over the last few years are among the highest and have been growing steadily around 11% each year since 2010 (UNWTO, 2017). The Center of Portugal is the Portuguese with bigger growth over the last few years (twice the national
average growth). The region total number of overnight stays in 2017 reached 3.197.488, which represented 277 million of the country’s total receipts. The international market continues to be the primary factor contributing to the growth of tourism in this region. In 2017, foreigners’ overnight stays increased by 29.5%. However, national tourist demand is still the most important, amounting to 1.8 million in 2017. This shows that this market keeps increasing in a sustained way as well (Turismo de Portugal, 2018).
The Center of Portugal represents 25% of the Portuguese territory and is divided into seven sub-regions: Ria de Aveiro, Coimbra, Serra da Estrela, Castelo Branco, Oeste, Viseu Dão Lafões, and Leiria, Fátima and Tomar. It is a vast and diverse region with an important multiplicity of resources, sightseeing spots, accommodation, gastronomy and landscapes that include seashores and mountains alike (VisitPortugal, 2018). Because of its heterogeneity, this region agglomerates different tourist products:
i) Culture and Heritage: several monuments, UNESCO heritage sites, churches and castles; ii) Nature: several natural parks, lakes, forests and mountains;
iii) Sun and Sea: beautiful sea and river beaches; iv) Rural Tourism and countryside;
v) Spa and wellbeing: with some of the most important thermal spas of Portugal and Spain; vi) Sports and adventure: winter sports, surf, mountaineering, climbing, rafting, sailing, among
others
vii) Religious Tourism: the most important Portuguese religious site, Fátima sanctuary, is located in this region.
Measurements and Data collection
The survey instrument was built based on well-known scales available in the tourism literature: i) for the cognitive image- to accurately assess and describe the characteristics of the destination, we used the scales created by García, Gómez and Molina (2012), Jiang, Ramkissoon, Mavondo and Feng (2017), Han, Kiatkawsin and Kim (2017), Molera and Albaladejo (2007), Royo-Vela (2009). For the affective image, the scales used were those produced by Stylos, Vassiliadis, Bellou and Andronikidis (2016), Yen and Croy (2016) to help distinguish tourists’ perceived images created according to their perceptions and feelings. The final instrument included 27 items regarding the tourists’ cognitive image according to nine factors: Cleanliness and Good Environment, Childhood and Simple Things, Landscape and Tranquility, Social Interaction, History and Culture, Tradition and Rural Life, Infrastructure, Uniqueness and Authenticity and Experience. The affective image included nine items. The scales were selected according to their relevance in the literature and were adapted to the characteristics of the destination.
After selecting the scales from the literature, their adequacy was discussed with different researchers and destination managers. The initial scales were then translated into Portuguese and afterwards the instrument was back-translated into English. Based on this, a pre-test was applied to 30 undergraduate students from the Polytechnic Institute of Viseu in order to test the scales’ reliability through Cronbach’s alpha (Cronbach, 1951). The results of this pre-test were used to make additional refinements to the questionnaire.
A convenience sampling approach was chosen to collect data from domestic tourists. Data were collected using two different approaches. Part of it was collected using social media and online platforms and gathered information from individuals who had travelled at least once to or had visited the Center of Portugal over the last three years. Most of the data (80%) was collected in loco across
different tourist destinations, historic sites, natural parks, museums, events, monuments, and accommodation facilities. Tourists were approached randomly and the questionnaires were self-administrated to ensure the unbiasedness of the data. 626 questionnaires were applied. From all those questionnaires, 622 were considered valid. The final sample allowed for a good proportion of observations for the 36 destination image indicators (17:1) (see Bentler, 1989, in Westland, 2010). Sample profile
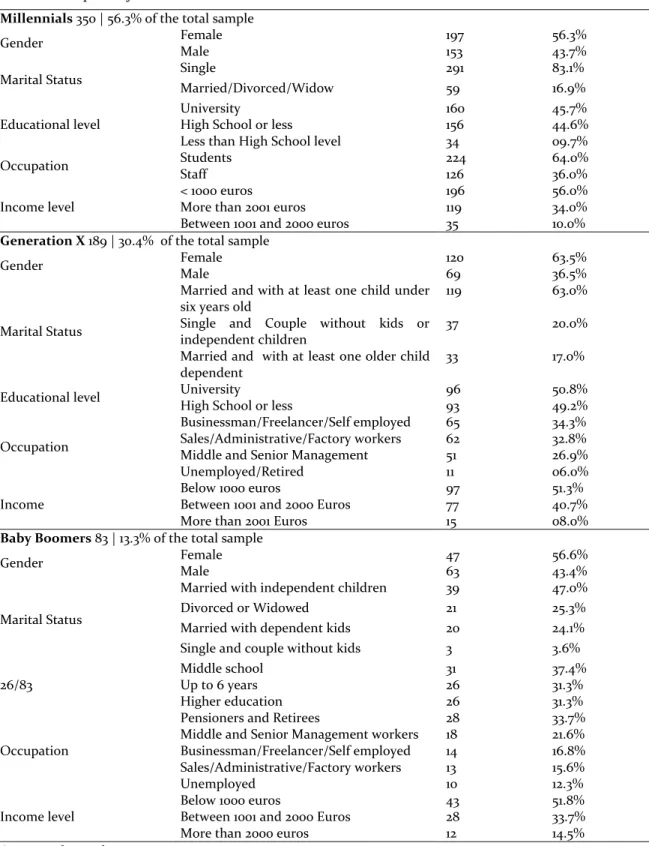
The main elements of the sample profile are presented in Table 1. The information about the different generational groups is sorted according to their gender, marital status, educational level, occupation, household characteristics, and income level:
Results
The results are consistent with the scales used to measure the cognitive attributes of the destination image. Correlations between the scales items range from -0.007 to 0.500. Those values prove that the items can be included in those different dimensions. The relational structure of the cognitive attributes of destination image was analysed using exploratory factor analysis over the correlation matrix, and factor extraction was achieved using principal component analysis and varimax rotation. To ensure the best factor structure it was necessary to identify several alternative solutions. Additionally, the number of factors obtained in the analysis also took into account prior researches (Hair, Black, Babin, & Anderson, 2010). In this line, the variance explained by the factorial analysis must be higher than 60%. However, to achieve at least that percentage of variance explained, and to obtain a reasonable solution, it could be considered eigenvalues lower than 1 (Hair et al., 2010). Several factorial analyses were carried out and some variables were removed because they showed factor saturations above 0.5 in more than one factor. It was the case of variables like: i) Sensation of space, ii) Rich and unique gastronomy, iii) Interesting and friendly people, iv) Rustic and traditional architecture, v) Memories associated with childhood, and v) History and local legends.
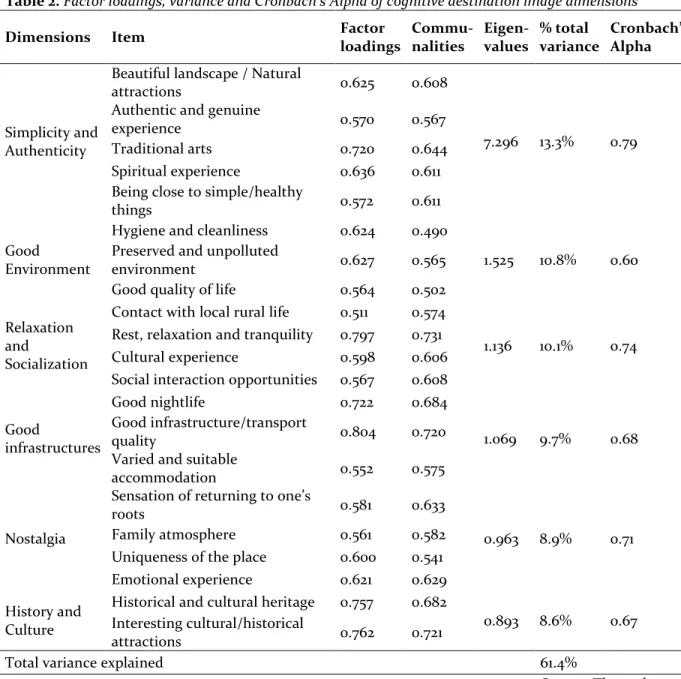
The final model showed a Kaiser-Meyer-Olkin (KMO) Measure of Sampling Adequacy satisfactory at 0.926. KMO test is grounded on a comparison between the sum of squared correlation coefficients and the sum of partial correlation coefficients, expressed as a value between 0 and 1. The higher the score the better. The value obtained was 0.926, which indicates an excellent adequacy of the model (Sharma, 1996). The results obtained from Bartelett's sphericity test showed that the variables are significantly correlated (p-value = 0.000). They also indicated that the use of factor analysis is adequate (Sharma, 1996). Data showed statistical validity and a varimax rotation was performed. Factors were expected to be unrelated (West, 1991). Six factors explained 61.3% of the total variance in the sample. Table 1 shows those six factors and their respective factor loadings, variable communalities, factor explained variance and their Cronbach’s alphas (Cronbach, 1951).
The first of the six factors is Simplicity and Authenticity and is connected with the country’s natural landscape, its authenticity and traditions and with the simple, healthy and spiritual experiences it provides. It accounts for 13.3% of the variance. The alpha coefficient is 0.79. The second factor, Good Environment, accounts for 10.8% of the variance and has a Cronbach’s alpha of 0.60, which is normally deemed a low coefficient. However, in this case, and taking into account the literature, it was considered an important factor. This dimension includes the destination’s cleanliness, the existence of a preserved, non-polluted environment, and the quality of life provided. The third factor, with an
Table 1. Sample Profile
Source: The authors
Millennials 350 | 56.3% of the total sample
Gender Female 197 56.3%
Male 153 43.7%
Marital Status Single 291 83.1%
Married/Divorced/Widow 59 16.9%
Educational level
University 160 45.7%
High School or less 156 44.6%
Less than High School level 34 09.7%
Occupation Students 224 64.0%
Staff 126 36.0%
Income level
< 1000 euros 196 56.0%
More than 2001 euros 119 34.0%
Between 1001 and 2000 euros 35 10.0%
Generation X 189 | 30.4% of the total sample
Gender Female 120 63.5%
Male 69 36.5%
Marital Status
Married and with at least one child under six years old
119 63.0%
Single and Couple without kids or independent children
37 20.0%
Married and with at least one older child dependent
33 17.0%
Educational level University 96 50.8%
High School or less 93 49.2%
Occupation
Businessman/Freelancer/Self employed 65 34.3%
Sales/Administrative/Factory workers 62 32.8%
Middle and Senior Management 51 26.9%
Unemployed/Retired 11 06.0%
Income
Below 1000 euros 97 51.3%
Between 1001 and 2000 Euros 77 40.7%
More than 2001 Euros 15 08.0%
Baby Boomers 83 | 13.3% of the total sample
Gender Female 47 56.6%
Male 63 43.4%
Marital Status
Married with independent children 39 47.0%
Divorced or Widowed 21 25.3%
Married with dependent kids 20 24.1%
Single and couple without kids 3 3.6%
26/83
Middle school 31 37.4%
Up to 6 years 26 31.3%
Higher education 26 31.3%
Occupation
Pensioners and Retirees 28 33.7%
Middle and Senior Management workers 18 21.6%
Businessman/Freelancer/Self employed 14 16.8%
Sales/Administrative/Factory workers 13 15.6%
Unemployed 10 12.3%
Income level
Below 1000 euros 43 51.8%
Between 1001 and 2000 Euros 28 33.7%
Table 2. Factor loadings, variance and Cronbach’s Alpha of cognitive destination image dimensions Dimensions Item Factor
loadings Commu-nalities Eigen-values % total variance Cronbach’s Alpha Simplicity and Authenticity
Beautiful landscape / Natural
attractions 0.625 0.608
7.296 13.3% 0.79 Authentic and genuine
experience 0.570 0.567
Traditional arts 0.720 0.644
Spiritual experience 0.636 0.611 Being close to simple/healthy
things 0.572 0.611
Good Environment
Hygiene and cleanliness 0.624 0.490
1.525 10.8% 0.60 Preserved and unpolluted
environment 0.627 0.565
Good quality of life 0.564 0.502 Relaxation
and
Socialization
Contact with local rural life 0.511 0.574
1.136 10.1% 0.74 Rest, relaxation and tranquility 0.797 0.731
Cultural experience 0.598 0.606
Social interaction opportunities 0.567 0.608
Good infrastructures Good nightlife 0.722 0.684 1.069 9.7% 0.68 Good infrastructure/transport quality 0.804 0.720
Varied and suitable
accommodation 0.552 0.575
Nostalgia
Sensation of returning to one’s
roots 0.581 0.633
0.963 8.9% 0.71
Family atmosphere 0.561 0.582
Uniqueness of the place 0.600 0.541
Emotional experience 0.621 0.629
History and Culture
Historical and cultural heritage 0.757 0.682
0.893 8.6% 0.67 Interesting cultural/historical
attractions 0.762 0.721
Total variance explained 61.4%
Source: The authors alpha of 0.74 and a variance of 10.1%, is the Relaxation and Socialization dimension that has to do with social interaction, rest and relaxation, the contact with rural life and cultural experiences available. The dimension Good Infrastructure is concerned with the quality of night entertainment, overall facilities and transport infrastructures and with good accommodation, accounts for 9.7% of variance and presents an alpha of 0.68. The fifth dimension, Nostalgia, represents the existence of a family atmosphere, the sensation that makes tourists feel they are coming back to their roots and that they are having an emotional experience in a place that is unique. This factor has a loading of 8.9% and a Cronbach’s Alpha of .71. The last dimension accounts for 8.6% of variance. The History and Culture
dimension has an alpha coefficient of 0.67 and gathers all the items that have to do with historical and cultural heritage and attractions offered by a destination. The Cronbach’s alpha ranged between 0.60 and 0.79. Is generally agreed that the lower limit for the Cronbach’s alpha is 0.70, however 0.60 can be considered in an exploratory research (Hair et al., 2010).
Cluster Analysis
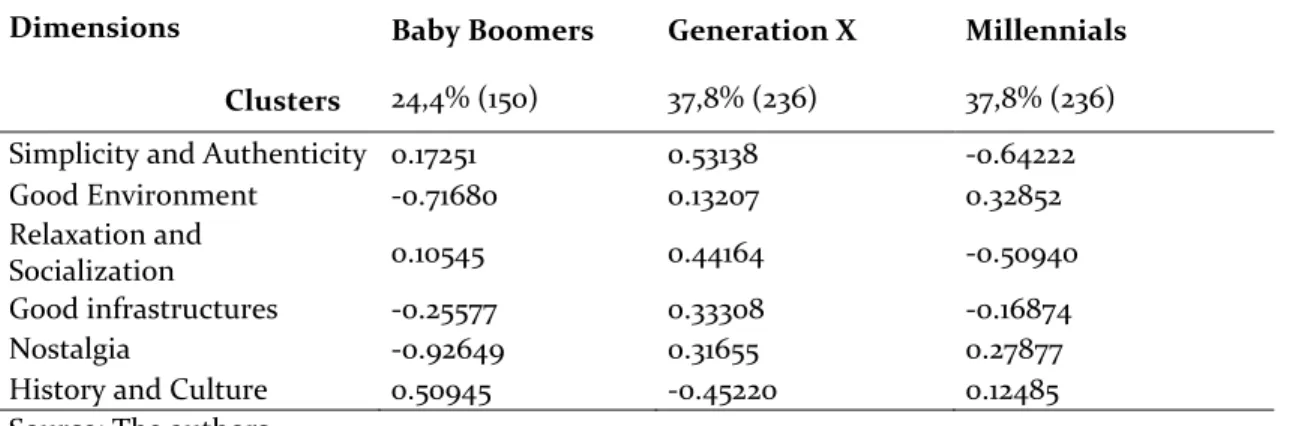
A cluster analysis categorized domestic tourists according to the way they form their destination image. To conduct this analysis, we used the K-means clustering method to assemble domestic tourists in three different clusters, since our main goal was to analyze the influence of the tourists’ generational groups - Millennials, Generation X and Baby Boomers. Table 2 presents the cluster centers and the importance given by the three clusters to the six dimensions of the cognitive image. The first cluster corresponds to 24% of the total sample and represents the tourist segment with the highest perception of the importance of the role played by the History and Culture dimension in the construction of the cognitive destination image. As for the Relaxation and Socialization and Simplicity and Authenticity dimensions, the assigned values are at best median. The lowest scores are found in following dimensions: Nostalgia, Good Environment and Good Infrastructures. Cluster 2 accounts for 38% of the sample. It is composed of individuals to whom the highest importance should be attached to dimensions like Simplicity and Authenticity, Relaxation and Socialization, Good Infrastructures and Nostalgia and who consider that the Good Environment dimension is only mildly relevant.
The lowest score in this cluster is attached to the History and Culture dimension. Finally, the third cluster, representing 38% of the total sample, seems to attach greater importance to the Good Environment and the Nostalgia cognitive image dimensions of a destination. The History and Culture dimension got a median score and the score given to dimensions like Simplicity and Authenticity, Relaxation and Socialization and Good Infrastructures reflects their slight relevance.
Table 3. Cluster Centers Dimensions
Clusters
Baby Boomers Generation X Millennials 24,4% (150) 37,8% (236) 37,8% (236) Simplicity and Authenticity 0.17251 0.53138 -0.64222
Good Environment -0.71680 0.13207 0.32852
Relaxation and
Socialization 0.10545 0.44164 -0.50940
Good infrastructures -0.25577 0.33308 -0.16874
Nostalgia -0.92649 0.31655 0.27877
History and Culture 0.50945 -0.45220 0.12485
Source: The authors
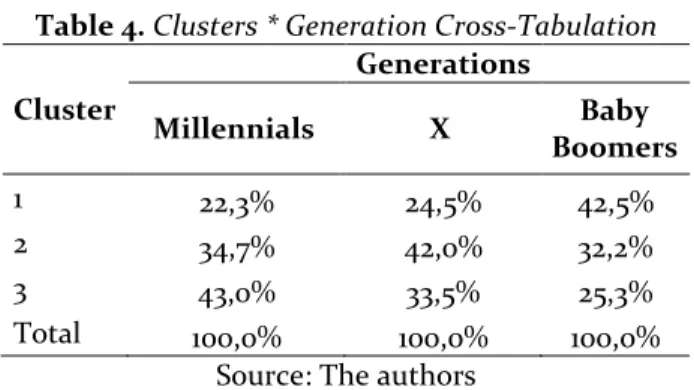
Once the number of segments was settled, the resulting clusters were compared to the generational groups to which domestic tourists originally belonged. Differences were tested using chi-square test for nominal variables. The individuals’ distribution within the clusters varies according to the generational group (χ2 test = 11.889; df = 4; p = 0.018). Cross-tabulation analysis between the different clusters and the three generational groups shows that there is a higher percentage of Millennials in Cluster 3, that Gen X are the most representative generational group in Cluster 2, and finally that Baby Boomers prevail in Cluster 1 (table 4).
Table 4. Clusters * Generation Cross-Tabulation Cluster Generations Millennials X Baby Boomers 1 22,3% 24,5% 42,5% 2 34,7% 42,0% 32,2% 3 43,0% 33,5% 25,3% Total 100,0% 100,0% 100,0%
Source: The authors
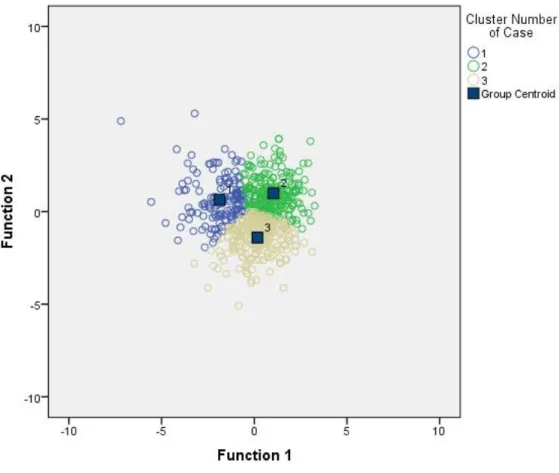
Discriminant analysis was conducted to assess which dimensions are really important to set the boundaries between the different clusters. With this method, it was possible to identify two discriminant functions. Both, function 1 (=0.198, p=0.000) and function 2 (=0.450, p=0.000) are relevant to the production of clusters that are significantly different from each other’s. All the six dimensions show discriminant power. Explaining 51.1% of the variation between the clusters, the first function is composed mainly by the “Nostalgia” (0.859), “Good Environment” (0.650), “History and Culture” (-0.663), and finally by the “Good Infrastructures” (0.407) dimensions. The second function that allows for 49% of the clusters’ discriminant variation is composed of the “Simplicity and Authenticity” (0.883) and “Relaxation and Socialization” (-0.395) dimensions. Figure 1 shows the discriminant power of the two functions and the way they work to distribute the subjects to form the clusters.
Based on the assumption that the formation of the affective image about a certain destination is based on the assessment of the cognitive component of that destination (Baloglu & McCleary, 1999), the tests conducted focused on how the affective component of a destination image influences the cognitive dimension based on which the clusters are formed.
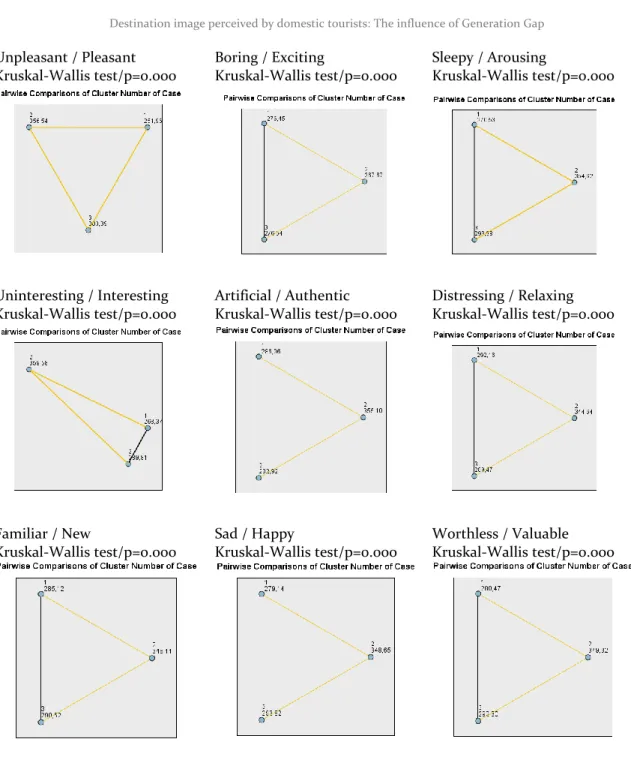
A seven-point semantic differential scale was used to measure the following affective dimensions: Unpleasant/Pleasant, Boring/Exciting, Sleepy/Arousing, Uninteresting/Interesting, Artificial/Authentic, Distressing/Relaxing, Familiar/New, Sad/Happy and finally Worthless/Valuable.
Kruskal-Wallis tests were performed to analyse the possible associations between the three clusters previously identified and the nine affective dimensions of the destination. Results showed that there is a significant influence as exposed in Figure 2. Regarding the affective dimensions, and specifically the Unpleasant/Pleasant dimension, Cluster 2, composed mainly of Gen X, considers the destination significantly more Pleasant (mean rank=356.54); Cluster 3, the Millennials segment (mean rank=303.39) comes right after. Cluster 1 assigns a lower score to that dimension which means that Baby Boomers consider the destination less Pleasant (mean rank=251.96). Cluster 2 also reveals positive feelings when its elements are asked about, the destination. That position is true for all the other affective pairs. In sum, Generation X tourists have a more positive perspective when they have to give their opinion about a certain destination. However, Millennials seem to have a more positive affective image when it comes to assess dimensions that cover aspects like the pleasantness of the place, its interest, value, and like the excitement and happiness it is able to provide. Millennials’ affective destination image is quite similar to Baby Boomers’ in what concerns aspects like excitement, authenticity, relaxation and novelty.
Figure 1. Territorial map of the two discriminant functions Conclusions and Implications
Studies in domestic tourism and the correlation between destination image and tourists’ characteristics are still scarce (Stylidis et al., 2017). This a difficult task because in general domestic tourists know more about the territories and about the attributes of the destination. That knowledge creates a more complex image of the destination that is worth analysing. However, this is a crucial field of research due to the importance of that tourist segment and because of the impact that destination image has on tourist behaviours (Bonnet al., 2005). In addition, understanding the way destination images are formed and the connection between that process and the different generational groups and the gap that exists between them is an important tool for tourist organizations and destinations managers since it clearly influences tourists’ consumer behaviour. Despite its importance and considerable amount of research conducted on destination image, there have been recent calls for additional research on destination image formation and the influence of generation gaps on domestic tourism (Stylidis et al., 2017).
Unpleasant / Pleasant Kruskal-Wallis test/p=0.000 Boring / Exciting Kruskal-Wallis test/p=0.000 Sleepy / Arousing Kruskal-Wallis test/p=0.000 Uninteresting / Interesting Kruskal-Wallis test/p=0.000 Artificial / Authentic Kruskal-Wallis test/p=0.000 Distressing / Relaxing Kruskal-Wallis test/p=0.000 Familiar / New Kruskal-Wallis test/p=0.000 Sad / Happy Kruskal-Wallis test/p=0.000 Worthless / Valuable Kruskal-Wallis test/p=0.000
Figure 2. Pairwise Comparisons
The current study is therefore an attempt to add to the understanding of destination image formation and in particular to its relationship with domestic tourists’ differences caused by the generational groups to which they belong. In the next sections, we will discuss the theoretical and practical implications of our research.
Theoretical Implications
This study adds to the development of the Theory of Reasoned Action (Bray, 2008) because it was possible to prove that domestic tourists build their destination image based on cognitive beliefs and feelings and that the cognitive components affect the affective assessment of national destinations, which is in accordance with previous studies (Baloglu & McCleary, 1999).
Domestic tourists build the image of a tourist destination based on six cognitive dimensions: Simplicity and Authenticity, Good Environment, Relaxation and Socialization, Good Infrastructures, Nostalgia and History and Culture.
This study provides the first data-driven segmentation based on domestic tourists’ destination image formation. It was possible to demonstrate that different generational groups of domestic tourists have distinct beliefs, conceptions and attitudes about a destination. Baby Boomers, Generation X and Millennials conceive different cognitive and affective images and in consequence have different behaviours when they are tourists in their own countries.
Baby Boomers develop a cognitive destination image mainly based on two dimensions: i) History and Culture, the historical and cultural of the destination and its heritage and attractions and ii) Relaxation and Socialization, when they are provided with genuine contact with local rural life, cultural experiences, when they can enjoy rest and tranquillity and experience enriching social interaction. This observation confirms the findings of previous studies (Gelfield, 2016). Generation X tourists have a more complex cognitive destination image. They favour four cognitive dimensions: i) Simplicity and Authenticity related with the beauty of landscapes, with the authenticity and spirituality of the experiences they are offered, and with the local traditional arts. They also praise close contact with simple and healthy things; ii) Relaxation and Socialization; iii) Good Infrastructures, that would include night entertainment places, transports and accommodation; and iv) Nostalgia, specifically the sensation of returning to one’s roots provided by the place, its family atmosphere, the uniqueness of the place and the emotional experience it offers. These results are consistent with other studies (Groups Today, 2018; Peltomäk, 2015). Millennials, the youngest group of tourists, build their destination image mainly based on Good Environment, a dimension related with the place’s clean, preserved and unpolluted environment and the good quality of life it offers and Nostalgia. These findings are in accordance with those presented in previous studies (Goldman Sachs, 2018).
Finally, and as far as affective destination image is concerned, Generation X tourists associate more positive feelings to the places than Baby Boomers and Millennials. This probably occurs because Gen X are more flexible and more curious individuals, and at the same time, because they tend to be more empathetic and more sensitive (Poo, 2017). On the other hand, Baby Boomers and Millennials’ preferences are very much alike in aspects like excitement, authenticity, relaxation, and novelty when it comes to build their affective destination image. Millennials, however, show higher interest in the pleasantness of the place, the interest it might trigger, its valuable image, the happiness it brings them and its sleepy nature. This clearly supports the findings of other studies that state that this generation is composed of positive, happy people who are also curious and interested in discovering the world and the pleasures of life (Devaney, 2015).
Globally and surprisingly, Millennials and Baby Boomers, despite being more distant in terms of age, share a more homogenous affective image than with Gen X tourists. In practical terms, grandparents and grandchildren identify themselves more than children and parents in the formation of their tourist destination image. In fact, previous studies concluded that Baby Boomers adopt behaviours
that are similar to those adopted by newer generations in order to look younger that they really are (Shevchenko 2013). On the other hand, Millennials are nostalgic and maintain a close connection with old times (Goldman Sachs, 2018). In fact, Baby Boomers and Millennials have several similarities. Both were raised in times of change and witnessed major changes that shaped their behaviours and mentalities (Perfect Labor Storm, 2016), they both value time and memorable experiences but also like to feel safe (Gong et al., 2018), they are curious, independent and adventurous individuals but look for protected environments (Creative Marketing Alliance, INC, 2018; Patterso net al., 2017).
Managerial Implications
The destinations and organizations that aim to attract domestic tourists should consider that they build their cognitive destination image based on the concepts like Simplicity and Authenticity, Good Environment, Relaxation and Socialization, Good Infrastructures, Nostalgia and History and Culture. This assumption means that those aspects should be valued and cared for in all the areas that surround the hotels or restaurants, and that every destination has to be capable of providing tourists with that sort of amenity. Managers must consider these aspects when they design promotion strategies and choose a market positioning directed to domestic tourists. When developing promotion campaigns for national tourists, organizations should use the cognitive and affective dimensions. The destination affective dimension is a crucial aspect valued by domestic tourists. What tourists know about the domestic destinations will influence their emotional connections and feelings towards those places. The development of promotion campaigns of national destinations based on these dimensions and attributes will lead tourists to choose domestic destinations and formulate purchase intentions. Managers can develop domestic tourism market segmentation by defining their specific targets in accordance with the different consumers’ generational groups. Generation X individuals tend to have a more positive affective image of domestic destinations, while Millennials and Baby Boomers’ positions are more similar when it comes to establish emotional bonds with national tourism destinations. A destination or organization whose main target are Gen X tourists should take into account dimensions that favour aspects like Simplicity and Authenticity, Relaxation and Socialization, Good Infrastructures and Nostalgia in its advertising messages. On the other hand, Baby Boomers are attracted to History and Culture and Simplicity and Authenticity. Millennial tourists value the Good Environment provided by the destination and the Nostalgia it triggers.
This study also shows the existence of synergies regarding destination affective image between Millennials and Baby Boomers. Managers can use this proximity to define the positioning and the marketing-mix tourism organizations will provide to those consumers. In this sense, the way both generations value and emotionally assess domestic destinations is quite similar and can make sense to create packages of identical products aimed at consumers from both generational groups. Generation X tourists are by far those who value the most domestic destinations, so they have to be a prime target for tourism organizations.
Limitations and Further Research
The first limitation refers to the empirical work carried out. A larger sample with international tourists would possibly lead to a better comparison of the empirical results, by splitting the sample and comparing the differences between international and domestic tourists’ behaviours and the cognitive and affective aspects of destination image formation. In addition, it would be interesting to measure and compare other tourism destinations. On the other hand, and since destination images are not static and change over time (Gartner & Hunt, 1987), they should be re-assessed periodically. This would set the way to an interesting research challenge (Krider, Arguello, Campbell & Mora, 2010)
that would use a longitudinal study and the regular application of the defined scale to the same destination. Further research on the generational groups and on their travel decision-making process and travel choice behaviour is crucial.
With regards to the cognitive and affective dimensions of the tourist destination image, it would be interesting to assess what may influence the formation of the different tourist images and the impacts of those differences on the travel behaviours of Baby Boomers, Gen X and Millennials tourists.
Finally, further research on the connections that exist between domestic destination image and tourism motivation has to be a priority. The general consensus is that destination image and motivation are factors that influence decisively the tourist’s choice behaviour when he plans his trip to a certain destination, so it could be particularly interesting to cross-check these two dimensions of consumer behaviour.
Acknowledgments: This work was funded by national funds through FCT – the Portuguese Foundation for Science and Technology (UID/ECO/00124/2013 and Social Sciences DataLab, Project 22209), POR Lisboa (LISBOA-01-0145-FEDER-007722 and Social Sciences DataLab, Project 22209), POR Norte (Social Sciences DataLab, Project 22209) and under the projects UIDB/05583/2020 and UIDB/04084/2020. Furthermore, we would like to thank CEGOT - Geography and Spatial Planning Research Centre, and Research Centre in Digital Services (CISeD), the Polytechnic of Viseu and the Faculty of Arts & Humanities of the University of Coimbra for their support. Also, we would like to thank the Instituto Politécnico de Viseu, CI&DETS and Caixa Geral de Depósitos for their support and funding under the project PROJ/CI&DETS/CGD/0015.
References
Ashworth, G. J., & Voogd, H. (1990). Selling the city: Marketing approaches in public sector urban planning. London: Belhaven Press.
Baloglu, S. (2000). A path analytic model of visitation intention involving information sources, socio-psychological motivations, and destination image. (A. Woodside, G. Crouch, J. Mazanec, M. Oppermann, & L. Sakai, Edits.) Journal of Travel & Tourism Marketing, 8(3), 81-90.
Baloglu, S., & McCleary, K. (1999). A model of destination image formation. Annals of Tourism Research, 26(4), 868-897.
Barton, C., Haywood, J., J. P., & Bhatia, V. (2013). Travelling with Millennials. Boston: Boston Consulting Group.
Beerli, A., & Martin, J. (2004). Tourists' characteristics and the perceived image of tourist destinations: A quantitative analysis - A case study of Lanzarote, Spain. Tourism Management, 25, 623-623. Bigné, J., Sanchez, J., & Sanchez, A. (2001). Tourism image, evaluation variables and after purchase
behaviour inter-relationship. Tourism Management, 22, 607–616.
Bloomberg News. (Retrieved in October, 24, 2016). From Gen X to Baby Boomers what every generation loves to buy. Bloomberg Business Week. Retrieved from: https://www.bloomberg.com /news/articles/2016-10-20/from-gen-x-to-baby-boomers-what-every-generation-loves-to-buy Bonn, M., Joseph, S., & Dai, M. (2005). International versus domestic visitors: An examination of
destination image perceptions. Journal of Travel Research, 43, 294-301.
Bray, J. P. (2008). Consumer behaviour theory: Approaches and models. Retrieved from: http://eprints.bournemouth.ac.uk/10107/1/.
Burgess, J. (1978). Image and Identity: A Study of Urban and Regional Perception with Particular Reference to Kingston upon Hul. Hull: University of Hull.
Canavan, B. (2013). The extent and role of domestic tourism in a small island: The case of the Isle of Man. Journal of Travel Research, 52(3), 340-352.
Chang, L., Stylos, N., Yeh, S. &Tung, Y. (2014). How do motivation, pre-visit information search and destination image affect post-visit behavioural Intention? The case of an island destination. European Journal of Tourism Research, 9, 8-23.
Chen, C. C., Lai, Y. H., Petrick, J. F., & Lin, Y. H. (2016). Tourism between divided nations: An examination of stereotyping on destination image. Tourism Management, 55, 25-36.
Cherifi, B., Smith, A., Maitland, R., & Stevenson, N. (2014). Destination images of non-visitors. Annals of Tourism Research, 49, 190-202.
Cherifi, B., Smith, A., Maitland, R. & Stevenson, N. (2018). Beyond image: Imagined experiences of a destination. International Journal of Tourism Research, 20, 748-755.
Chon, K. S. (1992). Self-image/destination image congruity. Annals of Tourism Research, 19(2), 360-363.
Creative Marketing Alliance, INC. (May, 2018). Between generations: Marketing differences between Millennials v Babyboomers. Retrieved from: https://cmamarketingsolutions.com/between-the-generations-marketing-differences-between-millennials-v-baby-boomers/
Cronbach, L. (1951). Coefficient alpha and the internal structure of tests. Psychometrika, 16(3), 297-334. Devaney, S. (2015). Understanding the millennial generation. Journal of Financial Service Professionals,
69(6), 11-14.
Djamasbi, S., Siegel, M., Skorinko, J., & Tullis, T. (2011). Online viewing and aesthetic preferences of Generation Y and the Baby Boom Generation: Testing user web site experience through eye tracking. International Journal of Electronic Commerce, 15(4), 121-158.
Embacher, J., & Buttle, F. (1989). A repertory grid analysis of Austria’s image as a summer vacations destination. Journal of Travel Research, 28(3), 3-23.
Fishbein, M. (1963). An investigation of the relationships between beliefs about an object. Human Relations, 16, 233-239.
Fishbein, M. (1967). Readings in attitude theory and measurement. Em M. Fishbein (Ed.), Attitude and the prediction of behavior (pp. 477-492). New York: Wiley.
Fishbein, M. (1980). Nebraska Symposium on Motivation. In H. Howe, & M. Page (Edits.), Theory of reasoned action: Some applications and implications (pp. 65-116). Lincoln: University of Nebraska Press.
Fishbein, M., & Ajzen, I. (1975). Belief, attitude, intention and behavior: An introduction to theory and research. London: Addison Wesley.
Forbes. (May, 1, 2014). What is old? Not 63 and not to me, say aging Baby Boomers. Forbes. Retrieved from: What Is Old? Not 63 And Not Me, Say Aging Baby Boomers: https://www.forbes.com /sites/janetnovack/2014/05/01/what-is-old-not-63-and-not-me-say-aging-baby-boomers/
Fountain, J., & Lamb, C. (2011). Generation Y as young wine consumers in New Zealand: How do they differ from Generation X? International Journal of Wine Business Research, 23(2), 107-124.
García, J. A., Gómez, M., & Molina, A. (2012). A destination-branding model: An empirical analysis based on stakeholders. Tourism Management, 33(3), 646-661.
Gardiner, S., Grace, D., & King, C. (2014). The generation effect: The future of domestic tourism in Australia. Journal of Travel Research, 53(6), 705-720.
Gartner, C., & Hunt, J. (1987). An analysis of state image change over a twelve-year period (1971-1983). Journal of Travel Research, Fall, 15-19.
Gelfeld, V. (2016). AARP Travel Research: 2017 Travel Trends. Washington, DC: AARP Research.
Gen C Travel. (April, 2018). Gen C Travel - Intelligent insights on connected travellers. Retrieved from: Travel and tourism for the millennial generation: https://genctraveller.com/travel-and-tourism-for-the-millennial-generation/
Genereux, R., Ward, L., & Russell, J. (1983). The behavioral component in the meaning of places. Journal of Environmental Psychology, 3(1), 43-55.
Goldman Sachs. (2018). Goldman Sachs. Retrieved from: Milennials Coming of Age: http://www.goldmansachs.com/our-thinking/pages/millennials/
Gong, B., Ramkissoon, A., Greenwood, R. A., & Hoyte, D. S. (2018). The generation for change: Millennials, their career orientation, and role innovation. Journal of Managerial Issues, 30(1), 82-96.
Govers, R., & Go, F. (2005). Projected destination image online. Information Technology & Tourism, 7, 73-89.
Govers, R., Go, F. M., & Kumar, K. (2007). Promoting tourism destination image. Journal of Travel Research, 46(1), 15-23.
Groups Today. (2018). Generation X: Travel trends. Retrieved in April 2018 from: Groups Today: https://groupstoday.com/blog/855-generation-x-travel-trends
Gunn, C. (1972). Vacationscape: Designing tourist regions. University of Texas. Austin TX: Bureau of Business Research.
Gursoy, D. S., Chen, J. G., & Chi, C. (2014). Theoretical examination of destination loyalty formation. International Journal of Contemporary Hospitality Management, 26(5), 809-827.
Hair, J., Black, W., Babin, B., & Anderson, R. (2010). Multivariate data analysis: A global perspective. In P. P. Hall (Ed.), Multivariate Data Analysis: A Global Perspective (7th Ed., Vol. 7th). Pearson. Han, H., Kim, W., & Kiatkawsin, K. (2017). Emerging youth tourism: Fostering young travellers'
conservation intentions. Journal of Travel and Tourism Marketing, 34(7), 905-918.
Horwath HTL. (2015). Tourism Megatrends. Retrieved in June, 2018, from: Horwath HTL Hotel Tourism and Leisure: http://country-clone.htl-web.com/files/2015/12/Tourism-Mega-Trends4.pdf
Huang, Y., & Petrick, J. (2010). Generation Y's travel behaviours: A comparison with Baby Boomers and Generation X. In B. P., G. Moscardo, & D. Pendergast (Edits.), Tourism and Generation Y (Vol. I, pp. 27-37). Cambridge, USA: CABI Publishing.
Hunt, J. (1975). Image as a factor in tourism development. Journal of Travel Research, Winter, 1-7. Jenkins, O. (1999). Understanding and measuring tourist destination images. International Journal of
Tourism Research, 1(1), 1-15.
Jiang, Y., Ramkissoon, H., Mavondo, & Feng, S. (2017). Authenticity: The link between destination image and place attachment. Journal of Hospitality Marketing and Management, 26(2), 105-124. Katz, S. (2017). Generation X: A critical cociological erspective. Generations, 41(3), 12-19.
Kim, S., Stylidis, D. & Oh, M. (2019). Is perception of destinatio image stable or does it fluctuate? A measurement of three points in time. International Journal of Tourism Research, 21, 447-461. Kim, E., Knight, D., & Pelton, L. (2009). Modeling brand equity of a U.S. apparel brand as perceived by
Generation Y consumers in the emerging Korean market. Clothing & Textiles Research Journal, 27(4), 247–258.
Kima, S., Leeb, K., Shinc, S., & Y. S. (2017). Effects of tourism information quality in social media on destination image formation: The case of Sina Weibo. Information & Management, 54, 687-702. Kotler, P., & Gartner, D. (2002). Country as a brand, product and beyond: A place marketing and
brand managemente perspective. The Journal of Brand Management, 9, 249-261.
Krider, R., Arguello, A., Campbell, C., & Mora, J. (2010). Trait and image interaction: In ecotourism preference. Annals of Tourism Research, 37(3), 779-801.
Lawson, F., & Baud-Bovy, M. (1977). Tourism and recreational development. London: Architectural Press.
Lee, G., & Lee, C. (2009). Cross-cultural comparison of the image of Guam perceived by Korean and Japanese leisure travelers: Importance-performance analysis. Tourism Management, 30, 922-931.
Li, X., Li, X., & Hudson, S. (2013). The application of generational theory to tourism consumer behavior: An American perspective. Tourism Management, 37, 147-164.
Lu, L., Chi, C. G., & Liu, Y. (2015). Authenticity, involvement, and image: Evaluating tourist experiences at historic districts. Tourism Management, 50, 85-96.
Mayo, E., & Jarvis, L. (1981). The Psychology of Leisure Travel. Boston MA: CBI Publishing Company, Inc.
Molera, L., & Albaladejo, I. (2007). Profiling segments of tourists in rural areas of South Eastern Spain. Tourism Management, 28(3), 757-767.
Molina, A., & Esteban, A. (2006). Image, tourism brochures usefulness and image. Annals of Tourism Research, 33(4), 1036–1056.
Moscardo, G., & Benkendorf, P. (2010). Mythbusting: Generation Y and travel. London: CABI Publishing.
Mutinda, R., & Mayaka, M. (2012). Application of destination choice model: Factors influencing domestic tourist destination choice among residents of Nairobi, Kenya. Tourism Management, 33(6), 1593-1597.
Nadeau, J., Heslop, L., O'Reilly, N., & Luk, P. (2008). Destination in a country image context. Annals of Tourism Research, 35(1), 84-106.
Nicoletta, R., & Servidio, R. (2012). Tourist´s opinions and their selection of tourism destination image: An affective and motivational evaluation. Tourism Management Perspectives, 4, 19-27. Özdemir, G., & Şimşek, O. (2015). The antecedents of complex destination image. Procedia-Social and
Behavioral Sciences, 175, 503-510.
Patterson, I., Sie, L., Balderas-Cejudo, A., & Rivera-Hernaez, O. (2017). Changing trends in the Baby Boomer travel market: importance of memorable experiences. Journal of Hospitality Marketing & Management, 26(4), 347-360.
Patuelli, R., Mussoni, M., & Candela, G. (2013). The effects of World Heritage Sites on domestic tourism: A spatial interaction model for Italy. Journal of Geographical Systems, 15(3), 369–402. Peltomäk, S. (2015). Crises in the tourism industry and their effects on different generations.
Bacherlor’s Thesis. Rotterdam: University of Applied Sciences.
Pendergast, D. (2010). Getting to know the Y Generation. In P. Benckendorff, G. Moscardo, & D. Pendergast (Edits.), Tourism and Generation Y (pp. 1-15). Wallingford, Oxford, UK: CABI.
Peratinskaya, L. (2004). Five groups of Russian costumers. Retrieved in May, 2018, from: Business Press: http://www.businesspress.ru/newspaper/article_mid_21962_aid_321483.html
Perfect Labor Storm. (2016). Perfect Labor Storm. Retrieved in April 2018, from Why Baby Boomers don't feel or act 'our age': https://www.perfectlaborstorm.com/2016/08/baby-boomers/
Pierret, F. (2011). Some points on domestic tourism. Retrieved in April, 2018, from World Tourism Organization: http://unwto.org/en/opinion/some-points-domestic-tourism
Pike, S. (2008). Destination marketing: An integrated marketing communication approach. Oxford: Elsevier.
Pike, S., & Ryan, C. (2004). Destination positioning analysis through a comparison of cognitive, affective, and conative perceptions. Journal of Travel Research, 42(4), 333-342.
Poo, A. J. (2017). Generation X: Being the change we need. Journal of the American Society on Aging, 41(3), 90-92.
Prayag, G., & Ryan, C. (2012). Antecedents of tourists’ loyalty to Mauritius: The role and influence of destination image, place attachment, personal involvement, and satisfaction. Journal of Travel Research, 51(3), 342-356.
Prenksy, M. (2001). Digital natives, digital immigrants. On the Horizon, 9(5), 1-6.
Qu, H., Kim, L. H., & Im, H. H. (2011). A model of destination branding: Integrating the concepts of the branding and destination image. Tourism Management, 32(3), 465–476.