UNIVERSITY OF ALGARVE
FACULTY OF ECONOMICS
THE IMPACT OF PORTUGUESE DEMOGRAPHIC CHANGES ON
THE DEMAND AND SUPPLY OF BLOOD IN THE REGION OF
ALGARVE
FÁBIA MICAELA GONÇALVES DA ENCARNAÇÃO
Dissertation for obtaining the Masters Degree in Health Care Services
Management
Work made under the supervision of:
Prof. Doutor Jorge Miguel Andraz
Dr.ª Eugénia Vasconcelos
THE IMPACT OF PORTUGUESE DEMOGRAPHIC CHANGES ON THE DEMAND AND SUPPLY OF BLOOD IN THE REGION OF ALGARVE
Work Authorship Declaration
I declare to be the author of this work, which is unique and unprecedented. Authors and works consulted are properly cited in the text and are in the listing of references included.
Fábia Micaela Gonçalves da Encarnação
………
(signature)
Copyright
© Copyright: Fábia Micaela Gonçalves da Encarnação
The University of Algarve has the right, perpetual and without geographical boundaries, to archive and make public this work through printed copies reproduced in paper or digital form, or by any other means known or to be invented, to broadcast it through scientific repositories and allow its copy and distribution with educational or research purposes, non-commercial purposes, provided that credit is given to the author and Publisher.
ACKNOWLEDGMENTS
Firstly, I would like to express my sincere gratitude to my advisors Prof. Doutor Jorge Andraz and Dr.ª Eugénia Vasconcelos for the continuous support on my study and related research, their patience, motivation and immense knowledge. Their guidance helped me in all the time of research and writing of this thesis. I could not have imagined having better advisors and mentors for my study.
My sincere acknowledgements also go to the Algarve Hospital Centre, in particular to the Blood Bank Service, which provided me most of the data and the access to the laboratory facilities. Without this precious support it would have not been possible to conduct this research.
Last but not the least, I would like to thank my family: my parents, my brother and sister, my husband and rest of the family for their spiritual support throughout writing this thesis and in my life in general.
ABSTRACT
The world cannot live without blood donors, since their donations are an essential and irreplaceable act to save patient lives. Attending that the population ageing evolution leads to a demographic change, we must be concerned whether the demand of Red Cell Concentrates will overcome the existing donations in the future. This is an applied study to the region of Algarve. In particular, it is based on the reality of the Algarve Hospital Centre, whose number of donors, donations, patients and transfused Red Cell Concentrates are evaluated over a five-year period, from 2010 to 2014. A forecast for Red Cell Concentrates demand for 2060 was obtained in four different scenarios. According to the results, by 2060 the population of Algarve will decrease 9.0%, blood donors and blood donations will decrease 24.0% and Red Cell Concentrates demand will increase 35.0%. Through a linear regression, 2046 was established as the year in which the number of blood donors/donations will equalize the demand of Red Cell Concentrates. In actual conditions, the forecast for 2060 reveals that, on average, the demand of Red Cell Concentrates will exceed donor/donations. The Algarve Hospital Centre would then focus its efforts on blood donation promotion among younger age groups (18 and older), as well as in the increase of donation frequency. Another important issue is the investment in the improvement of good transfusion practices, the optimization of patient and blood transfusion management in order to make possible the satisfaction of Red Cell Concentrates needs in the future.
Keywords: Demographic Changes; Red Cell Concentrates Supply; Red Cell Concentrates Demand; Forecast; Population from Algarve.
RESUMO
O mundo não pode viver sem dadores de sangue, uma vez que as suas dádivas são um ato essencial e insubstituível para salvar a vida de doentes. Apesar dos avanços da ciência e das várias descobertas, ainda não foi encontrado um substituto eficaz para o sangue humano.A disponibilidade de sangue e dos componentes sanguíneos, utilizados para fins terapêuticos em contexto hospitalar, depende da dádiva voluntária dos cidadãos, sendo esta denominada por dádiva homóloga. Atendendo à evolução do envelhecimento da população e das consequentes alterações demográficas que daí advêm, devemo-nos preocupar com a possibilidade de, futuramente, as necessidades transfusionais hospitalares, relativamente ao número de Concentrados Eritrocitários, puderem ultrapassar o número das dádivas sanguíneas. O presente estudo foi realizado na região do Algarve, no Centro Hospitalar do Algarve, onde o número de dadores, dádivas, doentes transfundidos e Concentrados Eritrocitários administrados, foram avaliados durante um período de cinco anos, de 2010 até 2014. A criação da entidade e início da atividade do Centro Hospitalar do Algarve remonta a 1 julho de 2013, em conformidade com o Decreto-lei n.º 69/2013 de 17 de maio, que determinou a criação do Centro Hospitalar do Algarve, E.P.E por fusão e consequente extinção do Hospital de Faro E.P.E e do Centro Hospitalar do Barlavento Algarvio, E.P.E., sendo a única entidade hospitalar pública que assegura a prestação de cuidados de saúde a toda a população algarvia. Entre 2011 e 2013 foram realizados diversos estudos e trabalhos levados a cabo pela Administração Central do Sistema de Saúde, I.P., Grupo Técnico para a Reforma Hospitalar, Entidade Reguladora da Saúde e Administrações Regionais de Saúde, com o intuito de classificar as instituições hospitalares e serviços do SNS resultando na Portaria n.º 82/2014 de 10 de abril cujo objetivo passa por estabelecer os critérios que permitem categorizar os serviços e estabelecimentos do Serviço Nacional de Saúde, de acordo com a natureza das suas responsabilidades e quadro de valências exercidas, e o seu posicionamento na rede hospitalar e proceder à sua classificação. Assim sendo, as instituições podem ser classificadas em quatro grupos: I, II, III e IV. O Centro Hospitalar do Algarve pertence ao Grupo II e apresenta as seguintes valências médicas e cirúrgicas: medicina interna, neurologia, pediatria médica, psiquiatria, cirurgia geral, ginecologia, ortopedia, anestesiologia, radiologia, patologia clínica, imunohemoterapia e medicina física e de reabilitação, oftalmologia, pneumologia, cardiologia, reumatologia, gastrenterologia, nefrologia, hematologia clínica, infeciologia, oncologia médica, neonatologia,
imuno-alergologia, ginecologia/obstetrícia, dermato-venerologia, otorrinolaringologia, urologia, cirurgia vascular, neurocirurgia, anatomia patológica, medicina nuclear e neurorradiologia. Em Portugal, é o Instituto Português do Sangue e da Transplantação, I. P., que tem por missão garantir e regular, a nível nacional, a atividade da medicina transfusional e de transplantação e garantir a dádiva, colheita, análise, processamento, preservação, armazenamento e distribuição de sangue humano, de componentes sanguíneos, de órgãos, tecidos e células de origem humana. O Decreto-Lei nº 185/2015, de 2 de setembro que transpõe a Diretiva n.º 2014/110/UE da Comissão, de 17 de dezembro de 2014, alterando a Diretiva n.º 2004/33/CE da Comissão, de 22 de março, no que se refere aos critérios de suspensão temporária de dadores de sangue relativamente a dádivas homólogas, e procede à segunda alteração do Decreto-Lei n.º 267/2007, de 24 de julho, que estabelece o regime jurídico da qualidade e segurança do sangue e dos componentes sanguíneos, respetivas exigências técnicas, requisitos de rastreabilidade e notificação de reações e incidentes adversos graves e as normas e especificações relativas ao sistema de qualidade dos serviços de sangue, com vista a assegurar um elevado nível de proteção da saúde pública. Uma distribuição de componentes sanguíneos apropriada só é possível quando o número de dádivas homólogas e o número de transfusões de hemoderivados estão equilibradas. Dadores do sexo masculino podem doar sangue no máximo quatro vezes ao ano enquanto dadores do sexo feminino podem realizar no máximo 3 dádivas anuais. Relativamente ao Algarve, a esperança média de vida tem vindo a aumentar e a população de doentes transfundida é constituída maioritariamente por uma faixa etária mais elevada (65 anos e superior). Neste estudo, projetaram-se para o ano de 2060 as necessidades transfusionais de Concentrados Eritrocitários em quatro cenários diferentes: Cenário Baixo, Cenário Central, Cenário Alto e Cenário Sem Migrações. Estes cenários resultam da conjugação de diferentes hipóteses relativas à futura evolução de cada componente demográfica. O Cenário Baixo resulta da conjugação das hipóteses pessimista para a fecundidade, central para a mortalidade e pessimista para as migrações; o Cenário Central associa as hipóteses de evolução central para a fecundidade, assim como para a mortalidade e a hipótese otimista para as migrações; o Cenário Alto combina as hipóteses de evolução otimista quer para a fecundidade, como para mortalidade e para as migrações; o Cenário Sem Migrações corresponde a um cenário idêntico ao Cenário Central, no entanto contempla a possibilidade de não ocorrência de migrações. Segundo o Instituto Nacional de Estatística, para qualquer um dos cenários de projeção apresentados, a população residente em Portugal tenderá a
diminuir até 2060. No Cenário Central a população apresentará uma diminuição de 10,5 milhões de pessoas em 2012 para 8,6 milhões de pessoas em 2060. Simultaneamente com um declínio populacional, são esperadas alterações da estrutura etária da população, assim como um continuado e forte envelhecimento demográfico. De acordo com os resultados obtidos, até 2060 a população algarvia diminuirá 9,0%, os dadores e as dádivas sanguíneas diminuirão 24,0% e as necessidades de Concentrados Eritrocitários aumentarão 35,0%. Mediante condições atuais, uma projeção para o ano de 2060 demonstra-nos que, em média, as necessidades de Concentrados Eritrocitários serão superiores aos dadores/dádivas existentes. Estabeleceu-se, através da estimação de um modelo de regressão linear, que em 2046 o número de dadores/dádivas sanguíneas será equivalente ao número de Concentrados Eritrocitários transfundidos no Centro Hospitalar do Algarve. O Centro Hospitalar do Algarve deverá concentrar esforços na promoção da dádiva sanguínea junto das faixas etárias mais jovens (18 anos e superior), assim como aumentar a frequência da dádiva. Outro aspeto a considerar será o investimento na melhoria das boas práticas transfusionais e na otimização da gestão do paciente e do sangue transfundido, de modo a, futuramente, se conseguir dar resposta às necessidades transfusionais de Concentrados Eritrocitários.
Palavras-chave: Alterações Demográficas; Consumo Concentrados Eritrocitários; Necessidade Concentrados Eritrocitários; Projeção; População do Algarve.
TABLE OF CONTENTS
Page
LIST OF FIGURES ... x
LIST OF TABLES ... xi
LIST OF ABBREVIATIONS ... xii
Chapter 1. INTRODUCTION ... 1
1.1. The hospital context in the Algarve region ... 5
1.2. Resident Portuguese population projections 2012-2060 ... 7
1.3. Objectives and structure of the dissertation ... 8
Chapter 2. LITERATURE REVIEW ... 9
2.1. Previews studies ... 9
2.2. Blood substitutes ... 13
2.3. Impact of demographics on blood supply and demand ... 13
Chapter 3. DATA COLLECTION AND METHODOLOGY FRAMEWORK ... 16
3.1 Data description and sources ... 16
3.1.1 Donors characterization ... 17
3.1.2 Patients characterization ... 21
3.1.2.1 Blood transfusion ... 21
3.1.2.2 Blood transfusion by medical areas in CHA ... 22
3.1.3 Donors versus Patients ... 23
3.2. Methodology framework ... 24
3.2.1 Outliers ... 24
3.2.2 Validation of the projection model... 26
3.2.3 Forecast ... 28
Chapter 4. RESULTS AND DISCUSSION ... 29
Chapter 5. CONCLUSIONS ... 32 References ... 34 Appendix 1 ... 37 Outliers 2011 ... 37 Outliers 2012 ... 37 Outliers 2013 ... 38 Outliers 2014 ... 39 Attachment A ... 40
LIST OF FIGURES
Figure 1.1 Rates of effective, natural and migratory growth (%), Portugal and NUTS II, 2009-2014 ... 2 Figure 1.2 Age pyramid, Portugal, 2012 (estimated) and 2060 (projections scenarios)... 7 Figure 3.1 Homologous donors in CHA from 2010-2014 ... 17 Figure 3.2 Donors gender in CHA from 2010-2014……….….19 Figure 3.3 Donors age rate in CHA from 2010-2014 ... 20 Figure 3.4 The five more RCC consumer services in CHA from 2010-2014………….23 Figure 3.5 Donations versus transfusions in CHA 2010-2014………...23 Figure 4.1 Forecast expression and results presentation for 2013, 2046 and 2060…..…31
LIST OF TABLES
Table 1.1 Ageing ratio (No.) by Gender; Annual - INE, Annual Estimates of the Resident Population ………..……….………..…2 Table 1.2 Portugal and Algarve, 2012 (estimated) and 2060 (projection)…..………..…8 Table 2.1 Translation of Appendix VII of Decree-law No. 185/2015…..………..15 Table 3.1 Foreign donor population origins distribution by geographic area from 2010 to
2014……….18 Table 3.2 Donations rate from 2010-2014 CHA……….……20 Table 3.3 RCC transfusion from 2010-2014 in CHA…...………....…21 Table 3.4 RCC distribution in the main services in CHA from 2010-2014.……….…..22 Table 3.5 Percentiles calculation for year 2010………..25 Table 3.6 Interquartile Range calculation for year 2010……….25 Table 3.7 Extreme values calculation for year 2010………...…26 Table 3.8 Outliers calculation for the years 2010, 2011, 2012, 2013 and 2014………..26 Table 3.9 Validation of the projection model for RCC in 2013………...…….27 Table 3.10 Related-Samples Wilcoxon Signed Rank Test for comparison of projected RCC demand (average) and the real demand of RCC (average) in 2013………27 Table 4.1 CHA RCC demand (average) in four projection scenarios for 2060….….….29 Table 4.2 Donors and donations demand for population of Algarve in 2060 in four
different projection scenarios……….………..30 Table 4.3 Comparison of 2013 and 2060: population of Algarve, number of donors, donations and RCC transfusion (average) in CHA…...……..………...….30 Table 4.4 Year forecast for the RCC (average): 143……….…………..…31
LIST OF ABBREVIATIONS
INE Portuguese Official Statistics Institute (Instituto Nacional de Estatística) NUTS Nomenclature of Territorial Units for Statistics
RCC Red Cell Concentrates NHS National Healthcare Service
EPE Business Public Entity (Entidade Pública Empresarial) CHA Algarve Hospital Centre (Centro Hospitalar do Algarve) IP Public Institute (Instituto Público)
KAP Knowledge, Attitude and Practice TPB Theory of Planned Behaviour
EDQM European Directorate for the Quality of Medicines & HealthCare IPST Portuguese Blood and Transplantation Institute (Instituto Português do
Sangue e da Transplantação)
SPSS Statistical Package for the Social Sciences ASIS Application System of Blood Information IQR Interquartile Range
PBM Patient Blood Management
Chapter 1. INTRODUCTION
Until now, human blood cannot be produced or replaced artificially and for that reason homologous blood donations1 are extremely important. One of the most vital
objectives for blood banks is to assure that blood supply is enough for the population needs (Páez, Esita, Newbold, Heddle and Blake, 2013).
The world population reached 7.3 billion as of mid-2015 and in the last twelve years the world has added approximately one billion people. Looking at the global population, 60.0% lives in Asia (4.4 billion), 16.0% in Africa (1.2 billion), 10.0% in Europe (738 million), 9.0% in Latin America and the Caribbean (634 million), and the remaining 5.0% in Northern America (358 million) and Oceania (39 million) (United Nations, 2015a). In the 21st century it can be observed that the global population ageing is increasing in almost every country, which leads to an increment in the demand of economic and social resources (United Nations, 2015b).
The development of medicine and the improvement of health conditions have led to great achievements and enormous challenges in humankind (Ahmed, Chaudhry and Khan, 2015; Zhavoronkov and Litovchenko, 2013). In Western Europe, United States of America, Canada and New Zealand, the life expectancy increased 30 years in 20th century
(Christensen, Doblhammer, Rau, and Vaupel, 2009).The European population structure is changing, originating modifications in younger and elder age groups (Borkent-Raven, Janssen and Van Der Poel, 2010; Greinacher, Fendrich, Brzenska, Kiefel and Hoffmann, 2011; Greinacher, Fendrich and Hoffmann, 2010; Jökulsdóttir, 2013; Lattimore, Wickenden and Brailsford, 2015). The proportion of the elderly population over the total population was 15.0% in 1971, 20.0% in 2000 and is estimated to be 30.0% in 2050 (Christensen et al., 2009; Mota-Pinto et al., 2011).
In Portugal, the Portuguese Official Statistics Institute (INE) reported that through these last years the demographic ageing is a remaining trend (Table 1.1) as a natural result of decreasing birth rates, increase in life expectancy and, more recently, the emigraton flows as observed in Figure 1.1 (INE, 2015).
1 Homologous donation is a donation from a donor who gives blood to be processed at a blood establishment
Table 1.1 Ageing ratio (No.) by Gender; Annual - INE, Annual Estimates of the Resident Population
Age Index2 / Residence
Local Portugal / No.
Reference period of data
2014 2013 2012 2011 2010
Gender Male 114,50 110,10 106,00 103,20 100,10 Female 169,40 163,20 157,50 153,20 148,80
Source: INE (2015)
As it can be observed in Table1.1 along the years the age group from 0 to 14 years has been decreasing in comparison with age group 65 and older. In the years 2010, 2011, 2012, 2013 and 2014 this last age group exceeded in 48.9, 56.4%, 63.5%, 73.3% and 83.9% respectively the first age group. We can take into account that, in the 65 and more years age group, female gender is expressing higher values, in other words, the female population at that ages is more prevalent in the population.
Figure 1.1 Rates of effective, natural and migratory growth (%), Portugal and NUTS3 II, 2009-2014
Source: INE (2015)
2 Age index is calculated as the number of persons 65 years old or over per hundred persons under age 15. 3 The NUTS classification (Nomenclature of Territorial Units for Statistics) is a hierarchical system for
dividing up the economic territory of the EU for the collection, development and harmonisation of European regional statistics, socio-economic analysis of the regions and framing of EU regional policies. In Portugal exists three NUTS: NUTS I (consists of three units, corresponding to the territory of the continent and each of the autonomous regions of the Azores and Madeira); NUTS II (consists of seven units, five of which on the continent and the territories of the Azores and Madeira); and NUTS III (consists of 25 units, of which 23 are on the mainland and 2 corresponding to the Azores and Madeira).
-0,70 -0,60 -0,50 -0,40 -0,30 -0,20 -0,10 0,00 0,10 0,20 2009 2010 2011 2012 2013 2014 % Year
Figure 1.1 reveals that the effective growth of the population is decreasing since 2009 until 2014, where only 2009 presents a positive percentage value, meaning that the size of the population at the end of each year is smaller than the size of the population at the beginning of that same year, except for 2009 where the difference between the size of the population at the end and the beginning had a positive value. Natural growth rate decreased from 2009 to 2014, always with negative percentages, because the number of deaths exceeded the number of births. The migratory growth is calculated by the difference between immigration into and emigration from the area during the year and is negative when the number of emigrants exceeds the number of immigrants. There is a remarkable decreasing trend in migratory growth from 2009 until 2012, turning into negative rates around 2010. Although a slight recovery can be observed in 2013 and 2014, negative values are maintained.
The indicator of life expectancy can be calculated at birth and/or at 65 years old. The life expectancy at birth summarizes the mortality risks at all ages of the population in a given time period, expressing the average number of years a person can expect to live along when exposed to mortality risks by age in that period (INE, 2014a). The life expectancy at 65 years old it is the average number of years that a person aged 65 can expect to live, if age-specific mortality rates at the time remain the same (INE, 2014a).
The average life expectancy for the portuguese population at 65 years reached in 2011-2013 18.97 years for both genders, being 17.07 years for men and 20.40 years for women. In this three years period, the Algarve region showed the highest values for life expectancy at age 65 for the total of the population (19.17 years) in which we have 17.31 years for men and 20.75 years for women (INE, 2014a).
The fact that we attend to a general ageing of the population, to which the Algarve population is no exception, had led us to investigate if the provision of health care will not be jeopardized in the future, becoming a matter of imperativeness concern. The life expectancy increase, the migration flows and economic capacity may lead to a change in the population of blood donors in the Algarve region. Additionally, it must be taken in consideration that the Portuguese law provides criteria regarding the age limits of donors and periodicity of donation.
Blood bank services manage to get a balance between the availability of blood homologous donations and the demand of blood components for transfusion. The
population ageing and the average of Portuguese life expectancy along with the possibility of an increase of Red Cell Concentrates (RCC) requests, can become a medium and long term issue. This is not exclusive for Portugal, since other studies conducted in different countries show a similar problem: population ageing.
Several studies have been developed over time. Greinacher, Fendrich, Alpen and Hoffmann (2007) studied the impact of demographic changes on the blood supply in Mecklenburg-West Pomeria (Germany); the impact for safe blood supply attending demographic changes was studied by Greinacher et al. (2010); Ali, Auvinen and Rautonen (2010) researched the global challenge for blood services due to the ageing of the population; Borkent-Raven et al. (2010) performed a study on demographic changes and the prediction of blood supply and demand in the Netherlands similar to what Jökulsdóttir (2013) elaborated for the Iceland population. In 2011, Greinacher et al. (2011) continued their work on this topic and studied the implications of demographics on future blood supply in a population-based cross-sectional study. Recent studies are focusing on the donors: estimation of the size of potential blood donor pool (Lucky et al., 2014); demography and patterns of donation (Lattimore et al., 2015); donors return behaviour (Evans and Ferguson, 2014; Kheiri and Alibeigi, 2015; Lownik, Riley, Konstenius, Riley and McCullough, 2012; Ziegler et al., 2015).
The Portuguese Government took the Memorandum of Understanding established with the European Union, European Central Bank and the International Monetary Fund committed to improve the performance and accuracy in the management of hospitals in the National Health Service (NHS) through an optimum and efficient use of available resources and simultaneously guaranteeing the right constitutional health protection. For this purpose, the Minister of Health through the Order No. 10601/2011, published in the Republic Diary No. 162, 2nd Series of August 24 2011, established the creation of a Technical Group for the Hospitals Reform whose objective was the proposal of a set of measures for the reorganization of the hospital network through an integrated and rational vision of the health system in order to guarantee the access and quality improvement of health services; hospital efficiency improvement; economic and financial sustainability insurance; improvement of governance and performance of professional service hospitals; and strengthen the role and duty of information to citizens (Grupo Técnico Reforma Hospitalar, 2011).
According to the Grupo Técnico Reforma Hospitalar (2011), the performance of Business Public Entity (EPE) hospitals shows a negative operating result of € 395,4 million and € 5,184 million of receipts. The receipts have resulted almost entirely from the € 4,781 million corresponding to the amount of program contracts with the Portuguese State. The resulting net income was negative, ascending to € 322,1 million. This value will be added to previous years Retained Earnings, which exhibit accumulated losses of € -1449,2 million. The reform of the hospitals is imperative and urgent. It is urgent to create an organization not only more in line with the expectations of citizens and but also more competitive, innovative and humanized, where freedom of choice is possible, and the competitiveness among hospitals plays a role as an induction factor of a better performance. Financial flows should gradually compensate and reward efficiency and quality (Grupo Técnico Reforma Hospitalar, 2011).
1.1. The hospital context in the Algarve region
Before 2013, the Algarve region had two public hospitals to serve its population. The localization of one is in the Windward area - Hospital Centre of the Western Algarve, EPE and of the other is in the Leeward zone - Faro Hospital, EPE. In 2013, as a consequence of the policy measures that Portugal had been going through since 2011, along with the economic and financial context of the country, it became urgent to rationalize and readjust facilities, achieve immediate cost savings, create synergies, and get greater efficiency and effectiveness in the operation of the hospital care objectives. For these reasons the Portuguese Government was impelled to merge the two hospitals. In May 17th, 2013, the Decree-law No. 69/2013 of the Ministry of Health was published in the Republic Diary, creating the Algarve Hospital Centre (CHA), by merging the Faro Hospital, EPE and the Hospital Centre of the Western Algarve, EPE. This measure took effect in July 1st, 2013 (Diário da República, 2013).
Studies that were carried out between 2011 and 2013 by the Central Administration of the Health System, IP (Public Institution), the Technical Group for Hospital Reform, the Regulatory Healthy Entity and the Regional Health Administrations allowed the classification of NHS institutions and hospital services in four groups: Group I, Group II, Group III and Group IV, according to the nature of their responsibilities, valence frame and hospital network positioning. The hospital network is classified in
groups according to the complexity of the response offered to the population, ensuring proximity and hierarchy of healthcare. The CHA belongs to group II which complies with the following:
“…Medical and surgical valences of Group I, plus the valences of ophthalmology, pulmonology, cardiology, rheumatology, gastroenterology, nephrology, haematology clinic, infectiology, medical oncology, neonatology, immuno-allergy, obstetrics/gynaecology, dermatology, venereology, otorhinolaryngology, urology, vascular surgery, neurosurgery, pathology, nuclear medicine and neuroradiology…”, “…Remaining valences are defined according to minimum served population, maps function referral and national distribution of medical and surgical specialties…” and “…does not exercise the valences of clinical pharmacology, medical genetics, paediatric cardiology, cardiothoracic surgery and paediatric surgery”(Diário da República, 2014: 2365).
The high population concentration in the coastal line is a result of strong seasonality and the strengthening and diversification of the tourist offer are specific aspects of Algarve that deserve special attention and influence the socio-demographic context of the region (Centro Hospitalar do Algarve, 2014). The CHA is based in Faro city and currently is the only public health care hospital in the Algarve region. It consists of a set of 3 hospitals (located in Faro, Portimão and Lagos) and 4 emergency basic units (located in Vila Real de Santo António, Loulé, Albufeira and Lagos) that provides direct assistance to the entire population of the Algarve. According to provisional data of Census 2011 there is a resident population of about 450 000 inhabitants, which can increase by three times in summer. This hospital has very specific characteristics in the universe of entities of the NHS, which include, among others, the distance to the reference entities located in Greater Lisbon (round trip is around 600 km); the distance between the three hospitals that make up CHA: Faro/Portimão: 70 km, Faro/Lagos: 90 km and Portimão/Lagos: 20 km; cost of installed capacity to respond in emergency rooms (Faro: Multipurpose Urgency and Portimão: Medical-Surgical Emergency) by virtue of the increasing flows related to the peculiarity of the Algarve being primarily a touristic area (Centro Hospitalar do Algarve, 2014).
1.2. Resident Portuguese population projections 2012-2060
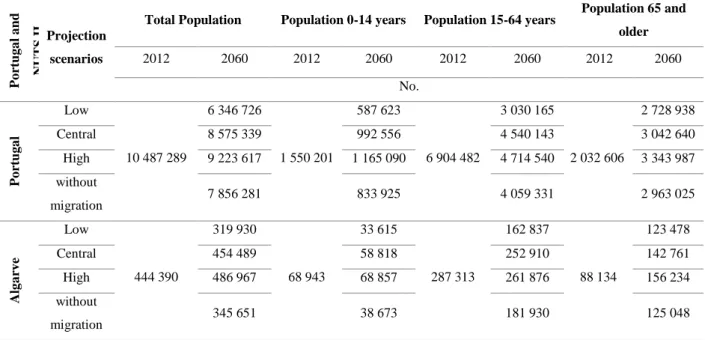
According to INE (2014b), we will witness a decline in population from 10.5 million people in 2012 to 8.6 million in 2060, and structural changes in population leading to a strong demographic ageing. These calculations take into account a set of demographic assumptions about fertility, mortality and international migration. Four projection scenarios are generated: low projection scenario - combines the pessimistic assumptions for fertility, central for mortality and pessimistic for migration; central projection scenario - associates the cases of central trend for fertility and mortality and optimistic for migration; high projection scenario - combines the chances of optimistic evolution for fertility, mortality and migration; scenario without migration - setting identical to the central projection scenario, but contemplating the possibility of non-occurrence of migration (Figure 1.2 and Table 1.2).
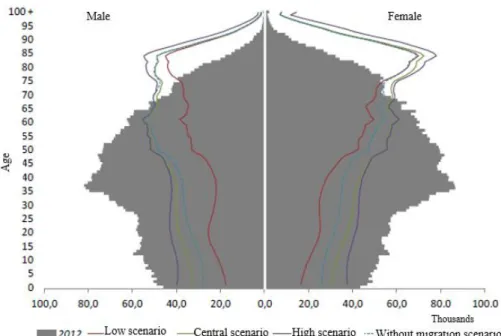
Figure 1.2 Age pyramid, Portugal, 2012 (estimated) and 2060 (projections scenarios)
Table 1.2 Portugal and Algarve, 2012 (estimated) and 2060 (projection) Po rtu g a l a n d NU TS IIProjection scenarios
Total Population Population 0-14 years Population 15-64 years Population 65 and older 2012 2060 2012 2060 2012 2060 2012 2060 No. Po rtu g a l Low 10 487 289 6 346 726 1 550 201 587 623 6 904 482 3 030 165 2 032 606 2 728 938 Central 8 575 339 992 556 4 540 143 3 042 640 High 9 223 617 1 165 090 4 714 540 3 343 987 without migration 7 856 281 833 925 4 059 331 2 963 025 Alg a rv e Low 444 390 319 930 68 943 33 615 287 313 162 837 88 134 123 478 Central 454 489 58 818 252 910 142 761 High 486 967 68 857 261 876 156 234 without migration 345 651 38 673 181 930 125 048 Source: INE (2014b)
As we can see in the Figure 1.2 for the four scenarios projected for 2060, the age structure will change its shape, making it tighter in the age groups under 65 and will increase its distribution at the age groups of 65 years old or more. Table 1.2 reveals the number for each created scenario, for three age groups: 0-14 years old, 15-64 years old and 65 and more years old. It is interesting to observe that in age group 65 and more years old, forecasts will always exceed the real number observed in 2012. In the worst scenario (Low) this population will increase 40.0% and in the best scenario (High) it will increase 77.0%.
1.3. Objectives and structure of the dissertation
Given the general picture of the region in the last section, the main objectives of this dissertation are the following: to elaborate projections for population ageing of Algarve in the year 2060 (four scenarios); to identify opportunities in order to increase the promotion and the number of homologous donations; and to assess the hospital services needs versus the availability of blood components.
For this purposes, the dissertation is structured as follows: after the introduction, chapter 2 reports the literature review, chapter 3 mentions the data collection and methodology framework, chapter 4 presents the results and discussion and chapter 5 presents the conclusion of the work.
Chapter 2. LITERATURE REVIEW 2.1. Previews studies
Greinacher et al. (2007) analysed how demography will determine future blood demand and supply in Mecklenburg-West Pomerania (Germany). The population of the main area of influence of the University Hospital Greifswald (415 000 inhabitants), based on 1-year age groups provided by population register, was projected for the year 2015. This projection was based on 2002 rates assuming constant mortality rates and migration patterns. Donors and recipients data from 1996 through 2004 were extracted from the database of the Department of Transfusion Medicine. Until 2015, the increase in the older population will result in an increase of blood transfusions from 11.8% to 13.9%. Assuming a similar motivation to donate blood as in 2004, the decrease in the younger population will cause a 27.5% to 32.6% decrease of blood donations until 2015. The increased demand for blood coincides with a significant reduction in blood donations. From 2008 the shortfalls will grow from 32.0% to 35.0% of the total demand in 2015 in the studied area. The demographic trends will affect many regions in Europe similarly. Coordinated efforts will be required to prevent blood shortages based on these demographic trends in western countries.
Greinacher et al. (2010) studied the impact of these demographic changes on future blood demand and supply since they believed that data on blood recipients and donors were sparse and unconnected. They first reviewed and summarized studies on the effect of the demographic change on blood supply and demand, realizing that the demographic trends will affect many regions in the Western world similarly. Then, in their second part of the review they report an overview of the methodological approaches to obtain data on the socio demographic background of the blood donor population. They conclude that there was a considerable risk that the demand to blood donation ratio was changing in a way which will threaten the supply of sufficient amounts of RCC. They also conclude that all available data supported the assumption that the demographic change will likely be one of the biggest challenges for transfusion medicine in the next decades.
Ali et al. (2010) performed a study in Finland in which the transfusion registry data suggested some alarming signals and future challenges as a result of the population ageing. Computerized data collection was performed on all potentially transfused patients
in Finland (approximately 70.0% of all blood usage) and it was simulated the use of RCC according to the Finnish practice on different age groups but crossing with the population demographics from other countries. The Finnish data revealed a marked increase in RCC consumption in older patients. The authors concluded that a large part of the variation in RCC use per capita is explained by the age distribution of the different populations and not by the different nationalities and regional treatment policies and protocols in use. If current efforts are not enough to serve the changing population demography and if higher demands for blood products cannot be attained, then there is a need to consider unprecedented measures such as reversing certain donor deferrals or even exporting blood from country to country.
For Borkent-Raven et al. (2010) from the Netherlands, the ageing of the general population determines an increase in the use of blood products. They developed three mathematical models: the first was a demand model that assumes that the average number of transfusions per inhabitant/age/gender is constant; the second was a demand model that incorporated observed changes in clinical blood use over time; the third was a donation model developed to forecast future RCC supply. The supply of whole blood donations estimation was calculated taking into account the annual donor retention, the recruitment rates and the mean number of donations per donor and per year. The first model predicted an increase of 23.0% in RCC demand from 2008 to 2015. The second model predicted a decrease of RCC demand by 8.0% over the same period. The third model predicted that RCC supply would closely follow the demand as predicted by the second model. They concluded that despite of the ageing of population, RCC demand might not increase so much as indicated in other studies. Nevertheless, the observed downward trend in donor recruitment in the Netherlands should be stopped in order to maintain a sufficient RCC supply.
Greinacher et al. (2011) analysed the impact of the demographic change on future blood demand and supply in the German federal state Mecklenburg-Pomerania by performing a population-based cross-sectional study. For all in-hospital transfused RCC (95 477 RCC units), the characteristics of the patient and the blood donors (118 406 blood donations) were taken. Population data were used to predict blood demand and supply until 2020. By 2020 the increase of population of those aged 65 years or more (+26.4%) would be followed by a drop in the potential donor population (18-68 years; -16.1%). Assuming stable rates per age group until 2020, the demand for in-hospital blood
transfusions would increase by approximately 25.0% (24 000 RCC units), while blood donations would decrease by approximately 27.0% (32 000 RCC units). The resulting predicted shortfall would be 47.0% of demand for in-hospital patients (56 000 RCC units). Validation using historical data (1997-2007) showed that the model for the RCC demand prediction had a deviation of only 1.2%. Demographic changes are particularly pronounced in former East Germany, but by 2030 most European countries will face a similar situation. The decrease of younger age groups requires an increase of blood donation rates and interdisciplinary approaches to reduce the need for transfusion to guarantee sufficient blood supply. Demography is a major determinant of future transfusion demand. All efforts should be made by Western societies to systematically obtain data on blood donors and recipients in order to develop strategies to meet future blood demand.
Lownik et al. (2012) through the knowledge, attitude and practice (KAP) surveys, came to the understanding of the factors that influence blood donation as well as the basis for communication and donor mobilization strategies. A search of publically available databases was conducted, and studies with the following characteristics were selected: (1) the study was a knowledge, attitude and practice or KAP plus behaviour survey; (2) the subject of the survey was blood donation; (3) the survey was performed between 1995 and 2011; and (4) the survey was performed in countries classified as emerging and developing countries by the International Monetary Fund. Eighteen KAP studies were conducted in seventeen developing countries. There were considerable differences in the structure, behaviour and population surveyed for KAP studies. The common following themes emerged: misinformation about blood donation, fear of blood donation, willingness to donate for family and friends, concern about selling blood and a failure to transfer positive attitudes into actual blood donation.
Jökulsdóttir (2013) performed population-based studies on demographic influences regarding blood supply and demand in Iceland. The research methods consisted of an extensive review of relevant literature on demographic changes, combined with the collection and analysis of empirical data (Icelandic Blood Bank and the Bureau of Statistics in Iceland) using a population-based cross-sectional research. The conclusion was that demographic changes would affect both supply and demand of blood products in Iceland in the future.
Evans and Ferguson (2014) took the theories of altruism from psychology, economics and evolutionary biology to help to inform both our understanding of the altruistic motives of blood donors and recruitment intervention strategies. A cross-sectional survey (time 1), with a 1-month behavioural follow-up (time 2), was designed to assess theoretically derived constructs from psychological, economic and evolutionary biological theories of altruism. Theory of planned behaviour (TPB), variables and co-operation were also assessed at time 1 and a measure of behavioural co-co-operation at time 2. Five theoretical dimensions of altruism (impure altruism, kinship, self-regarding motives, reluctant altruism and egalitarian warm glow) were identified through factor analysis. Donors can be differentiated from non-donors through these five altruistic dimensions (donors scored higher on impure altruism and reluctant altruism), showed incremental validity over TPB constructs to predict donor intention and predicted future co-operative behaviour. These findings show that altruism in the context of blood donation is multifaceted and complex and does not reflect pure altruism. This has implication for recruitment campaigns that focus solely on pure altruism.
Lattimore et al. (2015) performed a study in England and North Wales that included all first-time and regular blood donors whose blood donations had been collected by the NHS Blood and Transplant during 2010 and 2011. Factors associated with new blood donors returning within 6 months were analyzed using multivariate logistic regression. The majority (87.9%) of them were white British; 5.5% were unknown; 3.4% white Irish or white other; 3.2% composed of all other ethnic groups. The median ages of new and regular donors in 2010 were 28 and 45 years old, respectively, compared to 29 and 47 years old in 2011. Rates of donation varied with ethnicity, ranging from 1.6% among Asian Bangladeshi origin, compared to 22.1% among white British origin. Approximately two in five (38.4%) new blood donors returned within 6 months and were more likely to be male and of white ethnicity. They concluded that blood supply is impacted by numerous factors, including population ageing and an increase in emigrant communities with low donation rates. It is therefore critical that changes within the blood donors and wider population be monitored for the gathering of information regarding donor recruitment and retention strategies.
2.2. Blood substitutes
Blood products are indispensable since there is no synthetic alternative available and they must be obtained from human donors (Bönig, Schmidt and Hourfar, 2012; Evans and Ferguson, 2014; Kheiri and Alibeigi, 2015; Páez et al., 2013).
The increasing number of elective surgeries associated with the small but still remaining risk of transmission of blood-borne pathogens stimulate scientists to develop a synthetic substitute for human blood, more specifically for development of a red blood cell substitute. The attempt to develop a viable blood substitute spans from more than seven decades. These efforts have essentially focused on the ability of red blood cells to carry oxygen. Therefore, most of the products that are in advanced-phase clinical trials are derivatives of hemoglobin and are known as hemoglobin-based oxygen carriers. At the present time, no oxygen-carrying blood substitutes are approved for use by the US Food and Drug Administration. This fact highlights not only the challenges that exist in formulating an effective blood substitute but also the immense potential that exists in this field (Grethlein, 2015).
2.3. Impact of demographics on blood supply and demand
Greinacher et al. (2007) defined blood supply as a transfer of blood from a population of donors to a population of recipients, where the donor population consists primarily of young, healthy individuals, and the patients requiring blood transfusion are mostly elderly. There is an inherent concern with the demographic changes in developed countries where the increase of the elderly population leads to a higher demand for blood components (Ali et al., 2010; Borkent-Raven et al., 2010; Lattimore et al., 2015; Lucky
et al., 2014; Seifried et al., 2011). Bönig, Schmidt and Hourfar (2012) also defend that
blood components consumption needs will grow permanently, following the medicine development and the increase of the average life expectancy. In other words, people will live longer, but will also need more health treatments (Ali et al., 2010; Santana, 2000). High complexity therapeutic procedures in areas such as haematology-oncology or cardiovascular surgery are examples of interventions done majority in aged population(Al-Khabori, Al-Riyami, Mukaddirov and Al-Sabti, 2014; Greinacher et al., 2007; Seifried et al., 2011).
A suitable blood components supply is only possible when the number of homologous donations and transfusion of blood components are balanced (Greinacher et
al., 2010; Greinacher et al., 2007; Masser, White, Hyde and Terry, 2008). Health systems
rely on safety treatments and effectiveness in order to maintain their main goals. Blood donations are preceded of a knowledge, attitude and practice survey (Evans and Ferguson, 2014; Lownik et al., 2012).
On January 27th 2003, the European Union adopted the Directive 2002/98/EC on setting standards of quality and safety for the collection, testing, processing, storage and distribution of human blood and blood components (EDQM, 2015).
In Portugal, the Decree-law No. 185/2015 proceeds to the second amendment to the Decree-law No. 267/2007, from July 24th 2007, transposes the European Parliament and the European Council Directive No. 2014/110/EC, January 27th 2004 and changes the Directive No. 2004/33/EC (EUR-Lex) from the Commission, March 22nd 2004, relatively to the homologous donations criteria for temporary suspension of blood donors, into an internal juridical order. According to the aforementioned Decree-law, the Portuguese Blood and Transplantation Institute (IPST), IP, has the mission to monitor the transfusion medicine activity and ensure the availability and accessibility of safe and effective blood and blood-quality components at a national level. The IPST coordinates, guides and regulates all activities related to blood transfusion, and plays an important role in the definition of national policies for the Transfusion Medicine (Diário da República, 2015). Also the Decree-law No. 39/2012 makes reference to IPST, IP, as an institution that ensures and regulates, at a national level, the activity of Transfusional Medicine and Transplantation and ensures that the donation, collecting, testing, processing, preservation, storage and distribution of human blood, blood components, organs, tissues and cells of human origin are made according to specific requirements. This Decree-law establishes the creation of a national blood transfusion network that safeguards the access to blood components whenever necessary (Diário da República, 2012)
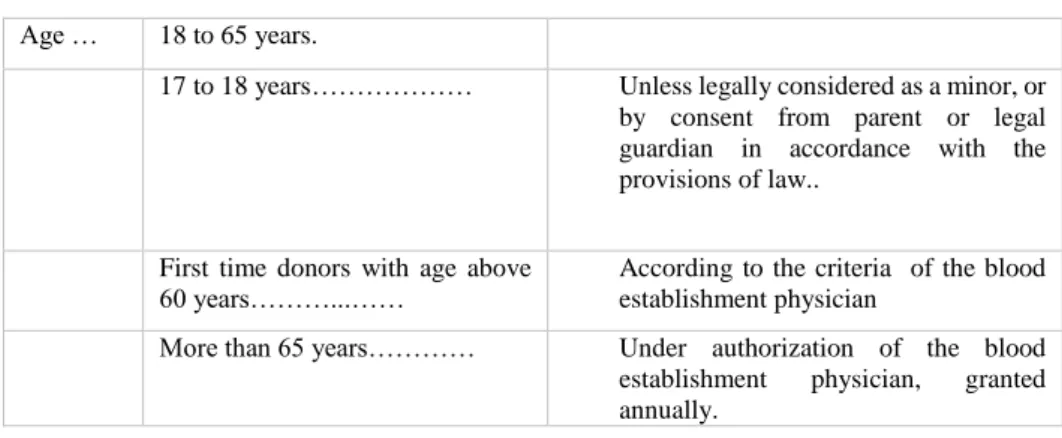
Under this legislation, blood donors that perform voluntary donations, also known as altruist and homologous, must fulfil minimal established criteria such as a minimum weigh of 50 kg, be healthy and aged 18 or over. Details are shown in Table 2.1.
Table 2.1 Translation of Appendix VII of Decree-law No. 185/2015
Age … 18 to 65 years.
17 to 18 years……… Unless legally considered as a minor, or
by consent from parent or legal guardian in accordance with the provisions of law..
First time donors with age above
60 years………...…… According to the criteria of the blood establishment physician
More than 65 years………… Under authorization of the blood
establishment physician, granted
annually.
Source: Diário da República (2015)
The frequency of donation is also regulated. Males can donate blood every 3 months (maximum of 4 donations per year) and females every 4 months (maximum of 3 donations per year).
Chapter 3. DATA COLLECTION AND METHODOLOGY FRAMEWORK This chapter describes the methodology used in this study to collect the data and perform statistical analysis to attain the research objectives. Data description is an essential part of any research project, since familiarity with the data, searching for outliers and verification of assumptions for statistical tests are of outmost importance (Whitley and Ball, 2002).
Descriptive statistics is concerned with the organization, condensation and presentation of information set in order to quantitatively describe the subject of study (Coelho, Cunha and Martins, 2008; Sheskin, 2007). Descriptive statistics is used here to characterize donors and patients.
Statistical inference includes a number of techniques to make inferences about an unknown characteristic of the population. It allows the estimation of characteristic values of the population of interest and the performance of tests that validate, or not, a formulated hypothesis about values or shape of the variable distribution (Coelho et al., 2008; Sheskin, 2007). Inferential statistics are used for forecasts.
This study is therefore a quantitative research. A quantitative research is an objective, formal and systematic process where numeric data are used to collect information about the world. This research method is used to describe the variables, to examine and establish cause-effect relationships between them (Burns and Grove, 2005). It is the most suitable approach for this study, since there is a concern about the current and the future number of blood donors, while taking into consideration the Algarve population forecasts for the next years.
Regarding the Portuguese population demographics and projections, data were extracted from the Portuguese Official Statistics Institute (Attachment A).
A statistical analysis with SPSS (Statistical Package for the Social Sciences) software (version 21) was applied for donors and receptors/patients data analysis (Pereira, 2006).
3.1 Data description and sources
The research work and data collection were taken in the region of Algarve at the CHA. The study and data collected span a time period of 5 years, from January 2010 to
December 2014. Data from homologous blood receptors/patients characterization and RCC consumption were collected through the use of the software Application System of
Blood Information (ASIS). Each transfused RCC unit was considered as one event. INE
provided all the information, historical and projected, from Algarve population.
In the period of study, the blood donations in this facility oscillated from 13 000 to 15 000 whole blood units/year. The population of Algarve and the number of donations in this region represent approximately 4.0% of the Portuguese population and donations (Sousa et al., 2014).
3.1.1 Donors characterization
During this 5 years study CHA had a registration of 8 450 first time donors, 10 151 donors who had already donated in other institutions and 50 598 regular donors making a total of 61 442 donors (Figure 3.1). Is important to note that not all of these donors were eligible to donate blood, some might have been temporary or permanent deferred if they did not comply with the requirements set up in the Decree-law No. 185/2015.
Figure 3.1 Homologous donors in CHA from 2010-2014
Source: ASIS (2015); author´s calculation
Donors who gave blood for the first time along with donors who did it for the first time in CHA had a slight increase from 2010 to 2011 and since then, they have been
9513 10248 16968 11825 12888 8507 9176 10098 10647 12170 1502 1755 2383 2844 1667 1246 1457 2146 2561 1040 0 2000 4000 6000 8000 10000 12000 14000 16000 18000 2014 2013 2012 2011 2010 Number Year
Total number of homologous donors who perform donotation for the first time in life Total number of homologous donors who perform donotation for the first time in CHA Total number of homologous donors who perform donotation
falling slightly until 2014. The total number of homologous donors decreased from 2010 to 2014 except in 2012 when the number of registered donors reached its maximum.
Featuring the donor population by nationality, 7.6 % are foreigners and their geographic distribution is reported in Table 3.1:
Table 3.1 Foreign donor population origins distribution by geographic area from 2010 to 2014
Geographic area 2014 2013 2012 2011 2010 Central Africa 0 2 5 3 2 North Africa 1 4 3 5 8 South Africa 4 6 16 19 8 Western Africa 44 59 64 69 42 East Africa 16 23 33 15 11 Central America 0 1 1 0 0 North America 7 9 9 13 15 South America 302 313 338 431 399 South Asia 2 9 3 8 2 Southeast Asia 4 3 3 2 0 West Asia 0 0 2 1 0 East Asia 0 0 0 0 3 Western Europe 154 178 195 219 156 Eastern Europe 199 187 183 193 179 Middle East 0 1 2 3 2 Caribbean 1 3 5 2 4 Australia 2 3 1 1 1 Bouvet Island 0 0 0 1 0 Cabo verde 22 26 25 37 22
Sao Tome and Principe 5 6 4 5 5
Not identified 46 50 60 67 59
Total 809 883 952 1094 918
Source: ASIS (2015); author´s calculation
It can be identified in the above table three major geographic areas: South America, Western Europe and Eastern Europe. In South America 97.0% of donors are from Brazil. In Western Europe 39.4% of donors are British, 20.3% French and 11.1% Spanish. In Eastern Europe 44.0% of donors are from Ukraine, 31.8% from Romenia and 12.5% from Moldavia. The foreign donor population shows a slight decrease during the last three years of the period of study.
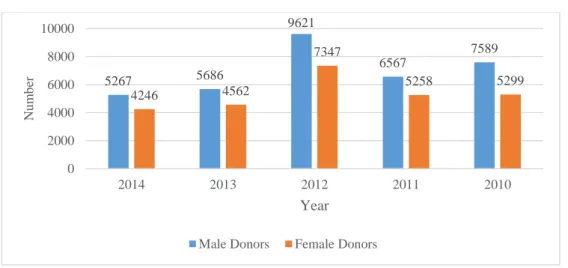
Regarding gender, we can observe that male donors donate more often than women (Figure 3.2). However, we have to take into consideration that males are allowed to donate 4 times per year while females can only do it 3 times per year, owing to the fact that the replacement of iron levels in childbearing age women is slower due to losses during the menstrual cycles and/or pregnancies, associated with an inherent lower blood volume.
Figure 3.2 Donors gender in CHA from 2010-2014
Source: ASIS (2015); author´s calculation
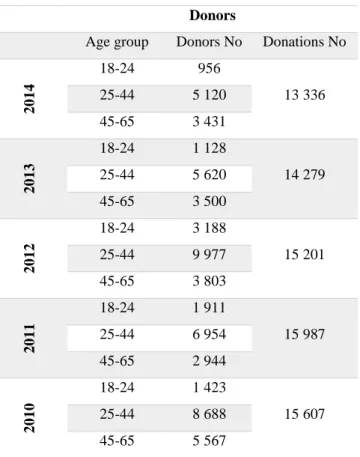
With regard to the age range of donors, we can conclude that the age group of 25 to 44 years old is the one that most contributed to blood donation in Algarve. Donations from the youngest age group (18-24) reached its peak in 2012 (16.8%) but it has been decreasing since then. In the last two years of the study, distribution of donors by age group has remained constant, whereas donations in the 25-44 year old group are the highest ones, followed by donations in the 45-65 year old group and finishing by the 18-24 year old group who had the lowest donations rate (Table 3.2 and Figure 3.3).
5267 5686 9621 6567 7589 4246 4562 7347 5258 5299 0 2000 4000 6000 8000 10000 2014 2013 2012 2011 2010 Nu m b er Year Male Donors Female Donors
Table 3.2 Donations rate from 2010-2014 CHA
Donors
Age group Donors No Donations No
2014 18-24 956 13 336 25-44 5 120 45-65 3 431 2013 18-24 1 128 14 279 25-44 5 620 45-65 3 500 2012 18-24 3 188 15 201 25-44 9 977 45-65 3 803 2011 18-24 1 911 15 987 25-44 6 954 45-65 2 944 2010 18-24 1 423 15 607 25-44 8 688 45-65 5 567
Source: ASIS (2015); author´s calculation
Figure 3.3 Donors age rate in CHA from 2010-2014
Source: ASIS (2015); author´s calculation
8,3 9,2 16,8 13,8 8,0 44,4 45,8 52,6 50,3 49,1 29,8 28,5 20,0 21,3 31,5 0,0 10,0 20,0 30,0 40,0 50,0 60,0 2014 2013 2012 2011 2010 Do n o rs in % Year
3.1.2 Patients characterization
3.1.2.1 Blood transfusion
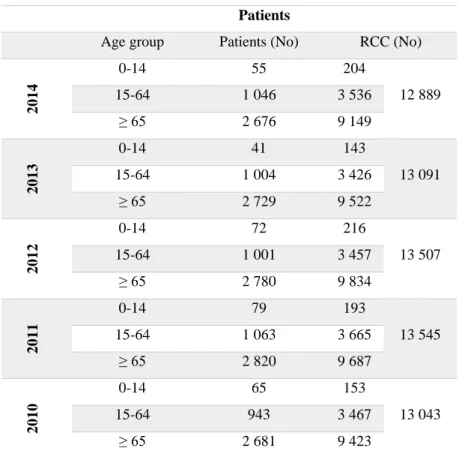
RCC transfusion is evaluated in three age groups: 0-14, 15-64 and over 65 years old as demonstrated in Table 3.3.
Table 3.3 RCC transfusion from 2010-2014 in CHA
Source: ASIS (2015); author´s calculation
For all age groups the number of transfused patients reached its peak in 2011. The age group 0-14 had an increase in the transfusion of RCC from 2010 until 2014, except in 2013. The age group 15-64 had an increase in the transfusion of RCC in 2010, 2011 and 2014, decreasing in 2012 and 2013. The age group over 65 had an increase in the transfusion of RCC from 2010 to 2012, decreasing in 2013 and 2014. This last group represented 72.0% of all transfusions in 2010 and 2011, 73.0% in 2012 and 2013 and 71.0% in 2014.
Patients
Age group Patients (No) RCC (No)
2014 0-14 55 204 12 889 15-64 1 046 3 536 ≥ 65 2 676 9 149 2013 0-14 41 143 13 091 15-64 1 004 3 426 ≥ 65 2 729 9 522 2012 0-14 72 216 13 507 15-64 1 001 3 457 ≥ 65 2 780 9 834 2011 0-14 79 193 13 545 15-64 1 063 3 665 ≥ 65 2 820 9 687 2010 0-14 65 153 13 043 15-64 943 3 467 ≥ 65 2 681 9 423
3.1.2.2 Blood transfusion by medical areas in CHA
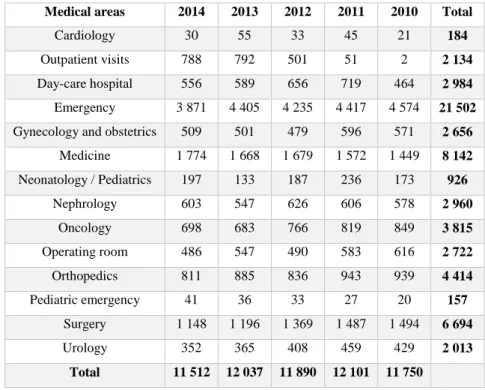
For a RCC to be transfused it is required to fulfil a request, where several information such as identification of the patient, diagnosis, haemoglobin values, amount and type of component, must be provided. Services were grouped in fourteen groups according to the tasks performed and areas of intervention. Table 3.4 shows the distribution in CHA from 2010-2014:
Table 3.4 RCC distribution in the main services in CHA from 2010-2014
Medical areas 2014 2013 2012 2011 2010 Total
Cardiology 30 55 33 45 21 184
Outpatient visits 788 792 501 51 2 2 134
Day-care hospital 556 589 656 719 464 2 984
Emergency 3 871 4 405 4 235 4 417 4 574 21 502
Gynecology and obstetrics 509 501 479 596 571 2 656
Medicine 1 774 1 668 1 679 1 572 1 449 8 142 Neonatology / Pediatrics 197 133 187 236 173 926 Nephrology 603 547 626 606 578 2 960 Oncology 698 683 766 819 849 3 815 Operating room 486 547 490 583 616 2 722 Orthopedics 811 885 836 943 939 4 414 Pediatric emergency 41 36 33 27 20 157 Surgery 1 148 1 196 1 369 1 487 1 494 6 694 Urology 352 365 408 459 429 2 013 Total 11 512 12 037 11 890 12 101 11 750
Source: ASIS (2015); author´s calculation
The five services that have a higher use of RCC are oncology, orthopaedics, surgery, medicine and emergency (Figure 3.4). It is important to notice that 99.0% of the transfused RCC in the day-care hospital correspond to haematology outpatients.
Table 3.3 represents all the transfusions performed by CHA and exhibits a higher number of RCC than Table 3.4, given that this last one only represents the main services it does not include private hospitals requests.
Figure 3.4 The five more RCC consumer services in CHA from 2010-2014
Source: ASIS (2015); author´s calculation
3.1.3 Donors versus Patients
It can be noticed that the number of donations has always remained higher than the number of the transfused RCC. However it is observed that from 2010 to 2014, there is a declining trend, which in a medium or long term future can make this number quite similar to the requested RCC. We have 83.6% in 2010, 84.7% in 2011, 88.9% in 2012, 91.7% in 2013 and 96.7% in 2014 blood donations that were transfused (Figure 3.5).
Figure 3.5 Donations versus transfusions in CHA 2010-2014
Source: ASIS (2015); author´s calculation
0 2000 4000 6000 8000 10000 12000 14000 16000 18000 2014 2013 2012 2011 2010 No Year Donations RCC 2014 2013 2012 2011 2010 0 500 1000 1500 2000 2500 3000 3500 4000 4500 5000
oncology Orthopedics Surgery Medicine emergency
Ye ar RCC t ra n sf u se d Services 2014 2013 2012 2011 2010
3.2. Methodology framework
It is important to verify whether the distribution of the forecast and the real consumption of RCC in 2013 are significantly different, in order to validate the forecasting model. Like in other studies, the Wilcoxon matched-pairs signed-ranks test is the most suitable test for this purpose (Greinacher et al., 2011; Jökulsdóttir, 2013).
The Wilcoxon matched-pairs signed-ranks test (Wilcoxon, 1945) is a nonparametric procedure in which there is the hypothesis testing situation involving a design with two dependent samples, and it is applied in metric or ordinal data (Coelho et
al., 2008; D´Hainaut, 1997; Sheskin, 2007). This test is the distribution-free analogue of
the t test for related samples (David Howell, 2013). It requires that each n pairs of matched subjects has two interval/ratio scores where each score obtained under one of the two experimental conditions (Condition 1 and Condition 2). A difference score is computed for each pair of matched subjects by subtracting subject´s score in Condition 2 from his score in Condition 1. The hypothesis evaluated with the Wilcoxon matched-pairs signed-ranks test is whether or not in the underlying populations represented by the samples/experimental conditions, the median of the difference scores equals zero (Sheskin, 2007). The null hypothesis tested by the Wilcoxon matched-pairs signed-ranks test is that the two sets of paired observations come from populations having the same distribution. The alternative hypothesis states that the two sets of paired observations come from populations having different distributions (David Howell, 2013; Russo, 2003; Sheskin, 2007). The Wilcoxon matched-pairs signed-ranks test is based on the following assumptions: a) the sample of n subjects has been randomly selected from the population it represents; b) the original scores obtained for each of the subjects are in the format of interval/ratio data; and c) the distribution of the difference scores in the populations represented by the two samples is symmetric about the median of the population of difference scores (Sheskin, 2007).
3.2.1 Outliers
An outlier is a score in a set of data which is so extreme that, by all appearances, it is not representative of the population from which the sample is ostensibly derived (Sheskin, 2007). Any data analysis requires special attention to outliers and their inclusion or exclusion of the statistical analysis should be considered (Coelho et al., 2008).
When a data set has outliers, variability is often summarized by a statistic called the interquartile range (IQR), which is the difference between the first and third quartiles. The first quartile, denoted Q1, is the value in the data set that holds 25.0% of the values below it. The third quartile, denoted Q3, is the value in the data set that holds 25.0% of the values above it. The quartiles can be determined following the same approach that we use to determine the median, but we now consider each half of the data set separately. The interquartile range is defined by Q3-Q1 (Chris Spatz, 2010; David Howell, 2013)
Outliers are values below Q1-1.5(Q3-Q1) or above Q3+1.5(Q3-Q1) or equivalently, values below Q1-1.5 IQR or above Q3+1.5 IQR (Marôco, 2010; Murteira, Ribeiro, Silva and Pimenta, 2002; Naiman, Resenfeld and Zirkel, 1996).
The IQR method was applied on data collected from ASIS referent to patients for each year analysed in this study: 2010, 2011, 2012, 2013 and 2014 and from the ages 0 to 99 years old (Appendix 1).
For example, here are the calculations for the year 2010 and, as it can be observed, there are no outliers (Tables 3.5; 3.6 and 3.7):
Table 3.5 Percentiles calculation for year 2010
Percentiles
5 10 25 50 75 90 95
Weighted Average
(Definition 1) RCC .00 2.00 24.00 97.00 223.00 358.00 403.00 Tukey's Hinges RCC 24.00 97.00 216.00
Source: SPSS (2015); author´s calculation
Table 3.6 Interquartile Range calculation for year 2010
Source: Marôco (2010); Murteira et al. (2002); Naiman, Resenfeld and Zirkel (1996); author´s calculation
Upper fence:
Q3 + 1.5 * IQR = 216 + 1.5 * 192 = 504.00
Lower fence:
Table 3.7 Extreme values calculation for year 2010
Source: SPSS (2015); author´s calculation
For the studied years, five outliers have been detected. They have been excluded from the calculation process: two in 2011, one in 2012 and two in 2013 (Table 3.8).
Table 3.8 Outliers calculation for the years 2010, 2011, 2012, 2013 and 2014
Year Median 1st Interquartile 3rd Interquartile Interquartile range Lower limit Upper limit Outliers No 2010 97,00 24,00 216.00 192,00 -264,00 504,00 0 2011 99,00 30,00 202,50 172,50 -229,00 461,00 2 2012 79,00 31,50 210,00 178,50 -236,00 478,00 1 2013 77,00 18,50 204,50 186,00 -261,00 484,00 2 2014 86,00 31.00 237,00 206,00 -278,00 546,00 0
Source: SPSS (2015); author´s calculation
3.2.2 Validation of the projection model
To validate the projection model, data from 2010 was used to project demand for 2013. Then the values for demand obtained from this previous projection and the real ones in 2013, available from the collected data, were compared. The number of transfused RCC was split into three age groups: 0-14; 15-64 and over 65.
Extreme Values Case Number Value RCC Highest 1 99.00 427.00 2 98.00 426.00 3 97.00 424.00 4 96.00 414.00 5 95.00 403.00 Lowest 1 5.00 0.00 2 4.00 0.00 3 3.00 0.00 4 2.00 0.00 5 1.00 0.00
The expression (3.1) is used to forecast data from 2010 to 2013 and it was replicated from the study of Borkent-Raven et al. (2010). First we calculate the RCC transfusion incidence by the average number of RCC distributed per inhabitant of Algarve per age groups (RCC transfusion incidence = Average of RCC transfusion 2010 / The number of inhabitants 2010). RCC demand is estimated by multiplying the RCC transfusion incidence (2010) with the number of inhabitants (2013):
𝑅𝐶𝐶 𝑑𝑒𝑚𝑎𝑛𝑑 2013 =𝐴𝑣𝑒𝑟𝑎𝑔𝑒 𝑛𝑢𝑚𝑏𝑒𝑟 𝑜𝑓 𝑅𝐶𝐶 𝑡𝑟𝑎𝑛𝑠𝑓𝑢𝑠𝑖𝑜𝑛𝑠 𝑖𝑛 2010
𝑁𝑢𝑚𝑏𝑒𝑟 𝑜𝑓 𝑖𝑛ℎ𝑎𝑏𝑖𝑡𝑎𝑛𝑡𝑠 𝑖𝑛 2010 × 𝑁𝑢𝑚𝑏𝑒𝑟 𝑜𝑓 𝑖𝑛ℎ𝑎𝑏𝑖𝑡𝑎𝑛𝑡𝑠 𝑖𝑛 2013 (3.1)
This specific distribution was chosen due to the available data on the population of Algarve by INE in different age groups. The forecast for 2013 displayed an average demand of 119 RCC versus the 115 units (average) transfused in 2013 (Table 3.9):
Table 3.9 Validation of the projection model for RCC in 2013
Sources: ASIS (2015) and INE (2015); author´s calculation
After the projection of RCC demand for 2013 it is important to verify whether the (average) RCC projected population and real values in 2013 can be considered as belonging to the same population. Related-Samples Wilcoxon Signed Rank Test was performed in SPSS and the null hypothesis is retained (Table 3.10).
Table 3.10 Related-Samples Wilcoxon Signed Rank Test for comparison of projected RCC demand
(average) and the real demand of RCC (average) in 2013
Hypothesis Test Summary
Null Hypothesis Test Sig. Decision
1
The median of differences between Projection for 2013 and Year 2013 equals
0.
Related-Samples Wilcoxon Signed Rank
Test
,109 Retain the null hypothesis.
Asymptotic significances are displayed. The significance level is ,05.
Source: SPSS (2015); author´s calculation
Year 2010 Projection for year 2013 Year 2013
0-14 10,93 10,49 9,80
15-64 68,59 66,30 66,23
Over 65 269,23 280,97 267,70
Total 348,73 357,76 343,73