LEAN THINKING IN HEALTHCARE PHLEBOTOMY
SERVICES: A CASE STUDY
Natacha Maria Vinhas Simões
Dissertation submitted as partial requirement for the conferral of
Master in Business Administration
Supervisor:
Profª. Doutora Ana Lúcia Martins, Assistant Professor, ISCTE Business School,
Departament of Marketing, Operations and General Management
L
E
A
N
T
H
IN
K
IN
G
IN
H
E
A
L
T
H
CA
RE
P
H
L
E
BO
T
O
M
Y
S
E
RV
ICE
S
N
atac
h
a M
ar
ia V
in
h
as
S
imõe
s
Abstract
Lean Thinking arises as a solution to address the rising costs of healthcare. This dissertation aims to evaluate the potential of applying Lean tools to healthcare phlebotomy services. Furthermore, a theoretical framework is provided in order to support the present research.
Case study’s methodology is applied to the phlebotomy service of a private and a public hospital of Lisbon where direct observation and informal interviews are performed to internal and external customers.
Value stream mapping, process activity mapping, spaghetti diagram and time value map are applied to the core process of a phlebotomy service: blood collection. Healthcare customers are identified and their perception of value is revealed. Waste is identified using the selected tool, recognised in the methodology, and improvement suggestions are proposed.
The outcome of this research shows that the application of Lean thinking can convey possible gains to healthcare phlebotomy services if improvement suggestions are implemented, as the process would become more precise and reduce the total cycle time benefiting internal and external customers, increasing process efficiency.
Considering the elimination of waste in the blood collection process, median total time’s reduction is expected to be by 47% for Lusíadas Hospital and 37% for São Francisco Xavier Hospital, in addition to reducing the median wasteful time by 54% and 46%, respectively, and the reduction of the distance covered by phlebotomists, receptionists and technical staff involved.
Keywords: Lean Thinking; Healthcare; Value Stream Mapping; Phlebotomy Services. JEL classification system: M110 – Business Administration: Production management; I100
Health: General
Resumo
Lean Thinking surge como uma solução para lidar com o aumento dos custos em saúde. Esta dissertação tem como objetivo avaliar o potencial de aplicação de ferramentas Lean aos serviços de flebotomia (colheita de sangue) em saúde, sendo fornecido suporte teórico para apoiar a presente pesquisa.
A metodologia do estudo de caso é aplicada ao serviço de flebotomia de um hospital privado e de um hospital público de Lisboa, onde observações diretas e entrevistas informais são realizadas a clientes internos e externos.
Value stream mapping, process activity mapping, spaghetti diagram e time value map são aplicados ao processo central de um serviço de flebotomia. Os clientes de saúde são identificados e a sua perceção do valor é revelada. Os desperdícios são identificados pela ferramenta selecionada, presente na metodologia, e sugestões de melhoria são propostas.
O resultado desta dissertação revela que a aplicação do pensamento Lean pode trazer possíveis ganhos aos serviços de flebotomia se as sugestões de melhoria forem implementadas. O processo tornar-se-á mais preciso e reduzirá o seu tempo total beneficiando clientes internos e externos, aumentando a eficiência do processo.
Considerando a eliminação de desperdícios no processo de colheita de sangue, espera-se que a redução da mediana do tempo total espera-seja de 47% para o Hospital Lusíadas e 37% para o Hospital São Francisco Xavier (SFX), além da redução da mediana do tempo de desperdício em 54% e 46%, respetivamente, e a redução da distância percorrida pela equipa técnica envolvida.
Palavras-chave: Pensamento Lean; Cuidados de saúde; Value stream mapping; Serviços de
flebotomia.
Sistema de Classificação JEL: M110 – Business Administration: Production management;
Acknowledgements
This dissertation is the culmination of the most important stage of my academic life and I owe it to people who were very important in helping to complete this path.
Thank you to my loving and supporting family who were always there for me and who provided the opportunity to achieve my dreams and always believed in my capabilities. A heartfelt thanks to my boyfriend throughout this journey for his help, patience and support.
I am forever grateful to Professor Ana Lúcia Martins for challenging me and giving me an opportunity to be one of her guiding students. Her motivation, dedication and guidance gave me the strength to finish my master thesis.
I would also like to thank everyone involved in this research and who participated and welcomed me in Hospital dos Lusíadas and Hospital de São Francisco Xavier. It could not have been possible without everyone’s contribution. A special thanks to Drª. Margarida Franco, Dr. João Viana and Drª. Luísa Pinto for their quick response, opportunity and availability.
A profound gratitude and thankfulness to all the wonderful people who were involved and contributed to the end of my Master journey.
Index
Abstract ... III Resumo ... IV Acknowledgements ... V 1. Introduction ... 1 1.1 Problem statement ... 1 1.2 Research question ... 2 1.3 Objectives ... 31.4 Case study approach ... 3
1.5 Scope ... 4
1.6 Dissertation structure ... 4
2. Literature review ... 5
2.1 Lean Thinking ... 5
2.2 Lean Thinking principles ... 8
2.2.1 Value ... 8
2.2.2 Value Stream ... 9
2.2.3 Flow ... 10
2.2.4 Pull ... 10
2.2.5 Perfection ... 10
2.3 Lean Thinking muda ... 11
2.4 Lean Thinking mapping tools ... 12
2.4.1 Value stream mapping (VSM) ... 12
2.4.2 Process activity mapping ... 13
2.4.3 Supply chain response matrix ... 13
2.4.4 Production variety funnel ... 14
2.4.5 Quality filter mapping ... 14
2.4.6 Demand amplification mapping ... 14
2.4.7 Decision point analysis ... 14
2.4.8 Physical structure mapping ... 15
2.5 Lean Thinking in services ... 15
2.6 Lean Thinking in healthcare ... 17
3. Methodology ... 23
3.1 Case study methodology ... 23
3.1.1 Case study characterization ... 23
3.1.2 Case study design ... 24
3.1.3 Research ethics ... 24
3.2 Data collection ... 24
3.3 Process selection ... 25
3.3 Selection of Lean Thinking tools ... 25
3.4 Research implementation steps ... 27
4. Case study ... 29
4.1 Hospital’s description ... 29
4.1.1 Hospital Lusíadas Lisboa ... 29
4.1.2 Hospital São Francisco Xavier ... 30
4.2 Process selection ... 31
4.3 Customers and value identification ... 32
4.4 Identification of waste and selection of mapping tool ... 34
4.5 Hospital Lusíadas ... 36
4.5.1 Blood collection process of Lusíadas Hospital ... 36
4.6 Hospital São Francisco Xavier ... 51
4.6.1 Blood collection process of SFX Hospital ... 51
4.7 Public and private hospitals: A comparison between the blood collection process ... 61
5. Conclusion ... 67
5.1 Objectives analyses ... 67
5.2 Research question ... 68
5.3 Results validity... 69
5.4 Limits to the research ... 70
5.5 Future research alternatives ... 71
References ... 72
Figures index
Figure 2-1 – The sustainable Lean iceberg
Figure 4-1 – Organizational Chart of Lusíadas Saúde Figure 4-2 – Organizational Chart of CHLO
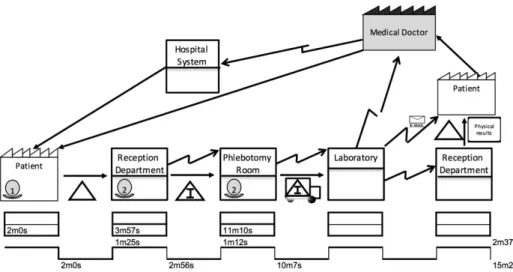
Figure 4-3 – Value stream map of the blood collection process of Lusíadas Hospital
Figure 4-4 – Spaghetti diagram of the blood collection process of Lusíadas Hospital –
Reception Department
Figure 4-5 – Spaghetti diagram of the blood collection process of Lusíadas Hospital –
Phlebotomy room
Figure 4-6 – Time value map of the blood collection process of Lusíadas Hospital Figure 4-7 – Value stream map of the blood collection process of SFX Hospital
Figure 4-8 – Spaghetti diagram of the blood collection process of SFX Hospital – Reception
Department
Figure 4-9 – Spaghetti diagram of the blood collection process of SFX Hospital – Phlebotomy
Room
Figure 4-10 – Time value map of the blood collection process of SFX Hospital Figure 4-11 – Flowchart of the blood collection process template
Graphics index
Graphic 4-1 – Percentage of activities in the first improvement suggestion: Lusíadas Hospital Graphic 4-2 – Percentage of activities in the second improvement suggestion: Lusíadas
Hospital
Graphic 4-3 – Percentage of activities in the improvement suggestion: SFX Hospital Graphic 4-4 – Comparison of percentage of activities - Lusíadas Hospital
Graphic 4-5 – Comparison of percentage of activities - SFX Hospital
Graphic 4-6 – Comparison of the reduced percentages after improvement suggestions –
Tables index
Table 2-1 – Lean evolution
Table 2-2 – Connection between the manufacturing wastes with the seven mapping tools Table 2-3 – Comparison between manufacturing, service and healthcare wastes
Table 3-1 – Evaluation of the seven wastes with five mapping tools
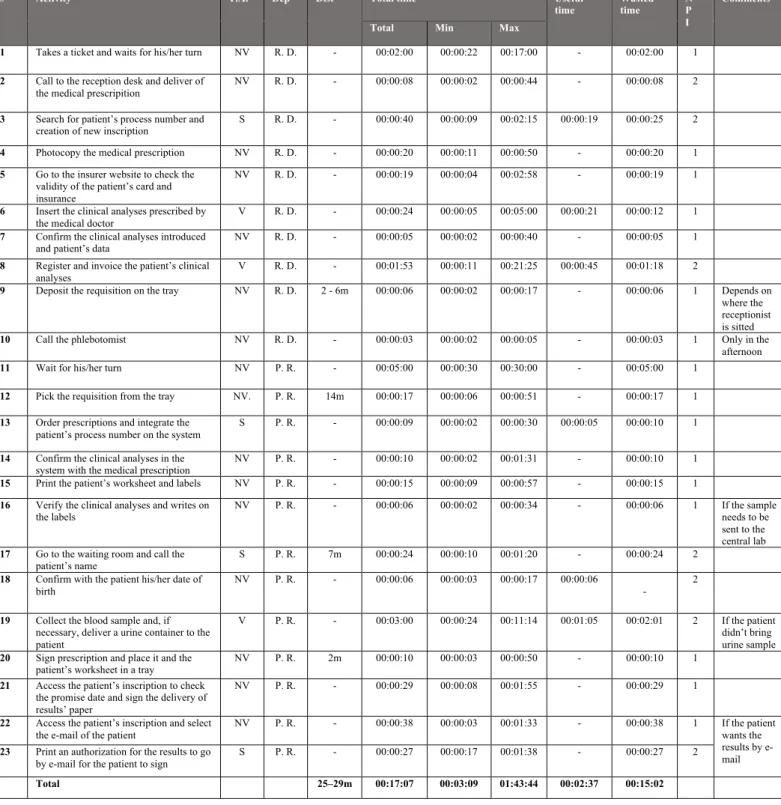
Table 4-1 – Process activity mapping of the initial status of the blood collection process of
Lusíadas Hospital
Table 4-2 – Process activity mapping of the first improvement suggestion: Lusíadas Hospital Table 4-3 – Process activity mapping of the second improvement suggestion – Lusíadas
Hospital
Table 4-4 – Process activity mapping of the initial status of the blood collection process of SFX
Hospital
Table 4-5 – Process activity mapping of the improvement suggestion – SFX Hospital Table 4-6 – Initial status of efficiency – Lusíadas and SFX Hospital
List of abbreviations
CHLO - Centro Hospitalar de Lisboa Ocidental Dep – Department
Dist - Distance
FVA - Future value adding activity IT – Information technology NPI – Number of people involved NV – Non-value adding activity PAM- Process activity mapping SA - Support activity
SFX - São Francisco Xavier Hospital TPS - Toyota Production System VA - Value adding activity VSM - Value Stream Mapping W - Waste
1. Introduction
In this chapter, the problem of the case study analysis and its contextualization will be introduced and its relevance will follow. Furthermore, by defining the research question, to which it is intended to answer, the general and specific objectives of this case study will be determined. Moreover, the scope of the investigation and its structure will be identified.
1.1 Problem statement
The Portuguese healthcare system has been for several years a number one concern and priority for the Portuguese government (Major & Magalhães, 2014). The increase of healthcare costs urges the need for governments to take action and create policies to become more efficient and effective with the use of available resources (Radnor, 2012; Luzes, 2013).
As healthcare costs increase dramatically worldwide, the development of innovative solutions to provide a more sustainable healthcare system is necessary (Radnor, 2012; Poksinska, 2010). Lean thinking in healthcare arises as a solution to improve patient safety and quality, as well as to reduce clinical errors and waiting time (Jimmerson et al., 2005; Aherne & Whelton, 2010).
Morrison et al. (2011) claim that medical doctors categorize quick turnaround time in both inpatients and outpatients as one of the critical factors of laboratory service quality since most of them depend on the timeliness of specimen tests, and therefore also in phlebotomy services.
Most of the times, the solution to deal with increasing demand and rising test volumes is to add up technicians, creating space constraints (Rutledge et al., 2010; Graban, 2012). Ng et al. (2010:51) stated that by applying Lean techniques it would “further reduce wait times between steps, and provide exactly what the next user in the process required, quality and productivity improved”.
Lean thinking is a philosophy that analyses every process which creates and adds value and helps sustain it through a continuous process (Aherne & Whelton, 2010; Radnor, 2012) and is described as “the dynamic, knowledge-driven, and customer-focused process through which people in a defined enterprise continuously eliminate waste with the goal of creating value” (Murman et al., 2002:90). It identifies and distinguishes value-added from non-value-added activities and eliminates the wasteful activities to create a sustainable and efficient system
where every process adds value and creates customer satisfaction (Aherne & Whelton, 2010; Hines et al., 2002).
Several researchers, such as Jimmerson et al. (2005), King et al. (2006) and Hawthorne and Masterson (2013), are testing and providing positive results of the implementation of Lean Thinking in healthcare. Hawthorne and Masterson (2013), both chief executive officers, applied Lean management techniques in two rural hospitals in North Carolina. After two years of the engagement in Lean thinking, these two hospitals decreased waiting time in emergency departments and surgery delays in operating rooms as well as cut more than 2 million dollars in operating and capital expenditures (Hawthorne & Masterson, 2013).
Notwithstanding the positive results obtained supporting Lean, researchers such as Dickson et al. (2009), Atkison (2010) and Radnor and Osborne (2013) stress that if Lean is not correctly applied according to the principles defined by Womack and Jones (1996) and there is no leadership commitment, Lean will fail with its objective.
According to Kim et al. (2006) and Joosten et al. (2009), Lean techniques have potential benefits in being applied to healthcare but the authors suggest further studies and share of publications among the healthcare community. To better analyse the potential benefits of the application of Lean, healthcare organisations should increase solution retention, involve senior management, pursue value creation for patients and promote long-term improvement (Mazzocato et al., 2010). Thereby, Hawthorne and Masterson (2013:136) sustain that “the Lean philosophy has a cumulative impact as it begins to define an organisational culture.”
The literature review in Lean has not been consistent in the healthcare area and further investigation, both in healthcare and phlebotomy services are required, due to its relevance in the diagnosis of clinical situations and its need to proceed with other medical procedures.
Several studies have been conducted in Portugal applying this recent methodology both in emergency departments and operating rooms (Luzes, 2013), but it is believed this is the first in Portugal that focuses on healthcare phlebotomy services. Furthermore, this dissertation will contribute to fill the gap present in the current literature by providing a theoretic framework and also an application of Lean tools in the phlebotomy services.
1.2 Research question
Based on past quality improvement in several hospital departments when applying Lean Thinking in healthcare, the following research question comes to light: How can Lean Thinking add value to healthcare phlebotomy services?
1.3 Objectives
Allway and Corbett (2002:54) declared that “only the lean approach provides service companies with the chance to be the Toyota of their industry”.
When answering the research question, this dissertation will be grounded on Lean Thinking in healthcare by attempting to demonstrate the potential benefits of applying Lean to phlebotomy services.
The general objectives of this research are:
• Analyse Lean thinking principles, tools and applications in the healthcare area;
• Analyse and benchmark possible solutions to improve phlebotomy service quality and provide a more efficient service.
To comply with the general objectives stated above, six specific objectives were identified as milestones to answer the research question:
• Map the phlebotomy service process by identifying its different stages; • Describe and compare the phlebotomy process in public and private sector;
• Identify the customers of the phlebotomy service process and their perception of value; • Distinguish value-added from non-value-added activities and eliminate the wasteful
ones;
• Identify and propose possible solutions to improve the value provided by the process; • Adapt the solutions proposed to meet public and private process requirements;
• Estimate the efficiency of proposed solutions.
1.4 Case study approach
When choosing the most appropriate research methodology, the emphasis needs to be on three different conditions which are: the type of research question, the control of the investigator in the events and the focus on contemporary events rather than historical ones (Yin, 2009).
Yin (2009) argues that the research question defines the methodology chosen. If the research question is an “how” or a “why” question, it is more likely to lead to a case study methodology due to its explanatory nature (Yin, 2009).
For this research, the methodology chosen is the case study because it “investigates a contemporary phenomenon in depth and within its real-life context” (Yin, 2009:18). Furthermore, it intends to answer the research question presented above, which focus on “how” the methodology being studied affects and impacts contemporary hospital phlebotomy services by providing insights and enabling data collection from various sources (Yin, 2009).
1.5 Scope
According to the objectives previously defined, the present study will focus on the healthcare phlebotomy services from a public and a private hospital, which will be Hospital São Francisco Xavier and Hospital Lusíadas, and will lay attention on the processes that occur in the phlebotomy services from the moment the patient enters the service to the moment the patient departures, thus, the processes to be analysed are related to the blood collection process. This delimitation of processes will be identified and scrutinised in Chapter 4 through the application of Lean thinking tools.
1.6 Dissertation structure
In order to comply with the objectives set above and to provide an answer to the research question, the dissertation outline will be organised in the following chapters:
- Introduction: the subject of the dissertation was introduced and contextualised, the research question was identified as also the general and specific objectives were determined;
- Literature review: the theoretical framework that sustains this investigation was analysed and exploited;
- Methodology: the research methodology was disclosed, the case study approach was justified and the data gathering and tools selected were revealed;
- Case study: the analysed process was identified and the application of Lean tools to assess the initial status was performed. Furthermore, improvement opportunities were suggested and discussed.
- Conclusions: the results of the research were evaluated, its validation and limitation were considered and future research alternative were suggested.
2. Literature review
In this chapter, a theoretic framework that supports this investigation regarding the main concepts about Lean philosophy will be provided. Furthermore, the origins of Lean thinking and its evolution are going to be presented. In addition, following the objectives of this case study, the five principles of Lean are discussed as well as the types of waste (muda). Value stream mapping and other Lean mapping tools are described in the theoretic framework. Finally, Lean thinking in services and healthcare are both reported as well as the challenges of its implementation.
2.1 Lean Thinking
The origin of Lean Thinking comes from the Japanese manufacturing philosophy of Toyota. Following World War II, the United States of America reduced costs by mass producing fewer types of cars. However, that was not happening in Japan (Ohno, 1988; Womack, 2002). As described by Ohno (1988) and Womack, Jones and Roos (1990), Japan was starting to shift the automotive business model, giving birth to the Toyota Production System (TPS), producing different models in small quantities.
Shortage of resources and the highly competitive automobile market are the main characteristics that created the just-in-time production system and the Kanban method, tools of Lean methodology (Hines et al., 2004). This approach was focused on eliminating waste and excess throughout the Toyota supply chain, which distinguished itself from the usual large batch sizes (Hines et al., 2004; Rich et al., 2006).
In the 70’s, the Toyota Production System (TPS) was finally applied to the overall supply chain and this marked the point where supplier manuals revealed to outsider companies the secret of the Lean approach (Womack & Jones, 2003; Hines et al., 2004). It was when the book “The machine that changed the world” was published that the western enterprises gain interest in the philosophy underneath the Toyota manufacturing (Hines et al., 2004; Rich et al., 2006).
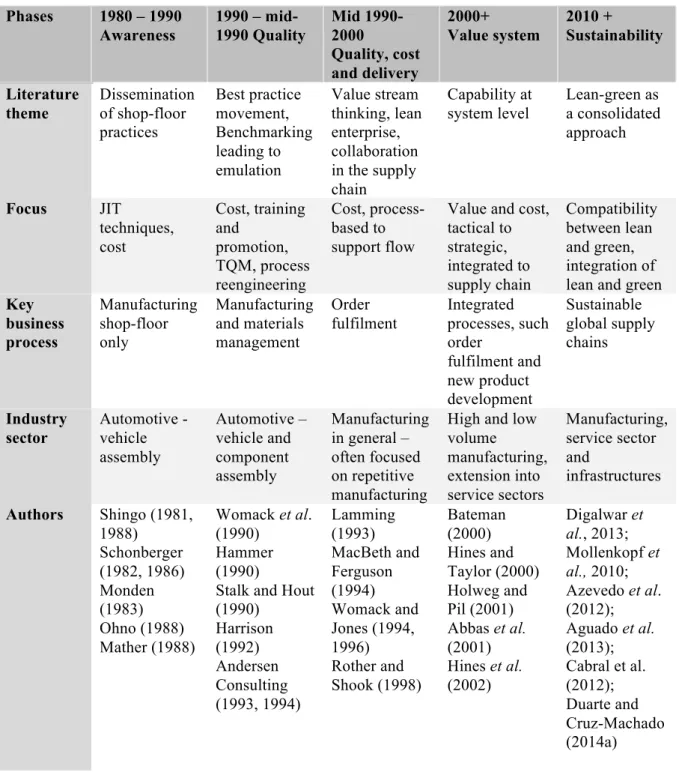
Hines et al. (2004) described a four stage lean evolution and a fifth stage was proposed by several authors, such as Jasti & Kodali (2015) and Garza-Reyes (2015), which is summarised in Table 2-1. At the awareness phase, the western enterprises tried to adopt Lean structure and techniques but failed on creating a greater impact due to difficulties in introducing the human mind-set and organisational culture, both core to the Lean approach (Hines et al., 2004). This created a weakness in dealing with variability in demand (Hines et al., 2004).
Table 2-1 – Lean evolution
Source: Hines et al. (2004:996); Jasti & Kodali (2015); Garza-Reyes (2015)
As western companies continued to adopt Lean principles (considered in sub-chapter 2.2) and techniques, they started to focus on quality (the early 1990s), quality, cost and delivery (late 1990s) and finally in 2000 in customer value (Table 2-1) (Hines et al., 2004).
The fifth column (Table 2-1) proposed by Jasti & Kodali (2015) and Garza-Reyes (2015) highlights the new trend regarding Lean and sustainability. Garza-Reyes (2015:18) state
Phases 1980 – 1990 Awareness 1990 – mid-1990 Quality Mid 1990- 2000 Quality, cost and delivery 2000+ Value system 2010 + Sustainability Literature theme Dissemination of shop-floor practices Best practice movement, Benchmarking leading to emulation Value stream thinking, lean enterprise, collaboration in the supply chain Capability at system level Lean-green as a consolidated approach Focus JIT techniques, cost Cost, training and promotion, TQM, process reengineering Cost, process-based to support flow
Value and cost, tactical to strategic, integrated to supply chain Compatibility between lean and green, integration of lean and green Key business process Manufacturing shop-floor only Manufacturing and materials management Order fulfilment Integrated processes, such order fulfilment and new product development Sustainable global supply chains Industry sector Automotive - vehicle assembly Automotive – vehicle and component assembly Manufacturing in general – often focused on repetitive manufacturing
High and low volume manufacturing, extension into service sectors Manufacturing, service sector and infrastructures Authors Shingo (1981, 1988) Schonberger (1982, 1986) Monden (1983) Ohno (1988) Mather (1988) Womack et al. (1990) Hammer (1990)
Stalk and Hout (1990) Harrison (1992) Andersen Consulting (1993, 1994) Lamming (1993) MacBeth and Ferguson (1994) Womack and Jones (1994, 1996) Rother and Shook (1998) Bateman (2000) Hines and Taylor (2000) Holweg and Pil (2001) Abbas et al. (2001) Hines et al. (2002) Digalwar et al., 2013; Mollenkopf et al., 2010; Azevedo et al. (2012); Aguado et al. (2013); Cabral et al. (2012); Duarte and Cruz-Machado (2014a)
that “the move towards greener operations and products has forced companies to seek alternatives to balance efficiency gains and environmental friendliness in their operations and products.”
As claimed by Hines et al.(2004) and Rich et al. (2006), Lean has two levels such as a strategic level and an operational level. The strategic level – Lean Thinking – is concerned with the value creation and the understanding of customer value. The operational level – Lean Production – is concerned with the shop-floor tools and application. Furthermore, Hines et al. (2004) suggest that lean production should be used in shop-floor production and lean thinking should be applied to the strategic value chain dimension. If this last dimension is forgotten, organisations only focus on cost rather than value, a common mistake in shop-floor implementations (Hines et al., 2004).
Understanding the distinction between strategic and the operational level instead of focusing around the shop-floor is crucial in order to apply the right techniques and tools to achieve lean’s objective (Hines et al., 2004).
Hines et al. (2008) contributed with an iceberg analogy called “the Lean sustainable iceberg model” by revealing that what cannot be seen is probably what is more important regarding the application of Lean. Figure 2-1 illustrates that the areas below waterline are people-related and consist of strategy and alignment, leadership and behaviour and engagement and the areas above waterline are technology, tools and techniques and process management. The meaning of this analogy is that, to establish a Lean sustainable organisation, the five elements need to be addressed and the elements below the water are what support an organisation to thrive for Lean, not just survive (Hines et al., 2008).
Figure 2-1 – The sustainable Lean iceberg
According to Graban (2012:2), “Lean helps leaders see and understand that it is not the individuals who are broken, but the system itself”. The same author posits that Lean is a methodology that enables organizations to improve service and system quality by analysing the processes within the organization as also by promoting the connection and flow between departments. Moreover, Lean philosophy can allow achieving the highest quality by reducing waiting time and preventable errors (Graban, 2012).
2.2 Lean Thinking principles
There are five Lean fundamental concepts that can extend this methodology to go beyond automobile industry to any enterprise, in any sector (Womack & Jones, 1996; Womack, 2002; Hines et al., 2002):
1. Identify what does and does not add value from the customer’s perspective – specify
value;
2. Map all the necessary steps involved in the entire value stream to identify the non-value added activities – identify value stream;
3. Continue the activities that create value without bottlenecks and interruptions – flow; 4. Adopt a pull strategy;
5. Continually identify and remove non-value added activities in the pursuit of perfection.
2.2.1 Value
The starting point of the Lean principles is specifying value. According to a Lean perspective, value is created by the producer and defined by the customer (Womack & Jones, 2003). Any process involved in the production of a good should start with the full understand of what the customer wants from it (Womack & Jones, 2003). Moreover, companies’ perspective of value is often very different from the customers’ point of view (Hines et al., 2002).
Womack and Jones (2003:19) state that “Lean thinking, therefore, must start with a conscious attempt to precisely define value in terms of specific products with specific capabilities offered at specific prices through a dialogue with specific customers”. How can waste be identified and removed if one cannot understand the customer’s value perspective? (Hines et al., 2008). In this sense, for an organization to “go Lean”, there is a need to understand and satisfy customers by knowing what they value in the value stream as also to remove waste
2.2.2 Value Stream
The value stream comprises all the actions involved in the flow of a good or service through three management tasks: problem-solving task, which consists of the activities associated with the concept of the product such as design and engineering; information
management task, which comprehends the time the order is placed throughout its fulfilment,
and physical transformation task that is related to the transformation of the product from raw materials to the finished product (Womack & Jones, 2003). Accordingly, Hines and Taylor (2000:4) refer the second principle as “… all the steps necessary to design, order and produce the product across the whole value stream…”.
Hines et al. (2002) defined four different types of activities that can be found within any organisation when doing a value stream analysis:
• Value adding (VA) activity: activities that add value to the final product and make it more valuable;
• Future value adding (FVA) activity: activities that in the future will provide value to the customer;
• Support activity (SA) or necessary non-value adding activity: activities that do not add value to the final product but are necessary to achieve it. For this activity to be eliminated, several major changes should occur that may not be possible at the moment, for example, changes to the layout or in suppliers (Hines & Rich, 1997).
• Waste (W) or non-value adding activity: activities which do not provide any value to the final product and should be eliminated immediately such as waiting time and double handling (Hines & Rich, 1997). Womack and Jones (2003) divided this action into two types such as type one muda (non-value-added activities which cannot be avoidable in the current terms) and type two muda (non-value-added activities which can be immediately avoided).
In a time where most companies outsource some part of their business, creating Lean enterprises is one possible solution to remove waste by creating alliances with the parties involved capable of analysing the entire value chain from the initial production to the final delivery to the customer (Womack & Jones, 2003). For this to occur, transparency throughout every party involved is necessary in order to comply with the principles agreed and to achieve the final objective – create an efficient value stream and remove waste (Womack & Jones, 2003).
2.2.3 Flow
The first two principles are centred in the elimination of muda which can be achieved easily with little capital investment (Basu & Wright, 2008; Swank, 2003). Flow is the third principle identified by Hines et al. (2002) and Womack and Jones (2003). It comes after the value is specified and the lean enterprise is created to identify waste along the value stream and continue the activities which create value without interruptions (Hines et al., 2002; Womack & Jones, 2003).
A very common production paradigm is that to perform efficiently it needs to be in batches. Functions and departments create the idea that every activity should be grouped by type (Womack & Jones, 2003). These batches generate long waiting time between tasks and departments regardless of keeping every member busy and equipment working hard, which does not necessarily mean efficiency (Womack & Jones, 2003).
Taiichi Ohno achieved continuous flow in small-lot production “…by learning to quickly change over tools from one product to the next and by ‘right-sizing’ (miniaturising) machines so that processing steps of different types (…) could be conducted immediately adjacent to each other” (Womack & Jones, 2003:23).
Moreover, by redefining the work of functions, departments and firms, it will help employees understand how they can add value to the value stream (Womack & Jones, 2003).
2.2.4 Pull
The fourth principle consists in producing only what the customer demands (Hines & Taylor, 2000).
Womack and Jones (2003) assert that when batches are replaced by a continuous flow of the value stream, the reduction of lead time is enormous. Lean systems provide the solution for variability in demand by producing any product in any combination (Womack & Jones, 2003). This creates an advantage because it ceases to depend on sales forecast and enables production to be made at the pull of the customer, which means customers get what they want when they desire (Womack & Jones, 2003). Furthermore, it reduces inventory level and increases return on investment (Womack & Jones, 2003).
2.2.5 Perfection
The fifth Lean principle is about seeking perfection through continuous improvement. This consists of staff working together to achieve better processes and solutions likewise to create a culture of ongoing betterment (Poksinska, 2010).
When the four initial principles are aligned, pursuing perfection is the next step. Although there is always muda to be eliminated, if transparency between every party involved in the value stream occurs (such as suppliers, assemblers, distributors, customers, employees), it is easier to create ways of adding more value (Womack & Jones, 2003). Moreover, it benefits from the positive feedback received by employees which are making improvements as it generates continuous efforts to improve (Womack & Jones, 2003).
2.3 Lean Thinking muda
Hines et al. (2002:7) states that “waste is anything that does not add value to the customer”. Shingo (1989) identified the first seven wastes (muda) related to the Toyota Production System (Hines & Rich, 1997; Hines et al., 2002; Womack & Jones, 2003):
• Overproduction – producing more than necessary; • Defects – quality problems;
• Unnecessary inventory – excessive storage;
• Inappropriate processing – use of wrong procedures or tools; • Excessive transportation – excessive movement of goods; • Waiting – long periods of inactivity;
• Unnecessary motion – poor workplace organisation.
There are differences related to muda between the terminology used in a manufacturing company and a service company. For example, when referring to defects in manufacturing, the same “waste” in a service company would be called errors or mistakes (Maleyeff, 2006). Maleyeff (2006) defined seven different categories for waste in the service area which are:
• Delays – refers to time wasted in queues or information waiting to be transmitted; • Reviews – refers to activities wasted in inspection for errors or omissions;
• Mistakes – relates to errors that cause work to be redone; • Duplication – processes which are done twice in the system;
• Movement – wastes related to the flow of information, people and equipment;
• Processing inefficiencies – sequence of activities applied inefficiently when performing a specific task;
2.4 Lean Thinking mapping tools
As discussed previously, Lean focuses on creating value by removing waste throughout the supply chain. Nevertheless, difficulties arise when doing so such as lack of visibility or the necessary toolkit to provide that visibility. In addition, it is necessary to first understand the wastes to be removed before undergoing any mapping activity (Hines & Rich, 1997).
Table 2-2 correlates seven stream mapping tools with the usefulness of its application with wastes. Mapping Tool Wastes/Structure Process activity mapping Supply chain response matrix Production variety funnel Quality filter mapping Demand amplification mapping Decision point analysis Physical structure a) volume b) value Overproduction L M L M M Waiting H H L M M Transport H L Inappropriate processing H M L L Unnecessary inventory M H M H M L Unnecessary motion H L Defects L H Overall structure L L M L H M H
Notes: H = High correlation and usefulness M = Medium correlation and usefulness L = Low correlation and usefulness
Table 2-2 – Connection between the manufacturing wastes with the seven mapping tools Source: Hines and Rich (1997:50)
2.4.1 Value stream mapping (VSM)
Rother and Shook (2003:3) defined Value Stream as “all the actions (both value added and non-value added) currently required to bring a product through the main flows essential to every product”. Value Stream Mapping consists of analysing the flow of raw materials and information through the system and identifying waste by creating actions and visual representation to eliminate it (Rother & Shook, 2003; Abdulmalek & Rajgopal, 2007).
Piercy and Rich (2009) acknowledged Value Stream Mapping as the best tool to identify waste and improvement opportunities because it lists all the activities in the entire process and the resources used in each activity.
Rother and Shook (2003) refer that VSM is constituted by three steps:
1. Select a product family: which consists in grouping similar products which go through the same processes to be the aim of improvement (Chen & Cox, 2012);
2. Value-stream manager: selecting a person who is responsible for the Value Stream and knows the entire information flow of a product and has the capacity to improve a product family’s value stream (Rother & Shook, 2003);
3. Using the mapping tool: “Value-stream mapping can be a communication tool, a business planning tool and a tool to manage your change process” (Rother & Shook, 2003:9). First, draw the current state of the supply chain for that product family. Second, use the information gathered on the first stage to develop a lean future-state drawing. Finally, begin the implementation programme to achieve the lean future-state (Rother & Shook, 2003).
2.4.2 Process activity mapping
The engineered approach behind this tool is to map the entire order fulfilment process which enables to identify the lead time and productivity (Hines & Taylor, 2000; Hines et al., 2002).
This technique comprises the elimination of waste by providing high-quality products and services through information flow. Hines and Rich (1997) and Hines et al. (2002) defined five phases of process analysis which consists in:
1. Analysis of the flow of processes; 2. Identification of waste;
3. Analyse if the process is done in the most efficient way;
4. Analyse the better flow pattern by using a different layout and transport routeing; 5. Analyse every stage of the system to understand and distinguish value-added from
non-value-adding activities.
2.4.3 Supply chain response matrix
Time compression and logistics movement are the key factors behind this tool. Hines and Taylor (2000:32) affirmed that “the objective of this mapping is to improve, or maintain, the service level of the entire chain but with fewer costs” and consists in the evaluation of
inventory and identification of lead time constraints throughout the supply chain. This tool has a high correlation with muda related to waiting and unnecessary inventory (Hines & Rich, 1997).
2.4.4 Production variety funnel
According to Hines et al. (2002), this visual technique maps the differences in the product variants along the supply chain. Production variety funnel has a medium correlation and usefulness with “unnecessary inventory” and “inappropriate processing” because it helps to understand how the supply chain operates and where a product becomes very customer specific which can create inventory constraints. It provides an opportunity to identify product rationalisation and to target inventory reduction (Hines et al., 2002; Hines & Rich, 1997).
2.4.5 Quality filter mapping
Hines and Taylor (2000) mentioned that this tool focuses on identifying where quality problems exist in the order fulfilment process, therefore has a high correlation and usefulness with “defects”. This mapping technique shows three different types of quality problems in the supply chain (Hines & Rich, 1997; Hines, et al. 2002):
- Product defects: goods which are not caught by inspection and are passed on to customers;
- Scrap defects: defects produced in an enterprise caught by inspection;
- Service defects: problems that the customer experience which is not related to the product itself but the documentation or inappropriate delivery related to that product.
2.4.6 Demand amplification mapping
This tool provides the quantity of each product along the supply chain as also inventory holdings, scheduling, batch sizing policies and inventory decisions (Hines & Rich, 1997). Moreover, the ability to show how demand varies gives the opportunity to show the bullwhip effect (Hines & Rich, 1997; Hines et al., 2002).
2.4.7 Decision point analysis
Decision point analysis identifies the point in the entire supply chain where products “…stop being made according to actual demand and instead are made against forecasts alone” (Hines & Rich, 1997:57). It is useful in the short-term to analyse if the processes are aligned with a pull or push philosophy. In the long-term, allows planning future events if the decision point analysis is changed (Hines & Rich, 1997).
2.4.8 Physical structure mapping
This is one of the tools alongside with demand amplification mapping which analyses the overall structure of the supply chain (Hines & Rich, 1997). It provides a visual diagram (by number of firms involved or by cost adding) where Hines and Rich (1997:58) stated that “the area of each part of the diagram is proportional to the number of firms in each set or cost-adding process.” Furthermore, it helps understand how the industry operates and see potential areas where there is a need for further development (Hines & Rich, 1997).
2.5 Lean Thinking in services
Allway and Corbett (2002) discuss the existence of five challenges in service companies when confronted with such competitive market and unprecedented economy which are rising customer expectations, revenue pressures, competitive pressures, increasing expenses and regulatory pressures.
The extension and application of Lean beyond automobile industry were first identified “in the application to general supply chain management” (Piercy & Rich, 2009:56). From a strategic perspective, when applying Lean across other sectors it is still possible to comply with the main objective which provides customer value and follow a Lean strategy by integrating other approaches, even though some shop-floor tools are not suitable (Hines et al., 2004).
Several authors studied the application of Lean thinking in services such as Allway and Corbett (2002), Swank (2003), Hines et al. (2008a), Piercy and Rich (2009), Bonaccorsi et al. (2011) and Radnor and Osborne (2013). They have reported evidence in further exploring and implementing Lean in the service industry.
Allway and Corbett (2002) and Radnor et al. (2012) advocate that service industries are starting to shift their business improvement models to comply with these manufacturing techniques focused on customer and process operations. Accordingly, the authors argue that every organisation which adopts Lean thinking will rapidly discover the benefits of such tool and improve their operations to become more efficient.
Maleyeff (2006) state that service companies usually combine two to three transformations whereas manufacturing companies focus only on physical transformations. This combination of transformations may be physiological, exchange, informational, location and storage. Moreover, it may be difficult to apply explicitly the five lean principles because, for instance, in a service company all the work is started by the customer – pull strategy - as also it is very likely to experience long waiting time in poorly managed services (Maleyeff, 2006).
Radnor and Osborne (2013) acknowledged three challenges for Lean’s implementation in public services: the product being “manufactured” is a service rather than a good; operating processes are often internal; the key success factors vary from the private sector. Radnor and Osborne (2013) and Radnor et al. (2012) argue that because of the differences between the public and private sectors, and therefore in the service user, it is difficult to recognise the value of the customer. Moreover, the authors state that in the service area there is little influence on demand because their design is led by capacity. Additionally, “the private sector ‘raison d’etre’ of Lean is on efficiency and cost reduction – yet public services must also consider effectiveness and equity” (Radnor & Osborne, 2013:268).
Hines et al. (2008a) analysed and compared the application of Lean Thinking in the legal sector of the Portuguese court system with the Welsh Legal Services Commission and proposed a tentative model in order to apply Lean Thinking to public legal system.
Maleyeff (2006) conducted an exploratory study to analyse and critique several internal service systems using a Lean perspective and found several common structural characteristics which helped Lean practitioners in the service area to focus on where to improve. The common structural characteristics acknowledged were the importance of information, significant task variability, process flow across departments or functions, many handoffs of information, numerous management and technical reviews, hidden costs and benefits, no explicit motivation for urgency, no one size fits all solution.
Chen and Cox (2012) applied a Lean strategy to the office’s processes of a small manufacturer in order to grow the efficiency of the design department to increase customer satisfaction. Swank (2003) reviews the application of a Lean initiative in an insurance company which delivered positive results thereby reducing labour costs by 26% and the rate of reissues due to errors by 40%.
The Boston Consulting Group (2009) illustrated two examples of the application of Lean philosophy to services and healthcare. In 2008, the University of North Carolina faced a challenge of a long length of stay per patient – a measure of effectiveness and efficiency. The hospital managers understood that if they reduced the length of stay by 10%, they would free up nearly 80 beds per year resulting in an operation profit of almost $30 million dollars (Boston Consulting Group, 2009).
Despite the positive results, oftentimes Lean is failing in its implementation (Radnor & Osborne, 2013). Furthermore, as highlighted by Radnor et al. (2012) and Radnor and Osborne (2013), Lean’s implementation depends on the context. The authors argue that the origin of this
context (manufacturing industry) affects but does not preclude its implementation in the public sector.
One of the challenges of lean implementation in service companies before undergoing the transformation is believing in lean methodology as an improvement tool and understanding and admitting that the organization needs to undergo this process and is ready for change (Allway & Corbett, 2002; Atkinson, 2010).
Implementation phases
Allway and Corbett (2002) indicate a five-step guide for lean implementation. The first phase consists of assessing your current state by mapping the entire flow of processes, identifying opportunities for improvement and to diagnose the current level of operational excellence.
The second phase is to determine the target state by identifying the objectives that need to be accomplished, which mean a vision to be pursued by the company (Allway & Corbett, 2002).
The third phase comprises the stabilization of operations. It comprehends the guarantee that stage two goes according to the plan by conducting the vision in the right direction and ensuring that the company keeps on the right track (Allway & Corbett, 2002).
When stage four is reached, organizations get to the phase of optimizing opportunities. These include redesigning the physical layout and flow of processes by ensuring a “…continuous flow of material, people and information” (Allway & Corbett, 2002:51).
Phase five is the institutionalization of the Lean approach. To reach a sustainable and continuous operational improvement capability, Lean thinking “needs to become the ‘mantra’ for the organization…” (Allway & Corbett, 2002:51). This stage is achieved through communication and continuous reviews of the flow of processes as also by continuously assessing and applying Lean techniques (Allway & Corbett, 2002).
2.6 Lean Thinking in healthcare
One of the first key areas of Lean service was the retail industry due to the similarities of the product flows with the automotive industry (Piercy & Rich, 2009). The second area was Lean in hospital management which did not focus on a product itself but in patients in the healthcare system (Piercy & Rich, 2009; Graban, 2012).
Researches in Lean healthcare have laid emphasis on the acquisition of hospital supplies and also the patient’s flow through treatment processes (Piercy & Rich, 2009). Furthermore,
several authors such as Miller (2005), Aherne and Whelton (2010) and Radnor et al. (2012) provided positive evidence in the application of Lean in Healthcare.
Radnor et al. (2012) recognised the growing evidence in terms of both tangible results (reduction in waiting times, reduction of costs and errors) and intangible results (increased employee motivation and customer satisfaction). Notwithstanding, the authors assert that Lean in Healthcare is still failing to deliver its promise regarding the impact on organisational performance and medical staff (Radnor et al., 2012).
Frequently, healthcare processes are focused on the medical staff instead of the patient which usually is the only person who sees all of his journeys (Poksinska, 2010). Sometimes, 10 minutes was the only value-added time compared to the total time (the author refer “hours”) the patient spent at the hospital (Poksinska, 2010). Since healthcare processes are not clearly defined, it creates “inconsistency in care, unreliable access to resources and processes, and constant interruptions, which in turn implies inefficiencies, long waiting times, increased potential for errors, and worker frustration” (Poksinska, 2010:322).
Poksinska (2010) developed a three-step guide to explain the meaning of Lean healthcare. First, it is the recognition of the patient as crucial and the most important customer as also to understand the patient/customer point of view (Fillingham, 2007; Poksinska, 2010). The second step is to categorize patients by laying emphasis on their different needs, conditions and value streams (Poksinska, 2010; Radnor et al., 2012). The most used Lean tool in healthcare is the Value Stream Mapping (VSM) because it enables to map the flow of patients throughout their treatments and different processes (Poksinska, 2010). In addition, it helps medical staff to recognize the need to improve the entire system and not just some processes or the individual itself (Jimmerson et al., 2005; Poksinska, 2010). The third step consists of “…standardised work, waste reduction and continuous flow”, which are the most mentioned methods and principles when improving processes by removing waste such as waiting time (Poksinska, 2010:322). The patient should be able to flow through departments without any delays and interruptions. For this to happen, medical care staff has to identify bottlenecks and the root of issues in the system (Poksinska, 2010, Allway & Corbett, 2002).
Radnor (2011) compares the seven original wastes with service and healthcare wastes (Table 2-3).
Original Wastes Service Wastes Healthcare Wastes Transportation Delay on the part of customers
waiting for service, for delivery, in queues
Transportation: Staff walking to the
other end of a ward, central equipment stores for commonly used items
Inventory Duplication: having to re-enter data,
repeat details of forms
Inventory: excess stock; patients waiting
to be discharged, waiting lists Motion Unnecessary movement: queuing
several times, poor ergonomics in the service encounter
Motion: unnecessary staff movement,
syringes and needles at opposite ends of the room
Waiting (delay) Unclear communication: confusion
over product or service use, wastes of seeking clarification
Waiting for: patients theatre staff results,
prescriptions and medicines, doctors to discharge patients
Overproduction Incorrect inventory: out-of-stock, unable to get exactly what was required, substitute products
Overproduction: requesting unnecessary
tests, keeping investigation slots “just in case”
Over or
inappropriate processing
Opportunity lost to retain or win
customers, ignoring customers, rudeness
Over processing: duplication of information, asking for patients’ details several times
Defects Errors in the service transaction,
product defects, lost or damaged goods
Correction: readmission because of
failed discharge, adverse drug reactions, repeating tests because correct information was not provided
Table 2-3 – Comparison between manufacturing, service and healthcare wastes Source: Radnor (2011:2)
Some of the problems that clinical laboratories face are “…the decreasing availability of technical staff, complaints about work-related stress, increasing test menu and limited space”, which can be answered by applying Lean principles and tools as also to achieve better laboratory turnaround time while reducing costs (Melanson et al., 2009:919).
Successful cases arise from the application of Lean in healthcare. Alegent Health in Nebraska reduced the laboratory turnaround time by 60% by applying Lean methods; ThedaCare in Wisconsin reduced waiting time from first call to orthopaedic surgery by 14 weeks to 31 hours and; in South Dakota, Avera McKennan avoided spending 1,25 million dollars in new department construction by reducing patient stay by 29% (Graban, 2012).
Peerson et al. (2006) demonstrated that if the redesign of pre-analytic processes takes place, it can decrease laboratory turnaround time. Additionally, the authors affirm that by constantly applying Lean’s fifth principle, they kept identifying improvement opportunities as also waste in order to unceasingly improve their laboratory service.
The costs of healthcare are increasing worldwide at a fast pace which urges the need to develop initiatives for cutting costs in the healthcare industry (Radnor, 2012). Lean Thinking arises as a possible solution to meet that need since cost reduction may be a consequence of Lean’s value enhancing. As proven by the successful cases above, which are only examples of the many applications of Lean in the healthcare area, Lean has established its reputation in the healthcare industry.
Barriers and challenges of Lean implementation in healthcare
Poksinska (2010) states that the first challenge to implement Lean in healthcare is to convince staff that it is possible to use Lean thinking in healthcare. Often what is said is that patients are not cars and healthcare has a completely different organisation than the automotive industry (Poksinska, 2010). However, when staff is trained, layers of waste are exposed and staff understands that applying Lean techniques can provide many benefits in removing waste in processes (Poksinska, 2010; Hines, et al. 2008; Radnor et al., 2012). Nevertheless,
training is very hard due to the lack of people who understand and can teach Lean in healthcare (Poksinska, 2010).
Healthcare organisations are still very hierarchical thereupon making medical doctors the top decision makers (Poksinska, 2010). Medical doctors are highly trained to be autonomous, which goes against Lean philosophy that requires teamwork, good communication and collaboration between medical staff (Poksinska, 2010; Radnor et al., 2012).
Since departments in healthcare are very dependent on each other, improving the entire system needs to acknowledge all the departments involved and not just focus on solving problems at one unit which may cause problems at another unit (Poksinska, 2010). Although it is possible to improve specific situations, a holistic perspective is required to be able to expand the improvement process to the entire system. Departments need to cooperate and work together in order to improve the entire value stream (Poksinska, 2010).
2.7 Summary
The origin and main empirical and academic contributions in Lean thinking were highlighted in this chapter. Lean’s evolution throughout times with different characteristics and constraints was exposed as well and the “Lean sustainable iceberg model” was visited.
Following, the five fundamental principles were identified as well as their relevance in the Lean methodology. Regarding the aim of this case study, Lean thinking muda and its tools were described, plus, the correlation of the seven stream mapping tools with the usefulness of its application with wastes is also considered.
A comprehensive analysis of Lean’s application in services and healthcare is given in order to identify and acknowledge its potential as also the positive results already provided by evidence.
The implementation phases suggested by Allway and Corbett (2012) in order for an organisation to “go Lean” and apply its tools and techniques is stressed as well as the barriers and challenges of its implementation in the healthcare sector.
As reviewed in the literature above mentioned, there are several applications of Lean thinking in services and the healthcare sector but, as exploited by Luzes (2013), there is none related to the phlebotomy services in Portugal, which translates into a gap in the literature that is intended to be filled with this dissertation.
3. Methodology
The present chapter is intended to contextualize the methodology chosen, aiming at the objectives of this case study and answer the research question. The characterization of case study research is described as also its design and research ethics. The sources of evidence that support this research are revealed as well as an explanation of each. Furthermore, the selection of the process that is going to be analysed is disclosed. A link between the seven wastes with five value stream mapping tools is performed, thus providing an understanding of how the tools are selected. To conclude, the steps which guide this case study are reported.
3.1 Case study methodology
According to the research question previously defined as “how can Lean Thinking add value to healthcare phlebotomy services?”, and in accordance with Yin (2009), the research methodology which applies best regarding this type of question is the case study. Furthermore, to understand social phenomena and real-life events such as managerial processes, the appropriate methodology is the case study (Yin, 2009).
What supports the choice of this methodology of research is the use of two sources of evidence which are going to be applied in this study and that distinguish case studies from history: direct observation and interviews with the people involved in the research (Yin, 2009; Eisenhardt, 1989).
This study benefits from applying this methodology because it “relies on multiple sources of evidence” and it is supported by theoretical propositions which help to guide data collection and data analysis (Yin, 2009:13).
As acknowledged by Eisenhardt (1989:547), one example of limitation to the case study research methodology is that “case study theory building is a bottom up approach such that the specifics of data produce the generalizations of theory”. According to this position, the conclusions to be obtained refer only to the applied cases and cannot be generalized for other services and industry.
3.1.1 Case study characterization
Regarding Yin (2009), when answering the research question, this case study presents two strategies:
- A descriptive strategy: this research will analyse the patient flow through phlebotomy services and will provide insights concerning the activities involved and wastes;
- An exploratory strategy: in addition to using Lean tools to map the patient’s flow and the description of activities, improvement opportunities will be identified and suggested based on a Lean Thinking approach.
3.1.2 Case study design
According to Yin (2009) and Eisenhardt (1989), the present case study is classified and structured as a multiple case study, specifically the phlebotomy services of a private and a public hospital. The process that occur from the moment the patient enters the service until his/her departure will be observed and analysed.
3.1.3 Research ethics
To perform the present dissertation in Hospital de São Francisco Xavier and Hospital dos Lusíadas, an authorisation was conceded by the Technical Directors of the Phlebotomy Services of both hospitals in November 2016.
As mentioned previously in sub-Chapter 1.4 and as stressed by Yin (2009), the control of the investigator in the events is an important condition when choosing the most appropriate research methodology. Subsequently, the methodology chosen was the case study. Since the investigator develops professional activity in the same area and will play an external observer role, the investigator’s position and influence in the insights and findings acknowledged will be neutral.
3.2 Data collection
For the development of this case study, there are two information sources that are in accordance with Yin (2009) and Eisenhardt (1989) suggestions: direct observation and informal interviews.
Regarding the direct observation, the information will be obtained through the observation of the main aspects of the phlebotomy service. All the activities and resources necessary will be observed and identified to map the process from the moment the patient enters the service to the moment he/she departures.
Informal interviews will be conducted with technicians/phlebotomists and receptionists involved in the phlebotomy process. The purpose of these interviews is to identify the resources needed and a number of technicians per shift as well as to map the different stages of the phlebotomy service.
The data collection was performed from the 9th of November of 2016 until the 11th of January of 2017 and the data treatment will be based on the Microsoft® office tools, particularly
Microsoft® Excel. The number of days spent in Lusíadas Hospital to collect data was 17 days with an average of 3 hours each day and performed on different days in different weeks and in the morning and in the afternoon to collect the maximum of possible different events. Moreover, 10 days were spent collecting data in São Francisco Xavier Hospital, with an average of also 3 hours per day and performed in the morning, since in this hospital, the blood collections are only performed in the morning.
3.3 Process selection
The process to be analysed will be selected from the phlebotomy services of the public and the private hospital, and will consider three different criteria:
1. Core processes
Based on the data gathering through informal interviews and direct observation of processes performed in the phlebotomy services which impact the service quality perceived by the customer, the process selected should strongly influence the value of the overall service from the moment the patient enters the phlebotomy services until it leaves the service since it is one of the first means of diagnosis.
2. Information flow across departments
Maleyeff (2006) suggests that information is the most important characteristic in a service company and the focus should not be on the documents analysed itself but on the information flow and the information that is transmitted.
Furthermore, Maleyeff (2006:681) stated that “handoffs, for example, are known to be a major source of medical errors”. The considered process should rely on the transmission of information across functions and departments and it should be recognized by technicians and receptionists as a source of errors if there are misunderstandings in the way the information is transmitted.
3. Waste
As the ultimate goal of Lean thinking is “focused on the removal of waste, which is defined as anything not necessary to produce the product or service” (Nave, 2002:74), the selected process should consider the existence of waste and that waste should be acknowledged by the technicians and receptionists through the informal interviews.
3.3 Selection of Lean Thinking tools
The tools’ selection will be based on the literature review concerning Lean Thinking. To remove waste inside companies which do not add value to the final service, a combination
of Lean thinking tools can be used to identify waste and help remove or reduce it (Hines & Rich, 1997).
Firstly, an overview of the initial situation to gather information and an understanding of the process will be conducted (Rother & Shook, 2003). Rother and Shook (2003) advocate that this strategy provides the ability to look at the bigger picture as well as a visual representation of the process by highlighting wastes and its source. After the overview of the value stream, a descriptive analysis will be performed.
Lean Thinking tools’ selection depends on the type of waste that organisations need to reduce or eliminate (Hines & Rich, 1997; Hines et al., 2002). The value stream mapping toolkit, which enables the visualization of material and information flows as well as understanding where are the sources of wastes (Singh, et al. 2010), has been applied consistently in multiple researches across the healthcare service area (Jimmerson et al., 2005; Miller, 2005; Kim et al., 2006; King et al., 2006; Mazzocato et al., 2010).
Additionally, Hines et al. (2002) classified through a “yes, maybe, no” matrix, the ability of five value stream mapping tools (process activity mapping, production variety funnel, quality filter mapping, demand amplification mapping, process costing) to be linked with the seven wastes (overproduction, waiting, transport, inappropriate processing, unnecessary inventory, unnecessary motion and defects) firstly described by Shingo (1989). Table 3-1 reveals the matrix developed by Hines et al. (2002).
Table 3-1 – Evaluation of the seven wastes with five mapping tools Source: Hines et al. (2002:35)
Wastes Mapping Tool
Process activity mapping Production variety funnel Quality filter mapping Demand Amplification Mapping Process Costing
Overproduction maybe no maybe maybe yes
Waiting yes maybe no maybe yes
Excessive transportation
yes no no no no
Inappropriate processing
yes maybe maybe no yes
Unnecessary inventory
maybe maybe no yes yes
Unnecessary motions
yes no no no yes