DOI: http://dx.doi.org/10.1590/2446-4740.07517 Volume 34, Number 2, p. 115-126, 2018
Introduction
Hepatocellular carcinoma (HCC) is a type of liver cancer, and according to the World Health Organization (WHO) (Gomes et al., 2013), it is the second leading cause of death due to cancer, with approximately 70-85% deaths due to primary liver neoplasm (Gomes et al., 2013). The HCC is a malignant tumor that affects the main liver cells and occurs frequently worldwide, with more than one million cases per year (Audigier et al., 2015; Zheng and Wu, 2015). This cancer can develop owing to: excessive alcohol intake, infection with hepatitis B and/or C, and induction of carcinogenic agents (Kikuchi, 2015).
The anomaly diagnosis is performed with medical examinations using specialized equipment, such as ultrasound (special sound waves used in processes to examine organs inside the body), ultrasonography (the technique that produces images using sound waves to view structures inside the body), and computed tomography (Clavien et al., 2012; Cambridge..., 2018). However, when diagnostic failures occur due to hypervascularized or hypovascularized nodules, liver biopsy procedures are needed (Kikuchi, 2015).
Minimally invasive surgical treatments exist for this pathology, such as percutaneous ethanol injection (PEI), transarterial chemoembolization (TACE) and radiofrequency ablation (RFA) the last one being the most applied treatment worldwide (Haemmerich et al., 2001). There is evidence that RFA has advantages over PEI regarding HCC local control (Bouza et al., 2009).
Besides the aforementioned treatments, other techniques such as cryoablation (local tumor burning by freezing), high-intensity microwave ablation (similar to RFA; however, with frequencies of approximately 2450 MHz), and laser ablation (beams are confined through optical fiber) also exist. The treatment costs are illustrated in Table 1 (Pinheiro, 2016).
Development of radiofrequency ablation device for surgical hepatocellular
carcinoma treatment in agreement with Brazilian standards
Gilvandson Costa Cavalcante
1*, Flávio Ferreira Lima
2, Murilo Venturin
3, Ricardo Pezzuol Jacobi
1,
Suélia de Siqueira Rodrigues Fleury Rosa
31 Department of Mechanical Engineering, Technology College, University of Brasília, Brasília, DF, Brazil. 2 Department of Electrical Engineering, Technology College, University of Brasília, Brasília, DF, Brazil. 3 Department of Electronic Engineering, Gama College, University of Brasília, Brasília, DF, Brazil.
Abstract Introduction: Many studies have been carried out on the main causes of hepatocellular carcinoma (HCC) to identify suitable diagnosis methods and treatments to combat the disease. However, high equipment costs and the lack of hepatic-ablation technologies manufactured in Brazil encourage the design and implementation of a solution based on normative principles. Methods: The analysis and description of equipment features were the first steps
in defining the design requirements and constraints. Equipment functionalities were evaluated with three assays
set by NBR-IEC 60601-2-2. Results: The assays of output control adjustment accuracy, output control adjustment monotonicity, and signal quality evaluation using the crest factor (CF) for the equipment showed thresholds superior to the aforementioned standard. Conclusion: State-of-the-art studies have contributed the equipment construction. The construction process was validated by assays to ensure the equipment functionality with raw materials at acceptable costs. The test results showed the superiority of the equipment in relation to the assays proposed by the standard NBR-IEC 60601-2-2. However, to convert the prototype into a commercial product, other analyses are necessary.
Keywords Accuracy, Monotonicity, Crest factor, Hepatocellular carcinoma.
This is an Open Access article distributed under the terms of the Creative Commons Attribution License, which permits unrestricted use, distribution, and reproduction in any medium, provided the original work is properly cited.
How to cite this article: Cavalcante GC, Lima FF, Venturin M, Jacobi RP, Rosa SSRF. Development of radiofrequency ablation device for surgical hepatocellular carcinoma treatment in agreement with Brazilian standards. Res Biomed Eng. 2018; 34(2):115-126. DOI: 10.1590/2446-4740.07517
*Corresponding author: Department of Mechanical Engineering, University of Brasília, Campus Darcy Ribeiro, Asa Norte, CEP 70910-900, Brasília, DF, Brazil. E-mail: gilvandson.costacavalcante@gmail.com
According to data provided by the National Sanitary Surveillance Agency (Agência..., 2017), there exists no equipment manufactured in Brazil, as shown in Table 2.
The goal of this study is the development of an ablative high-frequency prototype (400 kHz) with a maximum
power of 50 WRMS. The prototype construction was
performed in agreement with the NBR-IEC 60601-2-2 (Associação…, 2013) standard. To supply the production methodologies of a radiofrequency (RF) signal generator circuit and power control circuit, the according voltage, current, and temperature measurements, and conditioning circuits were described. Additionally, to evaluate the equipment construction process and measurement calibration, the tests were developed regarding the output control adjustment accuracy, output control monotonicity adjustment, and sinusoidal signal quality. Thereby, the operation requirements and product security could be tested in order to allow product industrialization and to obtain an ANVISA license (Agência..., 2017).
Methods
Ablation equipment features
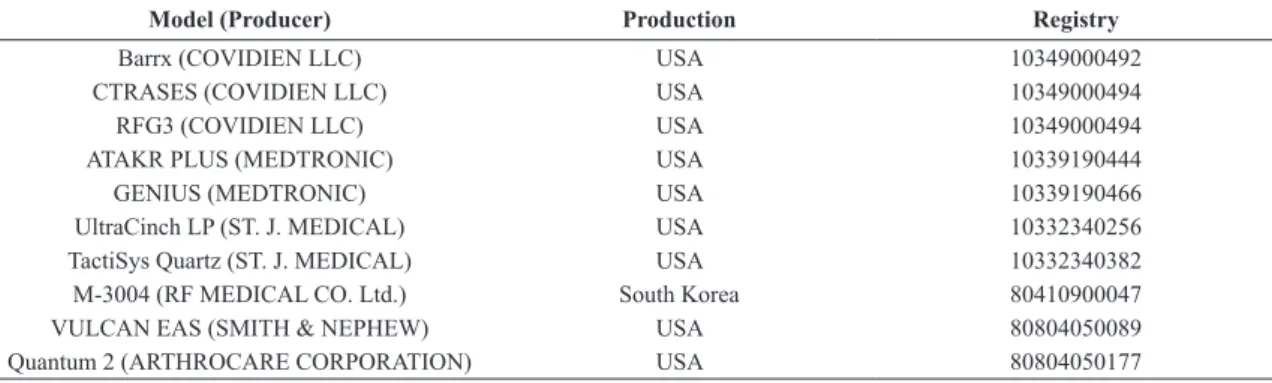
Figure 1 illustrates the block diagram of the prototype. Two operation modes exist: manual and automatic. In automatic mode, the protocols are preset, and in manual mode, the physicians can freely choose the start/end power parameters, power steps, procedure finalization time, and the maximum temperature threshold for procedure interruption. Additionally, the prototype allows RS232 serial communication to send electric current, voltage, and temperature transmission parameters to other devices. These data facilitate the evaluation of
electrical characteristics in the ablation region to verify cellular-necrosis occurrence for temperatures greater than 50 °C (Haemmerich et al., 2001) or to identify the occurrence of roll-off via an increasing impedance, described by the tissue charring point (Alba et al., 2011).
Block (1) represents a 400 WRMS-switched-mode
power supply with a 110/220 VCA-supply and a continuous 24 VDC-output voltage with efficiency greater than 80%. In addition, it has protection against opposite surge currents, short circuits, overload, and overheating. The output of the power supply is connected to two voltage regulators (LM7805 and LM7812, Fairchild, California, USA) (Fairchild…, 2008) with outputs of 5 and 12 VDC. The output is fully shielded to avoid interference.
Block (2) is responsible for 400 kHz-sine wave signal generation and prepared to receive a power adjustment signal from the control board of 5-50 WRMS. In addition, this board contains circuits to measure the voltage and current applied to the liver during the procedure. These measurements are used to calculate power and impedance according to the ablation evolution.
Block (3) is the power control board that adjusts the voltage level provided by the power supply to the RF generator board to define the power applied to the liver. The adjustable output levels of the control board measure 1.2-24 VDC, with sufficient electric current to ensure 50 WRMS. The voltage variations are controlled by the Raspberry PI III using ADC/DAC converters and proportional-integral-derivative (PID) controllers through the software implemented on it.
Block (4) performs the digital equipment management conducting voltage, current, and temperature measurements. Table 1. Internationally produced technologies used for liver cancer treatment (Pinheiro, 2016).
Ablation Type Equipment costs (USD) Costs per section/electrode (USD)
Cryoablation < 190,000.00 3,750.00 (needle)
Laser 30,000.00-75,000.00 3,000.00 (section)
Microwave 65,000.00
-Radiofrequency 25,000.00 800.00-1,200.00 (electrode)
Table 2. Hepatic Ablation equipment manufactured internationally for cancer treatment.
Model (Producer) Production Registry
Barrx (COVIDIEN LLC) USA 10349000492
CTRASES (COVIDIEN LLC) USA 10349000494
RFG3 (COVIDIEN LLC) USA 10349000494
ATAKR PLUS (MEDTRONIC) USA 10339190444
GENIUS (MEDTRONIC) USA 10339190466
UltraCinch LP (ST. J. MEDICAL) USA 10332340256
TactiSys Quartz (ST. J. MEDICAL) USA 10332340382
M-3004 (RF MEDICAL CO. Ltd.) South Korea 80410900047
VULCAN EAS (SMITH & NEPHEW) USA 80804050089
The Raspberry PI adjusts the power applied to the liver and sends the measured information to the touch screen, block (5).
Block (5) represents the user interface block. Power, impedance, temperature values, and procedure time are displayed on the screen. In addition, it provides the input values to configure the prototype operation.
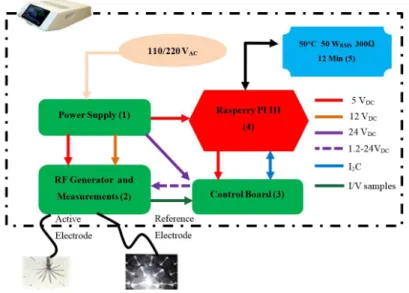
RF generation board and data acquisition
Figure 2 shows a block diagram of the RF generator board with the corresponding voltage and current measurement stages. The circuit is composed of: 1) astable oscillator adjusted to a 400 kHz-frequency; 2) non-overlapping clock (NOC); 3) voltage driver; 4) frequency inverter circuit; 5) protection filter against voltage return from RF generator to control board; 6) a filter to convert the square wave into a sinusoidal wave; 7) peak detector circuit for voltage measurements; 8) operational amplifier to maintain 5 VDC-maximum excursion; 9) filter to avoid interference in the voltage measurement circuit; 10) peak detector circuit for current measurement; 11) operational amplifier to maintain 5 VDC-maximum excursion; 12) filter to avoid interference in the current measurement circuit.
NOC
The output signal of the astable oscillator is delivered to the NOC circuit, which divides the signal into two parts with phases shifted by 180°. In addition, the NOC circuit negates the possibility that the square wave
might appear as a trapezoidal wave. This procedure is necessary to avoid simultaneous switching of power transistors, which are trigged by the frequency inverter input. In this setup, two combinational circuits built with NAND ports (74HC00-Philips, Amesterdã, Netherlands) (Philips…, 1997) and nine Schmitt–Trigger logic inverters (74HC14-Nexperia, Nijmegen, Netherlands) (Nexperia…, 2017) were applied. The construction topology of this circuit is described in (Kavak, 2004).
Voltage drive
The voltage driver (IR2110-International Rectifier, California, USA) (International…, 2005), Figure 2, block 3, acts as a signal amplifier for signals originating from the NOC circuit (5-12 VDC). After amplification, the signals are used to switch the MOSFET power transistors (IRF540-Vishay Siliconix, California, USA) (Vishay…, 2013a), which are connected to the input of the frequency inverter circuit. Thus, it is possible to ensure that the electric current coming from the control circuit is sufficient to provide the power required for ablation.
Frequency inverter
Figure 2. In this figure, the blocks (1 = A), (2=B), (3=C), (4 = D), (5 = E), (6 = F), (7 = G), (8 = H), (9 = I), (10 = M), (11 = L) and (12 = J) represent respectively, the oscillator, the Non-Overlapping Clock (NOC), voltage driver, frequency inverter, filter Butterworth, filter Butterworth, peak detector, operational amplifier, filter Butterworth, peak detector, operational amplifier and filter Butterworth.
a diode (1N5408-Vishay Siliconix, California, USA) (Vishay…, 2013b) to avoid voltage return caused by a discharge of the electromagnetic field stored in the transformer. It is observed that when the voltage applied to the central tap increases, the amplitude of the square signal and consequently the power increase. This circuit has a theoretical efficiency of 75% (Frenzel, 2015). Butterworth filter design
The PI topology of the filters presented in Figure 2 has distinct functions in the RF generator circuit; all filters are second-order and low-pass band. In Figure 2, the filter (block 5) prevents a voltage return from the power transformer to the control circuit. This filter contains a
73 µH-inductor and two capacitors of 4.7 µF, and has a cutting frequency of 8.597 kHz. In block (6), in addition to converting the square wave into a sinusoidal wave, the circuit further matches the impedance of the frequency inverter to that of the liver. It has an 83 µH-inductor and two capacitors of 2.5 nF, and has a cutting frequency of 349.39 kHz. Moreover, in blocks (9) and (12), the filter removes high frequency components from the output signals of the voltage and current circuits of the liver. It possesses a 104 µH-inductor and two capacitors of 10 µF, and has a cutting frequency of 4.94 kHz.
were applied to obtain Equation 1 (Alexander and Sadiku, 2008). According to the modeling, capacitance
C12 does not contribute to the system behavior when the input signal is applied to this capacitor, Figure 2, block F. After completion of the modeling process, Equation 1 must obey the parameterization rules of Equation 2, which represents the standard function of a second-order low-pass filter (Vernetti, 2003).
( ) ( 4 20)
2
2 4
4 20
20 4 20
1 / 1 1 1 1 L C H s L S S
L C S S
RC L C
R
= =
+ +
+ + (1)
( ) 2 i
i i
b
H s K
S a S b
=
+ + (2)
Owing to the use of low-pass filters, the quality factor (Qp) was determined with Equation 3. The higher the quality factor, the closer are the poles to the imaginary axis in the complex plane, thereby increasing the selectivity of the filter (Vernetti, 2003).
20 20 4 4 20 i p i
b RC C
Q R
a L C L
= = = (3)
Considering the characteristic behavior of a liver ablation region, which varies its impedance as a function of rising temperature, Qp, specified in Figure 2, block (6), was evaluated. This way, a resistive load of 50 Ω was established as a reference for the initial calculation of
Qp with Equation 3, because the value of Qp for this load is ≤ 0.707 (Vernetti, 2003). Using the resistive, capacitive, and inductive values presented for the filter in Figure 2, block (6), the estimated value was 0.27. This value means that the highest output voltage Vout occurs when the angular frequency is ω = 0 for a DC voltage (see Equation 5 (Vernetti, 2003)). However, this value undergoes changes during ablation and, therefore, the analysis of this variation was considered in the tests. Regarding the other filters, the impedances at the outputs are fixed and larger than 50 Ω. This results in higher quality factors than that calculated for the filter of Figure 2, block (6).
The calculation of the maximum power necessary for ablation depends on the maximum amplitude of Vout of the filter in Figure 2, block (6), applied at the location of liver ablation. To perform the described analysis, it was considered that H(s) = Vout / Vin (Equation 1) and the derivative of Vout, as a function of ω, was equated to zero
for s = jω. The result obtained from this mathematical manipulation together with Equation 3 corresponds to Equation 5 (Alexander and Sadiku, 2008).
4 20
1
p bi
L C
ω = = (4)
2
2 4
4 20
1 1
0, 1- , 0.707 2
- 1
p p
p
d
Q J L
d L C Q
R
= ω=ω ≥
ω
ω ω + + (5)
With Equation 5, it was possible to evaluate the two situations. Firstly, when Qp ≤ 0.707, the maximum
Vout will occur for ω = 0 (case cited above). Secondly, when Qp >> 1, a voltage peak occurs at ω, Equation 5
(Vernetti, 2003).
Further, Qp indicates that the filter is more selective
and must be considered in the monotonicity adjustment because the power peaks rise according to the quality factor function.
The inductor filters in Figure 2, blocks (5) and (6), were constructed with an air core, and the circuit capacitors of block (5) had a threshold voltage of 240 V (commercial value) due to the applied maximum voltage of 24 VDC. In block (6), the filter capacitors had a threshold of 2000 V to avoid device heating. The other filters use ferrite core inductors and electrolytic capacitors with thresholds of 25 V.
Power transformer design
The power transformer belongs to the frequency inverter circuit in Figure 2, block (4). During its development, precautions were taken to avoid Joule heating that would result in power losses. These losses are only perceptible when the temperature is higher than 80 °C. In addition, laminar transformers were avoided due to high-power losses by Foucault currents when the power transformer is operating at high frequencies (Xiaojing et al., 2016).
Therefore, during the transformer development, the turns ratio between primary and secondary coils was 1:10. This ratio was designed to achieve the 50 WRMS. The power transformer was installed in an in vitro assay with swine liver. The turns ratio was chosen according to the acquisition facility on the national market of switched-mode power supplies. In this study, the applied ferrite core specified the magnetic flux density according to the fabrication guidelines (Thornton Eletrônica Ltda) (Thornton…, 2018) and in agreement with Equations 6 and 7.
RMS
V = PZ
(6) 4 RMS e V B fNA = (7)
the impedance maximum Z when roll-off occurs during ablation. The obtained value is used in Equation 7 to determine the magnetic flux density (B) considering a frequency (f) of 400 kHz, a turn number of 3 in the primary coil (N) for a center-tap connected coil, and the ferrite core’s effective area (Ae).
The inductance factor (AL) is defined in
Equation 8: N represents the turn number of 3 for
a center tap-connected coil and L the transformer’s primary coil inductance. These two parameters are used for impedance matching realized by the PI circuit construction, Figure 3, using electronic components of the national market.
2 L
L A
N
=
(8)
The employed transformer core was a ferrite model, NEER-28/17/12-2200-IP12E (Thornton Eletrônica Ltda) (Thornton…, 2018). Regarding an operation at high frequencies with acceptable losses, the ferrite core should not possess air gaps nor 90°-corners.
The inductance factor (AL) of the ferrite core determines
L of the transformer’s primary and secondary coil.
However, the coil inductance is negligible when the coil does not comprise this material. Here, the inductance of the transformer’s primary coil was measured with ferrite, using an ICEL RLC bridge, L301, with 17 µH. However, as the ferrite possesses AL = 2.2 µH, according
to the data sheet, the inductance value is 19.8 µH. Despite the difference between the value specified by the manufacturer and the measured one, there was no impact on the equipment development.
Current, voltage and temperature measurement circuits
These circuits were used to evaluate the biophysical parameters during ablation. Power and impedance are the main liver incident power control parameters.
The transformers used to measure current and voltage were developed according to the power transformer construction methodology. However, the current measurement transformer has two turns with a 2.5 mm-wire gauge to ensure smaller efficiency losses under heating during measurement.
To measure the current, the transformer is connected in series through an electrode inserted into the patient ablation area, and parallel for a voltage measurement device. The samples obtained from the current transformer flow through a resistor, which facilitates the current to voltage conversion. The signal amplitudes are conditioned by peak detectors and standardized through amplification and filtration. The signals are further sent to an ADC (ADS1115 -Texas Instruments, Dallas, EUA) (Texas…, 2018) converter input that is part of the control circuit.
The temperature measurement is performed by a 100 kΩ-thermistor (PTC). The measurement circuit was built connecting a 4 kΩ-resistor in series to the thermistor. The voltage values provided by the divisor are collected by the ADC (ADS1115).
The discrete values are sent from the ADC to the Raspberry PI through a serial communication bus using the I2C protocol. The ADC and DAC (PCF8591-Nexperia, Nimega, Netherlands) (Nexperia…, 2013) converters share the same bus. The manufacturer recommends the insertion of an electrolytic 10 µF-capacitor into the bus to avoid interference and spurious noise caused by high
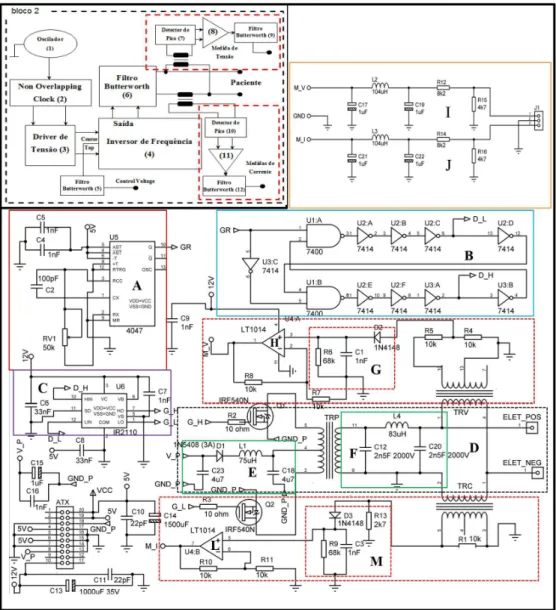
Figure 3. This diagram represents the circuit responsible for the power control. The DAC converter’s output voltage is amplified and transmitted
frequencies. The cables through which these protocols are transmitted were shielded to increase their immunity against such interference.
Power control board
In the liver tumor ablation process, the RF generator board is controlled by voltage variations in the transformer’s center tap provided by the control circuit shown in Figure 3.
The power control board is the interface between Raspberry PI III and RF generator block. The following components were used for the board design: DAC (PCF 8591); ADC; operation amplifier (Op-amp, LT1014-Linear, California, USA) (Linear…, 1990); adjustable voltage regulator (LM317-Texas Instruments, Dallas, USA) (Texas…, 2017a); bipolar power transistors; bipolar transistor (BC556-ON Semiconductor, Colorado, USA) (On Semiconductor, 2007); fuses and relay.
The DAC converter receives data from the Raspberry PI via the I2C communication protocol. This data represents a discrete analog control signal with 8-bit-resolution. The analog output of the device is amplified by an AmpOp that has its output connected to the transistor base (BC556) to adjust the voltage for the voltage regulator (LM324-Texas Instruments, Dallas, USA) (Texas…, 2017b) in order to obtain a voltage range between 1.2-24 VDC.
The voltage regulator output excites the base of three power transistors through 150 Ω-resistors with the goal to control the current that flows through these transistors when the drain is connected to the RF generator board. Without the resistors, the current would not circulate evenly, thereby inducing heat in each transistor.
The transistors provide enough current to supply the necessary power to the ablation process through the RF generator board. This control board, shown in Figure 3, has relay and a fuse protection in the output signal. The relay is triggered by GPIO (input/output port of Raspberry PI). The output voltage in this circuit is only released by a digital management command in the relay.
The ADC (ADS1115) converter has 4 analog input channels. Hence, three of them are used for reading current, voltage, and temperature. The last input channel is not employed. All channels have a maximum excursion of an input voltage of 0-5 V.
Digital management
Digital management is conducted by the Raspberry PI III, which uses an ARMv8 quad-core BCM2837 processor with a clock frequency of 1.2 GHz and Wi-Fi connection. The embedded system that performs ablation functions was developed in Python. Using this programming language, it was possible to develop the graphic interface, serial communication using the
transmission protocols RS232 and I2C, temperature
stop or timeout, and power control through the proportional-integral-derivative (PID).
Voltage, current and temperature measurement calibration
In this process, for the calibration of voltage and current, a digital oscilloscope (Tektronix, TDS1001B), with a 40 MHz-bandwidth and a sampling rate of 500 MS/s was applied. The calibration curves for these measurements were obtained using purely resistive loads that could support until 100 Wrms, although only 50 Wrms was supplied by the equipment, in accordance with NBR-IEC 60601-2-2 (Associação…, 2013). In the calibration process, the electrode impedance was also considered. At the same time, the data derived from the ADC converter was stored in the Raspberry. Then, using MATLAB software, it was possible to obtain the calibration functions concerning voltage and current using linear regression.
The calibration of the temperature measurement, using PTC, in the ablation region was performed using the Raspberry PI. For this purpose, a Python program was developed to capture the analog information of the temperature sensor and to store them with a resolution of one degree in an Excel spreadsheet. A water container was used and then the temperature was changed. In parallel a DT858L multimeter that has a type k thermocouple with an error of 0.8 °C was used, collecting the same information. With both data and using the same process applied at voltage and current calibration, the calibration function about temperature was obtained.
Bench tests
During the ablation equipment development phase, the equipment was calibrated using the RMS values for voltage and current. However, to obtain the declared power, in compliance with the standard NBR-IEC 60601-2-2 (Associação…, 2013), the RMS power was applied in conjunction with the CF obtained at each point of the curve. These adjustments consider small distortions of the equipment’s output signal to avoid performing a rough approximation by multiplying the value by 2. To guarantee test robustness, the temperature of the power transformer was monitored using a GM320 digital pyrometer and maintained at approximately 50 °C. Thus, it was possible to verify that the power transformer operated within the technical characteristics defined during development. The temperature was required to not exceed 80 °C in order to avoid power loss due to excess temperature.
exceed 1º, thereby being much lower than the maximum value of 8.5° recommended by the IEC 60601-2-2 (Associação…, 2013). The values were evaluated with Equation 9 such that XL is equivalent to the inductive reactance. The parameter F is the standard frequency of 1 kHz and L the resistor’s intrinsic inductance. The impedance phase θ was calculated according to Equation 10.
2
L
X = πj FL (9)
arctan | |
L X
R
θ=
(10)
In addition, the following ambient conditions were used to employ the proposed test benches: a temperature of 22.3 °C, a relative humidity of 52%, and an atmospheric pressure of 1021.6 hPa.
A stainless-steel plate measuring 16.0×11.9 cm was used as neutral electrode connected to the equipment’s ground, according to the NBR-IEC 60601-2-2 (Associação…, 2013). For the RF output, an active umbrella-type nitinol electrode was developed and validated (Pinheiro, 2016). The loads were integrated between the active and neutral electrodes for the assays.
Output control adjustment accuracy
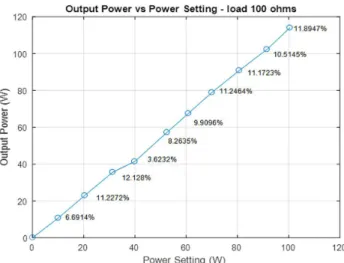
To validate the measurements performed in the assays, the values obtained by the ablation equipment were compared to those measured with the oscilloscope. In the evaluation of the measurement accuracy of the ablation equipment, a load of 100 Ω was adopted, according to the NBR-IEC 60601-2-2 (Associação…, 2013). The ablation equipment was adjusted manually with an initial power of 5 and a final power of 50 WRMS. The power increase was programmed in ten steps of 5 WRMS for ten minutes. Each second, the power control dataset was automatically stored in the spreadsheet. The output power dataset obtained by the oscilloscope was stored similarly. Through these datasets, it was possible to verify the error of the output control adjustment accuracy.
Output control monotonicity adjustment
For conformity, the mean and maximum thresholds of the—in the liver ablation region applied—power were evaluated. With the tests, it was possible to evaluate the existence of power peaks and to verify whether the applied power remains constant within the error range
defined by NBR-IEC 60601-2-2 (Associação…, 2013),
regarding the declared loads defined for the equipment. The active RF electrode cable is 0.5 m away from the reference electrode cable. To comply with NBR-IEC 60601-2-2 (Associação…, 2013), the resistors used in the assays need to have a threshold larger than 50% of the maximum power provided by equipment with a load of 50 WRMS.
Signal analysis using Crest Factor (CF).
The CF indicates the wave distortion degree in relation to the sine wave in the time domain (Richman, 2002). Regarding the identification of a pure sine wave, i.e., no
distortion, the CF is 2 (Richman, 2002). Thus, the
evaluation of this parameter in the ablation prototype is important to verify whether the ablation equipment’s output signal is close to the pure sine wave’s signal. The closer the obtained value is to 1.414, the greater is the burn efficiency (Schneider-Junior and Abatti, 2005).
P P P
RMS RMS RMS
V RI I
CF
V RI I
= = = (11)
In order to evaluate the CF, the same methodology was applied for the load association in the monotonicity test. The peak voltage (VP) and VRMS measurements were performed with a digital oscilloscope, considering a maximum power of 50 WRMS or approximately 100 W of peak power.
Results
All the performed tests had an equipment output signal with a frequency of 406.05 kHz and a standard deviation of 1.25 kHz. Because the preset frequency was 400 kHz, this resulted in a variation of ±1.51%.
Control adjustment accuracy test
The results of the control adjustment accuracy tests are shown in Figure 4, according to NBR-IEC 60601-2-2 (Associação…, 2013). The curve shows the peak power obtained in the load through measurements using a digital oscilloscope and the power measured in the equipment proposal that was displayed on the touch screen. The relation between the values obtained using the oscilloscope and equipment (in percentage points) is shown in Figure 4.
Monotonicity assay
In this assay, the mean and maximum power thresholds applied in the loads defined due to estimated variation of the liver impedance in the ablation process were evaluated (see points shown in Figure 5).
In this evaluation, it was verified that the percentages of output power errors measured by the oscilloscope in relation to those obtained by the ablation equipment at the critical points highlighted in the curve (Figure 5) are well below that specified by NBR-IEC 60601-2-2 (Associação…, 2013), that is 20%. The highest error found was 7.97%.
CF measurement
Figure 4. In this graph, it is possible to evaluate the measurements using a digital oscilloscope and the equipment proposal. The errors range from 3.623-12.128%. The declared output power values of the equipment are on the Y-axis and the power values established by the equipment to be supplied at its output are on the X-axis.
Figure 5. Monotonicity assay. In this figure, the values of the critical points are shown. The X-value refers to the non-inductive resistive load at
the instant of power application and the Y-value to the mean and maximum declared power of the equipment.
Discussion
State-of-the-art surveys motivated the elaboration of this prototype for hepatic ablation. The development stages and details on the RF generation board, power control, and measurement circuits with their respective calibrations were described. The successful operation of each proposed circuit was validated with assays.
In the literature, there are no details of other equipment available for comparative analysis. Because of this, standard NBR-IEC 60601-2-2 (Associação…, 2013) was used for conformity assessment of the equipment. The innovation is defined by the fact that there is no product available in Brazil certified by ANVISA (Agência…, 2017).
Regarding the output control adjustment accuracy tests, it can be seen that the maximum control power error in relation to the declared output power measured 12.128%. The value is below the defined error of 20% NBR-IEC 60601-2-2 (Associação…, 2013). Thus, the result shows that the equipment proposal works in accordance with NBR-IEC 60601-2-2 (Associação…, 2013) in relation to this type of test. This power control is essential to prevent hurting patients and to reduce the carbonization rate, ensuring a larger firing diameter and maximum efficiency in fighting the disease. Besides, the current and voltage measurements conducted by the equipment in the liver revealed to be reliable. These parameters give information on liver power and impedance values. The precision of these measurements, besides ensuring efficient control of the power applied to the liver, facilitates procedure interruption via impedance measurements in a coherent way, thereby avoiding damage to many healthy cells and simultaneously containing cellular metastasis.
In the monotonicity test, the accuracy of the PID control developed in Python and the performance of the power control board constructed to receive the PID information were evaluated. In this evaluation, it was verified that the percentages of output power errors measured by the oscilloscope in relation to those obtained by the ablation equipment at the critical points highlighted in Figure 5 are well below that specified by NBR-IEC 60601-2-2 (Associação…, 2013). Further, the declared loads were within 50-385 Ω, as defined in the design. These results prove that the impedance range, defined by the declared loads, satisfies the experimental data obtained by (Alba et al., 2011). They verified an impedance variation of 65-130 Ω in experiments performed on an ex vivo liver. It is noteworthy that with the impedance increase during the burning process, the quality factor of the filter increases as demonstrated by its theory. Moreover, for impedances greater than 130 Ω, which result in quality factors greater than
0.713 at a 400 kHz-frequency, power peaks occur, and neuromuscular stimulation may occur; this indicates that muscle contractions may occur in a manner that could cause injury to the patient, as described in the theoretical part. This problem was solved by applying power controlled strictly by software.
The CF is fundamental in assessing the quality of the pure sine wave applied to the liver. If the amplitude of the sinusoidal signal is less than 200 Vp, the signal does not cut the tissue, but dissects and coagulates it. Further, regarding a DC voltage, it does not produce voltaic arcs and sparks that can cause burns (Schneider et al., 2007). The CF measurements found that the equipment output has a sinusoidal signal with very low distortion when applied to impedances greater than 50 Ω. The results show that for resistive loads above 50 Ω, the errors remain at approximately 2% compared to the pure theoretical sine wave (Figure 6), thereby indicating that there is a slight distortion in the equipment output. However, it does not influence the ablation performance.
Moreover, for resistive loads lower than 50 Ω, the errors can reach 12.37%, thereby representing a distortion of the pure sine signal of approximately 10% higher compared to higher loads, Figure 6. This distortion is expectable because the load decrease reduces the Qp of the filters.
The reduction implies that the poles shift away from the imaginary axis in the complex plane and, consequently, degrade the selectivity of the filter. This causes an amplitude amplification of the high frequency components leading to an increase of the CF error.
The evaluation of Qp of the PI filter inserted at the
frequency inverter output demonstrated that there was no increase in signal distortion with increasing load. This results in an increase of the filter selectivity up to the expected maximum threshold, as stated in the theory. Although, relatively high distortion occurs for impedances less than 50 Ω, the signal format remains sinusoidal and it is not possible to visually perceive any distortion on the oscilloscope screen.
The results showed that the equipment was able to fully comply with the NBR-IEC 60601-2-2 standard (Associação…, 2013). The thresholds were much higher than the recommended ones, thereby proving the technical capability of the equipment. However, there exists still need for new technical tests to verify the electromagnetic compatibility and the identification of the linear dynamic system to propose equipment improvements; for this, it is important to evaluate the dynamic characteristics in more detail. In addition, clinical trials are necessary to fully comply with the ANVISA recommendations (Agência…, 2017) and transform this prototype into a commercial product.
of the discrete electronics, inductors, transformers, and printed circuit boards made was approximately $ 742.00. The high-impact polystyrene case (HIPS) for the circuits cost $ 303.00, which leads to a total sum of $ 1,045.00. Evidently, the prototyping costs are higher than the production costs.
Acknowledgements
The authors are grateful to the Ministério da Saúde
(MS) – Brazil, for the financial support.
References
Agência Nacional de Vigilância Sanitária – ANVISA. Consultas [Internet]. Brasília: ANVISA; 2017. [cited 2017 Jul 25]. Available from: https://consultas.anvisa.gov.br
Alba J, González-Suárez A, Trujillo M, Berjano E. Theoretical and experimental study on RF tumor ablation with internally cooled electrodes: when does the roll-off occur? Conf Proc IEEE Eng Med Biol Soc. 2011; 2011:314-7. https://doi. org/10.1109/IEMBS.2011.6090082. PMID: 22254312.
Alexander C, Sadiku M. Fundamentos de circuitos elétricos. São Paulo: McGraw-Hill Companies Inc.; 2008.
Associação Brasileira de Normas Técnicas – ABNT. NBR-IEC 60601-2-2. Equipamento eletromédico, Parte 2: Requisitos particulares para a segurança básica e desempenho essencial de equipamentos cirúrgicos de alta frequência e acessórios cirúrgicos de alta frequência. Rio de Janeiro; 2013. 80 p.
Audigier C, Mansi T, Delingette H, Rapaka S, Mihalef V, Carnegie D, Boctor E, Choti M, Kamen A, Ayache N, Comaniciu, D. (2015). Efficient lattice boltzmann solver for patient-specific radiofrequency ablation of hepatic tumors. IEEE Transactions on Medical Imaging, 34(7), 1576-1589. http://dx.doi.org/10.1109/TMI.2015.2406575.
Bouza C, López-Cuadrado T, Alcázar R, Saz-Parkinson Z, Amate JM. Meta-analysis of percutaneous radiofrequency ablation versus ethanol injection in hepatocellular carcinoma. BMC Gastroenterol. 2009; 9:31.
Cambridge University Press. Cambridge dictionary [Internet]. Cambridge: Cambridge University Press; 2018. [cited 2018 Feb 25]. Available from: https://dictionary.cambridge.org/ pt/dicionario/ingles/ultrasound
Clavien, P., Lesurtel, M., Bossuyt, P., Gores, G., Langer, B., & Perrier, A. Recommendations for liver transplantation for hepatocellular carcinoma: an international consensus conference report. Lancet Oncol. 2012; 13(1):e11-22. https:// doi.org/10.1016/S1470-2045(11)70175-9. PMID: 22047762.
Fairchild Semiconductor. LM78XX [Internet]. California: Fairchild Semiconductor; 2008. [cited 2018 Jan 1]. Available from: www.fairchildsemi.com
Frenzel LE Jr. Eletrônica moderna, fundamentos, dispositivos, circuitos e sistemas. São Paulo: McGraw Hill; 2015. p. 760-761.
Gomes MA, Priolli DG, Tralhão JG, Botelho MF. (2013). Hepatocellular carcinoma: epidemiology, biology, diagnosis
and therapies. Rev Assoc Med Bras. 59(5), 514-24. https:// doi.org/10.1016/j.ramb.2013.03.005. PMID: 24041910.
Haemmerich D, Staelin ST, Tungjitkusolmun S, Lee FT Jr, Mahvi DM, Webster JG. Hepatic bipolar radio-frequency ablation between separated multiprong electrodes. IEEE Trans Biomed Eng. 2001; 48(10):1145-52. https://doi. org/10.1109/10.951517. PMID: 11585038.
International Rectifier. IR2110 [Internet]. California: International Rectifier; 2005. [cited 2018 Jan 1]. Available from: www.irf.com
Kavak, F. A sizing algorithm for non-overlapping. Linköping, Suécia: Institutionen för systemteknik; 2004. p. 581-83.
Kikuchi LOO. (2015). Análise da sobrevida de pacientes com carcinoma hepatocelular atendidos no Instituto do Câncer do Estado de São Paulo [tese]. São Paulo: Universidade de São Paulo.
Linear Technology. LT1014 [Internet]. California: Linear Technology; 1990. [cited 2018 Jan 1]. Available from: www. linear.com
Nexperia. PCF8591 [Internet]. Nimega: Nexperia; 2013. [cited 2018 Jan 1]. Available from: www.nexperia.com
Nexperia. 74HC14 [Internet]. Nijmegen: Nexperia; 2017. [cited 2018 Jan 1]. Available from: www.nexperia.com
On Semiconductor. BC556 [Internet]. Colorado: On Semiconductor; 2007. [cited 2018 Jan 1]. Available from: www.onsemi.com
Philips Semiconductors. 74HC00 [Internet]. Amesterdã: Philips Semiconductors; 1997. [cited 2018 Jan 1]. Available from: www.semiconductors.philips.com
Pinheiro MM. Desenvolvimento de um eletrodo expansível de níquel-titânio para ablação hepática por radiofrequência. Brasília: Universidade de Brasília; 2016.
Richman P. Wave factors for rectifiers with capacitor input filters, and other high crest-factor loads. IEEE Trans. Ind. Electron. Control Instrum. 2002; 21(4):235-41.
Schneider B, Bernardi R. Abatti PJ. A faísca eletrocirúrgica como causa da eletroestimulação e da queimadura DC. In: Müller-Karger C, Wong S, La Cruz A, editors. IV Latin American Congress on Biomedical Engineering 2007: Bioengineering Solutions for Latin America Health. IFMBE Proceedings; 2007 Sep 24-8; Berlin, Heidelberg. USA: Springer; 2007. p. 881-85.
Schneider-Junior B, Abatti PL. Desenvolvimento de um equipamento eletrocirúrgico com saída não chaveada. Revista Brasileira de Engenharia Biomédica; 2005; 21(1):15-24.
Texas Instruments. LM317 [Internet]. Dallas: Texas Instruments; 2017a. [cited 2018 Jan 1]. Available from: http://www.ti.com
Texas Instruments. LM324 [Internet]. Dallas: Texas Instruments; 2017b. [cited 2018 Jan 1]. Available from: http://www.ti.com
Thornton Eletrônica Ltda. Consultas [Internet]. São Paulo: Thornton; 2018. [cited 2018 Apr 5]. Available from: http:// www.thornton.com.br/home.htm
Vernetti JD. Introdução à teoria de redes. Manaus: ULBRA; 2003. p. 97-107.
Vishay Siliconix. IRF540 [Internet]. California: Vishay Siliconix; 2013a. [cited 2018 Jan 1]. Available from: www.vishay.com
Vishay Siliconix. 1N5408 [Internet]. California: Vishay Siliconix; 2013b. [cited 2018 Jan 1]. Available from: www.vishay.com
Xiaojing L, Wang Y, Zhu J, Guo Y, Gang L, Chengcheng L. Calculation of capacitance in high-frequency transformer
windings. IEEE Transactions on Magnetics; 2016; 52(7):1-4.
Zheng Q, Wu M. Evaluation of therapeutic effect of