Jorge Miguel Martins Santos
Bachelor of Science in Chemical and Biochemical Engineering
Understanding the Microbial Ecology
and Ecophysiology of Enhanced
Biological Phosphorus Removal
Processes through Metabolic Modelling
and Experimental Studies
Dissertation to obtain the degree of Master in Chemical and
Biochemical Engineering
Supervisor: Adrian M. Oehmen, PhD, FCT/UNL
Jury:
President: Prof. Dr. Maria da Ascensão Carvalho Fernandes Miranda Reis Examiner: Dr. Gilda de Sousa Carvalho Oehmen
Bachelor of Science in Chemical and Biochemical Engineering
Understanding the Microbial Ecology and
Ecophysiology of Enhanced Biological Phosphorus
Removal Processes through Metabolic Modelling and
Experimental Studies
Dissertation to obtain the degree of Master in Chemical and
Biochemical Engineering
Supervisor: Adrian M. Oehmen, PhD, FCT/UNL
Jury:
Understanding the microbial ecology and ecophysiology of enhanced biological phosphorus removal processes through metabolic modelling and experimental studies
Copyright Jorge Miguel Martins Santos, FCT/UNL, UNL
Acknowledgements
I would like to express my deep gratitude to my supervisor Dr. Adrian Oehmen for his guidance, patient and useful advices.
I would also like to thank Dr. Gilda Oehmen, Ricardo Marques, Mónica Carvalheira, and Margarida Carvalho for their support in the laboratory.
In addition, I would like to thank Mr. Oliver Schraa and Dr. Spencer Snowling, President and Vice-President of Business and Product Development of Hydromantis Environmental Software Solutions, Inc, respectively, for their collaborations in the implementation of the model developed into GPSX-6.2 program.
Por fim, gostaria de dedicar esta tese às pessoas que me apoiaram nestes últimos anos:
- Mário Dessa e Cristina Barata -Mauro, Tânia e Joana
-Hélder Pereira e Isabel Pereira
-Pais e irmãos, em especial ao meu irmão Daniel Santos
A todos,
Abstract
The enhanced biological phosphorus removal (EBPR) process in activated sludge systems has become a widely applied wastewater treatment technology to control eutrophication. The success of this process relies on the sludge enrichment with polyphosphate accumulating organisms (PAOs), while one of the main causes for its failure is due to microbial competition between PAOs and another group of organisms known as the glycogen accumulating organisms (GAOs). The microbial ecology and ecophysiology of these two groups have been investigated through metabolic modelling and experimental studies in order to provide a better understanding of EBPR systems.
This thesis focuses on researching the P removal efficiency and metabolic behaviour of an enriched culture containing two PAOs: Tetrasphaera-related organisms and Accumulibacter, which were acclimatized with casamino acids as sole carbon source in a sequencing batch reactor (SBR). Both organisms were identified through fluorescence in situ hybridization (FISH), and this culture demonstrated anaerobic P release, glycogen hydrolysis, a very low poly--hydroxyalkanoates (PHA) synthesis and high casamino acids uptake; followed by aerobic P uptake, glycogen formation and a very low PHA oxidation. Different carbon sources (glucose, acetate, propionate, glutamate, aspartate, glycine and casamino acids) were studied through batch tests inoculated with sludge from the main SBR. Through experimental data, it was suggested that Accumulibacter were responsible for the uptake of volatile fatty acids (VFAs), and Tetrasphaera-related organisms were likely responsible for both glucose and amino acids uptake.
This thesis also focuses on the development of a model that combines a PAO-GAO metabolic model with activated sludge model no. 2d (ASM2d) in collaboration with Hydromantis Environmental Software Solutions, Inc.. The combined model was implemented in the GPS-X software and will provide a new and advanced platform for wastewater treatment modelling, which will be available to practitioners.
Resumo
O processo de remoção biológica de fósforo (EBPR) em sistemas de lamas activadas tem vindo a ser cada vez mais utilizado no tratamento de águas residuais a fim de controlar a eutrofização. O sucesso deste processo depende do enriquecimento das lamas com organismos acumuladores de polifosfatos (PAOs). Por outro lado, uma das principais causas responsáveis pelo seu insucesso é devido à competição entre os PAOs e outro grupo de organismos conhecidos como organismos acumuladores de glicogénio (GAOs). A ecologia e a eco fisiologia destes dois grupos têm vindo a ser investigadas através de estudos experimentais e de modelação metabólica, a fim de se obter uma melhor compreensão dos sistemas (EBPR).
Esta tese foca-se no estudo da eficiência da remoção de fósforo (P) e do comportamento metabólico de uma cultura enriquecida com dois grupos PAOs: Tetrasphaera-related organisms e Accumulibacter, que foram aclimatizados apenas com casamino ácidos num reactor descontínuo sequencial (SBR). Ambos os organismos foram identificados através de fluorescence in situ hybridization (FISH), e a cultura em estudo durante a fase anaeróbia demonstrou as seguintes transformações: libertação de P, hidrólise do glicogénio, baixa produção de poli--hidroxialcanoatos (PHA) e consumo de casamino ácidos. Na fase aeróbia houve consumo de P, produção de glicogénio e uma baixa oxidação do PHA. Além disso, foram realizados testes descontínuos inoculados com lamas provenientes do SBR principal, e alimentados com diferentes fontes de carbono (glucose, acetato, propionato, glutamato, aspartato, glicina e casamino ácidos). Com base nos resultados experimentais, foi sugerido que os Accumulibacter foram os responsáveis pelo consumo dos ácidos gordos voláteis (VFAs), e os Tetrasphaera-related organisms foram provavelmente responsáveis pelo consumo da glucose e dos aminoácidos.
Nesta tese também foi desenvolvido um modelo que combina os modelos metabólicos PAO-GAO com o modelo de lamas activas nº 2d (ASM2d) em colaboração com a Hydromantis Environmental Software Solutions, Inc.. O modelo combinado foi implementado no programa GPS-X e em breve irá fazer parte da biblioteca de modelos deste programa.
Contents
Acknowledgements ... III Abstract ... V
Resumo ... VII List of figures ... XI List of tables ... XIII
List of abbreviations ... XV
1 INTRODUCTION ... 1
1.1 Enhanced biological phosphorus removal principles ... 1
1.2 Microbiology ... 3
1.2.1 Microbial identification of PAOs ... 3
1.2.2 Microbial identification of GAOs ... 7
1.3 Factors affecting the competition between PAOs and GAOs ... 8
1.4 Process modelling ... 10
1.4.1 Metabolic models ... 11
1.4.2 ASM models ... 15
1.4.3 Combined metabolic and ASM models ... 16
1.5 Thesis objectives ... 17
2 ENRICHMENT OF A MIXED CULTURE OF ACCUMULIBACTER AND TETRASPHAERA-RELATED PAOs... 19
2.1 Objectives ... 19
2.2 Methods and materials ... 19
2.2.1 SBR operation ... 19
2.2.2 Batch tests ... 20
2.2.3 Culture media ... 21
2.2.4 Chemical analyses ... 21
2.2.5 Microbial characterisation ... 22
2.3 Results and discussion ... 23
2.3.1 Main SBR performance ... 23
2.3.2 Batch tests performance... 26
3 IMPLEMENTATION OF EBPR METABOLIC MODELS INTO GPS-X 6.2 PROGRAM ... 35
3.1 Objectives ... 35
3.2 Methods and materials ... 35
3.2.1 Model development ... 35
3.3 Results and discussion ... 36
3.3.1 Model description ... 36
3.3.2 Stoichiometric parameters ... 39
3.3.3 Model kinetics ... 40
3.4 Conclusions and recommendations for future research... 42
4 REFERENCES ... 43
APPENDIX I – GPS-X LIBRARIES ... 49
APPENDIX II - STOICHIOMETRIC MATRIX ... 53
APPENDIX III – MODEL KINETICS ... 61
APPENDIX IV – MODEL PARAMETERS ... 71
List of figures
Figure 1.1- Schematic representation of the EBPR process.. ... 2
Figure 1.2- Typical profiles of extracellular phosphate-P (), VFAs (), PHA (), and glycogen () from a SBR cycle study of an enriched GAO culture.. ... 3
Figure 1.3- Epifluorescence micrographs of sludge hybridised with Cy3-labelled PAOMIX probes and FITC-labelled BET42a probe.. ... 5
Figure 1.4: Epifluorescence micrographs of Tetrasphaera-PAO in activated sludge hybridised with probes Tet3-654 (a), Tet2-892 (b) and Tet2-174 (c) (Cy3-labelled). All samples were also hybridised with FITC-labelled EUBMIX. ... 6
Figure 1.5: Profiles of glucose (), extracellular phosphate-P () and glycogen () from a SBR cycle study of an enriched T. elongata culture. ... 7
Figure 1.6: Epifluorescence micrographs of sludge hybridised with Cy3-labelled GB probe and FITC-labelled Eub338 probe. ... 7
Figure 1.7: Meta confocal laser scanning microscope (CLSM) micrographs of FISH showing two clusters of Defluviicoccus vanus: I (A) and II (B).. ... 8
Figure 1.8: Summary of the bacterial population distributions showing the dominant or coexisting microorganisms as a function of the carbon source, pH and temperature. ... 10
Figure 1.9: Schematic diagram of the anaerobic metabolism of PAOs fed with acetate (Hac) as the sole carbon source. ... 12
Figure 1.10: Schematic diagram of the anaerobic metabolism of PAOs fed with propionate (HPr) as the sole carbon source. ... 12
Figure 1.11: Schematic diagram of the anaerobic metabolism of GAOs fed with acetate (Hac) as the sole carbon source. ... 13
Figure 1.12: Schematic diagram of the anaerobic metabolism of GAOs fed with propionate (HPr) as the sole carbon source. ... 14
Figure 1.13: Schematic diagram of the aerobic/anoxic metabolism for PAOs. ... 15
Figure 1.14: Schematic diagram of the aerobic/anoxic metabolism for GAOs. ... 15
Figure 1.15: EBPR approach of ASM2d model.. ... 16
Figure 2.1: Epifluorescence micrographs of SBR sludge hybridised with probes Tet1-266, Tet-892, Tet2-174, Tet3-654, PAOMIX (Cy3-labelled). All samples were also hybridised with FITC-labelled EUBMIX. ... 24
Figure 2.2: Cycle study showing carbon, glycogen, PHA and P transformations from a typical cycle in the SBR.. ... 25
Figure 2.3: Comparison of carbon, P and PHAs profiles between batch experiments (1st and 2nd) performed with different carbon sources (acetate, propionate, glucose, glutamate, aspartate and glycine.. ... 27
List of tables
Table 1.1: Overview of activated sludge models. Adapted from (Gernaey et al., 2004)... 17
Table 2.1: Oligonucleotide FISH probes employed in this study. ... 23
Table 2.2: Different morphologies observed by FISH in the SBR sludge. ... 24
Table 2.3: Biochemical transformations from a typical cycle in the SBR: comparison with metabolic models of Accumulibacter fed with acetate or propionate as sole carbon source. ... 26
Table 2.4: Batch tests results of P release and uptake. ... 30
Table 2.5: Comparison of anaerobic biochemical transformations between batch experiments and metabolic models of Accumulibacter. ... 31
Table 2.6: Comparison of aerobic biochemical transformations between batch experiments and metabolic models of Accumulibacter. ... 32
Table 3.1: State variables. ... 36
Table 3.2: Description of the processes. ... 37
Table I.1: Library (cnpiplib) state variables. ... 49
Table I.2: Library (cnpiplib) stoichiometry variables. ... 50
Table I. 3: Library (cnpiplib) composite variable calculations. ... 51
Table II.1: Model stoichiometry matrix. ... 53
Table II.2: Conservation matrix. ... 60
Table III.1: Saturation/Inhibition functions used in the kinetic equations. ... 61
Table III.2: Kinetic equations. ... 63
Table IV. 1: Stoichiometric parameters. ... 71
List of abbreviations
ASM Activated sludge model
ATU Allyl-N thiourea
BNR Biological nutrient removal
COD Chemical oxygen demand
COD/P ratio Ratio of organic carbon to P DDEF Denitrifying Defluviicoccus DEF Non-denitrifying Defluviicoccus
DGB Denitrifying Competibacter
DGGE Denaturing gradient gel electrophoresis
DPAOs Denitrifying PAOs
EBPR Enhanced biological phosphorus removal
ED The Entner-Doudoroff
EDTA Ethylene-diaminetetraacetic
EMP Embden-Meyerhof-Parnas
fddef DDEF fraction
FISH Fluorescence in-situ hybridization
fpaoI PAO I fraction
GAOs Glycogen accumulating organisms
GB Non-denitrifying Competibacter
GB Competibacter
HPLC High-performance liquid chromatography
HRT Hydraulic retention time
ici Conversion factor
IWA International Water Association
MAR-FISH Microautoradiography combined with FISH
MD Model developer
N Nitrogen
ji Stoichiometric coefficient
P Phosphorus
PAOs Polyphosphate accumulating organisms PH2MB Poly-β-hydroxy-2-methylbutyrate PH2MV Poly-β-hydroxy-2-methylvalerate
PHA Poly-β-hydroxyalkanoates
PHB Poly-β-hydroxybutyrate
PHV Poly-β-hydroxyvalerate
pmf Proton motive force
poly-P Polyphosphate
ppk1 Poly-P kinase 1 gene
ratio_prop_ac Propionate to acetate ratio
Sac Acetate
Salk Alkalinity
SBR Sequencing batch reactor
Sf Fermentable readily biodegradable substrate Si Soluble inert organic material
Sn2 Di-nitrogen
Snh Free and ionized ammonia
Sno2 Nitrite
Sno3 Nitrate
Spo4 Soluble ortho-phosphate
Sprop Propionate
SRT Sludge retention time
TCA Tricarboxylic acid
TOC Total organic carbon
TSS Total suspended solids
VFAs Volatile fatty acids
VSS Volatile suspended solids
WAS Waste activated sludge
WWTPs Wastewater treatment plants
Xdef Active Defluviicoccus biomass (DEF), a glycogen accumulating organism Xdef_gly Cell-internal storage of glycogen in DEF
Xdef_pha Cell-internal storage of PHA in DEF
Xgb Active Competibacter biomass (GB), a glycogen accumulating organism Xgb_gly Cell-internal storage of glycogen in GB
Xgb_pha Cell-internal storage of PHA in GB
Xh Active heterotrophic biomass
Xi Particulate inert organic material
Xmeoh Metal-hydroxides
Xmep Metal-phosphates
Xnh Active autotrophic ammonia oxidisers Xno2 Active autotrophic nitrite oxidisers
Xpao Active Accumulibacter biomass, a poly-P accumulating organism (PAO) Xpao_gly Cell-internal storage of glycogen in PAOs
Xpao_pha Cell-internal storage of polyhydroxyalkanoates (PHA) in PAOs
Xpp Stored polyphosphate
1 INTRODUCTION
Phosphorus (P) removal from sewage and industrial wastewater is the key factor in preventing eutrophication of surface and coastal waters, since P stimulates the growth of algae and other photosynthetic microorganisms, such as toxic cyanobacteria (blue-green algae) (Oehmen et al., 2007a). These organisms are responsible for the depletion of dissolved oxygen, causing the death of fish, and some blue-green algae produce compounds that have been implicated in the poisoning of fish (Yeoman et al., 1988). The major sources of P in raw wastewater are derived from agricultural land, excreta from livestock, municipal and industrial effluents (for example effluents rich in detergents and cleaning compounds) (Yeoman et al., 1988).
Chemical precipitation has long been used for P removal by the addition of calcium, aluminium and iron salts. However, this method produces large quantities of sludge, which causes handling problems and disposal costs, besides, some chemicals are expensive (Yeoman et al., 1988). These disadvantages are attenuated by the enhanced biological phosphorus removal (EBPR) process, when operated successfully, it can be an inexpensive and environmentally sustainable option to reach relatively high P removal efficiency (effluent P concentrations less than 1 mg/L) (Oehmen et al., 2007a).
1.1 Enhanced biological phosphorus removal principles
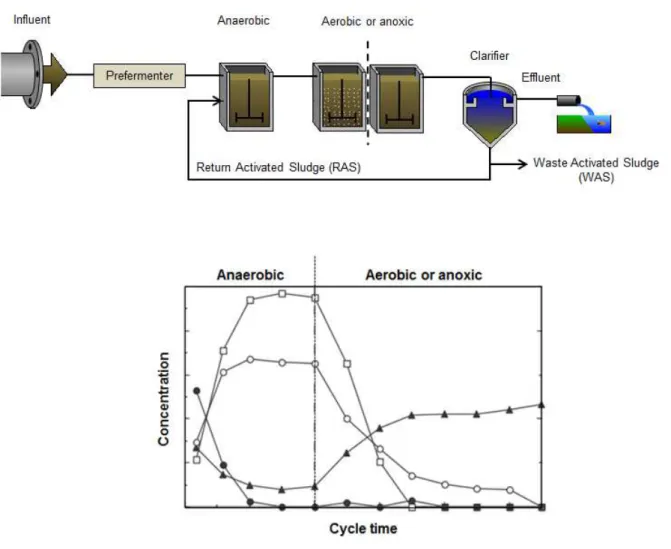
The EBPR process consists in the enrichment of polyphosphate accumulating organisms (PAO) by recirculating the activated sludge through anaerobic and aerobic conditions or anaerobic and anoxic conditions (Oehmen et al., 2007a). The last configuration is possible due to the ability of some PAOs to use nitrate or nitrite instead of oxygen as electron acceptors (see section 1.2.1). Hence, they perform nitrogen (N) and P removal simultaneously. The term biological nutrient removal (BNR) is employed to describe these cases. In practice, EBPR can be carried out in a sequencing batch reactor (SBR) operated with anaerobic and aerobic (or anoxic) phases, or in a continuous activated sludge process shown in Figure 1.1 (Oehmen, 2004).
the effluent with low P concentration through sedimentation in the clarifier, and it is recycled back to the anaerobic zone. The concentrated sludge mixture recycled is known as return activated sludge (RAS) (Oehmen et al., 2007a, Oehmen, 2004).
Figure 1.1- Schematic representation of the EBPR process. The graph show the typical profiles of extracellular phosphate-P (), VFAs (), PHA (), and glycogen () from a SBR cycle study of an enriched PAO culture. The graph was adapted from (Oehmen, 2004).
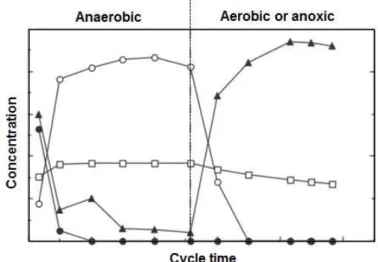
energy source for biomass growth, glycogen replenishment and cell maintenance. As shown in Figure 1.2, GAOs are unable to perform anaerobic P release and aerobic P uptake. Since GAOs compete with PAOs by VFAs uptake and they not contribute to P removal from EBPR systems, minimizing their growth have been a priority by researchers in the last years (Oehmen et al., 2007a).
Figure 1.2- Typical profiles of extracellular phosphate-P (), VFAs (), PHA (), and glycogen () from a SBR cycle study of an enriched GAO culture. Adapted from (Oehmen, 2004).
1.2 Microbiology
In recent years, the detection, quantification and metabolic properties of different PAO and GAO groups/subgroups have been possible thanks to the application of the following molecular techniques: fluorescence in situ hybridisation (FISH), 16S rRNA-based clone libraries, denaturing gradient gel electrophoresis (DGGE), quantitative real-time polymerase chain reaction (qPCR), chemical staining of stored polymers and microautoradiography combined with FISH (MAR-FISH) (Oehmen et al., 2010b, Oehmen et al., 2007a). More recently, high-throughput sequencing techniques (e.g. pyrosequencing) and the -omics methods (e.g. metagenomics, metaproteomics and metatranscriptomics) have also been applied for this purpose.
1.2.1 Microbial identification of PAOs
The most well-known PAO group is “Candidatus Accumulibacter phosphatis” (referred to as Accumulibacter hereafter), which is a bacterium closely related to Rhodocyclus in the Betaproteobacteria group (Oehmen et al., 2010b). Hesselmann et al., (1999) and Crocetti et al., (2000) demonstrated that Accumulibacter corresponds to the characteristic PAO phenotype described in the section 1.1. Several studies have shown that Accumulibacter was present in relative abundance in many lab-scale systems (Crocetti et al., 2000, Hesselmann et al., 1999, Liu et al., 2001) and in full-scale EBPR systems (4-22% of all bacteria) (Zilles et al., 2002, Saunders et al., 2003, Kong et al., 2004).
et al., 2008, He et al., 2007). This fact is also evidenced by some distinct metabolic features, which have been observed from different Accumulibacter types, such as denitrification capacity and anaerobic utilization of the TCA cycle (Oehmen et al., 2010b).
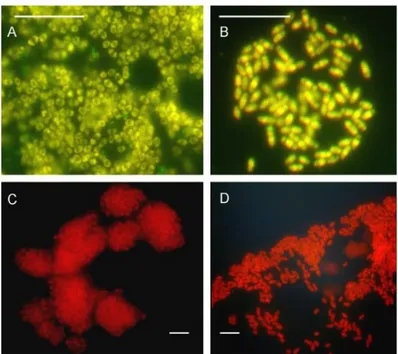
Figure 1.3- Epifluorescence micrographs of sludge hybridised with Cy3-labelled PAOMIX probes and FITC-labelled BET42a probe. Accumulibacter are shown in yellow in A) and B), while any other -Proteobacteria are shown in green. Accumulibacter are shown in red in C) and D). The figures A and C display the cocci morphology proposed as characteristic of PAO II. The figures B and D display the rod morphology proposed as characteristic of PAO I. Scale bar of 10 m for all images (Carvalho et al., 2007).
Dechloromonas-related PAOs are another group of Betaproteobacteria found in low numbers
(≤3%) in EBPR plants. They may be similar to Accumulibacter in terms of metabolism, and they are also potentially involved in nitrate and nitrite reduction. However there is little information available about their anaerobic/aerobic or anoxic cycle and it requires further investigation in order to be confirmed their metabolism (Oehmen et al., 2010b).
Besides Accumulibacter and Dechloromonas-related organisms, Gram-positive Tetrasphaera-related organisms within the Actinobacteria are also putative PAOs that are abundant in domestic wastewaters (3-16%), and even more so in industrial wastewater plants (17-35%) (Oehmen et al., 2010b). However, they do not share all typical PAO characteristics known from Accumulibacter. Y.H. kong et al., (2005) showed that they are able to take up phosphate and form poly-P under aerobic conditions, only after taking up some amino acids, anaerobically. According to these authors, they cannot take VFAs, and do not store PHAs in that phase. Y. kong et al., (2008) showed that they also seem capable of fermenting glucose, and according to Xia et al., (2008) they express extracellular surface-associated amylases for degradation of starch (Hien et al., 2011). A few isolated species of the genus Tetrasphaera were found. These include Tetrasphaera (T.) australiensis, T. japonica, T. elongata (strain LP2), T. elongata (strain ASP12), and the filamentous T. jenkinsii, T. vanveenii and T.veronensis. Recent studies of Hien et al, (2011) and Kristiansen et al, (2013) have helped to increase the knowledge about the phylogeny and ecophysiology of Tetrasphaera-related organisms.
T.veronensis and the filamentous “Candidatus Nostocoida limicola”, while clade 3 contains only sequences from uncultured clones. The Figure 1.4 shows some of the six different morphotypes (short rods, branched rods, small cocci, cocci in tetrads, filaments, and thin filaments) detected by the authors in the Tetrasphaera clades 1-3. Hien et al., (2011) also showed that active uptake of P and formation of poly-P took place in most of the probe-defined Tetrasphaera populations (only in bacteria targeted by probe Tet3-19 in clade 3 and most filamentous morphotypes this did not occur). However aerobic uptake of P only took place after uptake of certain carbon sources under anaerobic conditions: amino acids and glucose (for all clades), and acetate (only observed in clade 2 and 3). It is noteworthy that despite all Tetrasphaera were able to consume glucose anaerobically, not all take up P in the
following aerobic phase. Moreover, the filamentous “Candidatus Nostocoida limicola” in clade 2 did not actively take up P aerobically and may not be active PAOs despite the presence of intracellular P. (Hien et al., 2011) also performed staining with Nile Blue or Sudan Black in order to detect the presence of PHAs. However, the identity of any intracellular compound was not found and is still unknown.
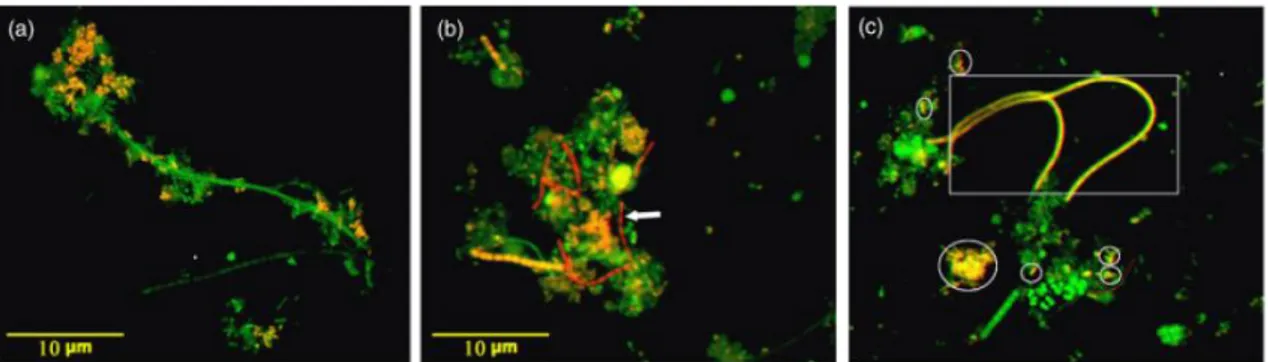
Figure 1.4: Epifluorescence micrographs of Tetrasphaera-PAO in activated sludge hybridised with probes Tet3-654 (a), Tet2-892 (b) and Tet2-174 (c) (Cy3-labelled). All samples were also hybridised with FITC-labelled EUBMIX. Tetrasphaera are shown in yellow and other Bacteria are shown in green. The arrow, the circles and the square indicate thin filaments, branched rods, and filaments, respectively. Scale bar of 10 m for all images. Adapted from (Hien et al., 2011).
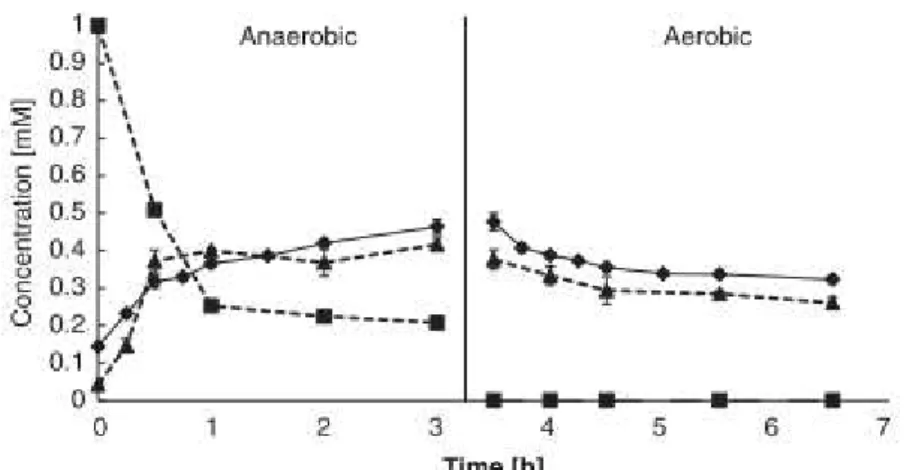
Recently, Kristiansen et al., (2013) proposed a metabolic model for members of the genus Tetrasphaera involved in EBPR systems. They suggested that under anaerobic conditions the Tetrasphaera-related PAOs take up glucose and ferment this to succinate and other components. Furthermore, glycogen is produced as a storage polymer and the energy required for these anabolic reactions is obtained from fermentation and poly-P degradation. Aerobically, the stored glycogen is degraded to provide carbon and energy for growth, P uptake and poly-P formation (see Figure 1.5). Kristiansen et al., (2013) observed that Tetrasphaera-related PAOs are also able to denitrify like Accumulibacter clade IA members.
Figure 1.5: Profiles of glucose (), extracellular phosphate-P () and glycogen () from a SBR cycle study of an enriched T. elongata culture (Kristiansen et al., 2013).
1.2.2 Microbial identification of GAOs
Phylogenetic diversity has also been observed among the GAOs. It was Crocetti et al., (2002) who identified organisms displaying the GAO phenotype (described in the section 1.1), and named them as
“Candidatus Competibacter phosphatis” (henceforth referred to as Competibacter) belonging to the Gammaproteobacteria phylum (Oehmen, 2004). Later, Y. H. Kong et al., (2002) observed that Competibacter (also known as GB lineage) are composed of at least seven different sub-groups (GB 1-7), and these bacteria exhibited cocci and rod morphologies, as shown in Figure 1.6 (Oehmen et al., 2007a). Through MAR-FISH analysis, Y. H. Kong et al., (2006) hypothesized that the different subgroups of Competibacter display varying denitrification capacities. This work suggested that GB 6 was capable of nitrate and nitrite reduction, while GB 1, 4 and 5 were able to reduce nitrate only, and GB 3 and 7 were unable to denitrify (Oehmen et al., 2010b, Oehmen et al., 2010c). The Competibacter percentage found in full-scale EBPR plants is about ≤12% of all bacteria (Oehmen et al., 2010b).
Figure 1.6: Epifluorescence micrographs of sludge hybridised with Cy3-labelled GB probe and FITC-labelled Eub338 probe. Competibacter are shown in yellow, while any other bacteria are shown in green. Scale bar of 10 m. Adapted from (Kong et al., 2002).
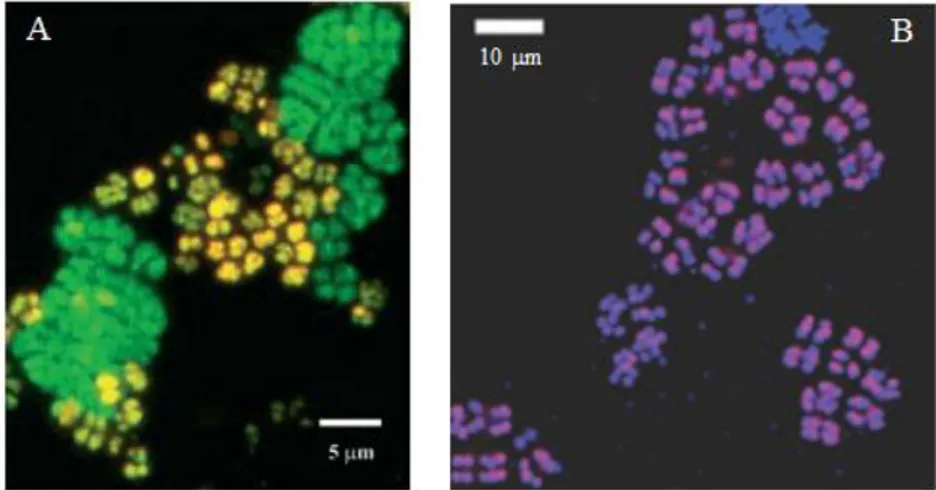
These organisms have been identified to belong to the Alphaproteobacteria phylum, and seem to display tetrad morphology, see Figure 1.7 (Oehmen et al., 2007a). Defluviicoccus vanus were observed be present (about 9% of all bacteria) in full-scale EBPR plants (Oehmen et al., 2010b).
Figure 1.7: Meta confocal laser scanning microscope (CLSM) micrographs of FISH showing two clusters of Defluviicoccus vanus: I (A) and II (B). A) Sludge hybridized with probes TFO_DF618 (Cy5-labelled, red) and TFO_DF218 (Cy3-labelled, green). In this figure there are two FISH-positive signals: one fluoresced with both probes (yellow) and the other fluoresced only with probe TFO_DF218 (green). Scale bar of 5 m (Wong et al., 2004). B) Sludge hybridized with probes DF988 and DF1020, DF2MIX (Cy3-labelled, red) and EUBMIX (Cy5-labelled, blue). In this figure cluster II D.vanus cells are magenta and other Bacteria are blue. In both figures the cells had a tetrad morphology. Scale bar of 10 m. Adapted from (Meyer et al., 2006).
Similarly to Competibacter, Defluviicoccus GAOs are composed of at least four different clusters, where different sub-groups of each organism have varying denitrification capabilities. Wang et al., (2008) showed that an enrichment of Defluviicoccus Cluster I was able to reduce nitrate, but not nitrite, and Burow et al., (2007) suggested that Defluviicoccus Cluster II was unable to denitrify (Oehmen et al., 2010c).
1.3 Factors affecting the competition between PAOs and GAOs
The well-known factors that affect the competition between PAOs and GAOs are the ratio of organic carbon to P (COD/P ratio), the type of carbon source present in the influent, pH and temperature.
Relatively to COD/P ratio, high values (e.g. >50 mg COD/mg P) in the wastewater feed tends to favour the growth of GAOs, while low values (e.g. 10-20 mg COD/mg P) should be more favourable to the growth of PAOs (Oehmen et al., 2007a).
present, although the latter may be particularly abundant in industrial wastewater systems. Therefore, in this section only are described the effects caused by the acetate, propionate, glucose and amino acids on the PAO-GAO competition.
According to Oehmen, Saunders, et al., (2006a); Oehmen, Yuan, et al., (2005b) and Oehmen, Zeng, et al., (2006b), Accumulibacter are able to take up acetate and propionate with the same efficiency and at a similar kinetic rate, while Competibacter can store acetate at a similar rate but take up propionate at negligible rates. However, the Defluviicoccus GAOs can take up propionate at a similar rate as Accumulibacter but take up acetate at about 50% of their rate. Thus, the type of carbon source has a direct effect on the anaerobic metabolism of PAOs and GAOs. Nonetheless, it also has an indirect effect on the aerobic metabolism, since the uptake of either acetate or propionate leads to different total anaerobic PHA productions per C mol of carbon source, and also to the storage of different PHA fractions: poly--hydroxybutyrate (PHB), poly--hydroxyvalerate (PHV) and poly- -hydroxy-2-methylvalerate (PH2MV), which will affect their aerobic yields (Lopez-Vazquez et al., 2009). The effect of amino acids has already been discussed in section 1.2.1, as favouring the growth of Tetrasphaera-related PAOs. However, it is currently unclear which preferred amino acids are taken up by this group.
In relation to glucose, there are studies proving the success of EBPR plants when this carbon source is fed, and also studies showing its deterioration. Y. H. Kong et al., (2006) suggested a possible explanation for that, wherein Competibacter and Accumulibacter are unable to assimilate glucose directly, and so they rely on the consumption of fermentation products, such as acetate and propionate (competition explained above). However, glucose has been observed to be directly taken up by Defluviicoccus-related organisms. On the other hand, other possible explanation that supports the proliferation of GAOs organisms is that external glucose can replace internally stored glycogen and serve as the energy source and reducing power for PHA accumulation, reducing the dependency on poly-P (Mino et al., 1998). Nevertheless, Tetrasphaera PAOs also consume glucose. Consequently, its effect on the PAO-GAO competition remains unclear.
Several studies have demonstrated that pH affects the anaerobic and aerobic metabolisms of PAOs and GAOs, wherein high pH values (>7.25) improves P removal performance by selecting PAOs over GAOs, while low pH values (<7.25) promote the proliferation of GAOs (Filipe et al., 2001b). Smolders et al., (1994a) observed that the ratio of anaerobic P release to acetate uptake varied from 0.25 to 0.75 P-mol/C-mol in a pH range of 5.5 to 8.5. They explained this fact as follows: under the assumption that the internal pH and the overall proton motive force (pmf) of a cell is kept constant, at a high external pH than the internal, the pH gradient increases as well as the electrical potential difference () across the cell membrane in order to maintain a constant pmf. Consequently, for the uptake of acetate (a negatively charged ion) more work must be done to overcome . This increased work is generated through an increase in poly-P degradation (Oehmen et al., 2007a).
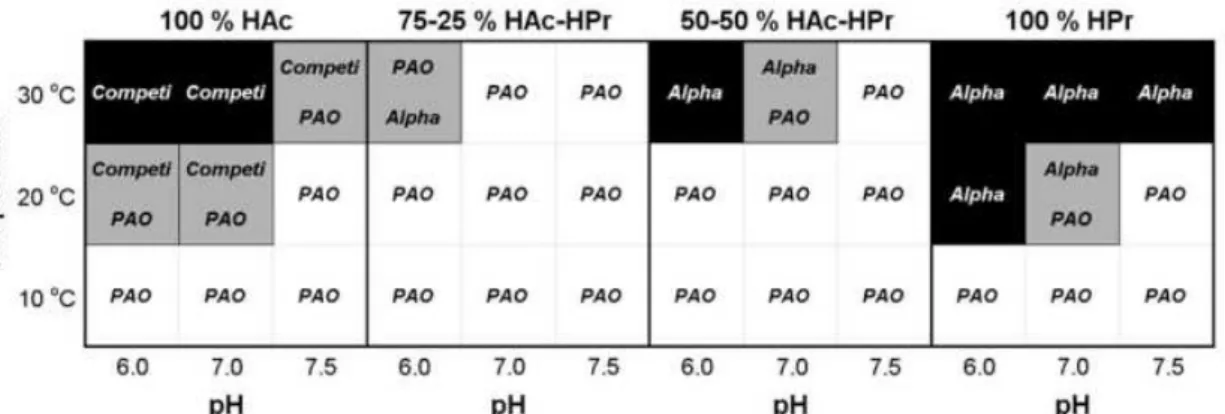
The metabolic model developed by Lopez-Vazquez et al., (2009) achieved important conclusions about the effects caused by the combination of the factors mentioned above on PAO-GAO competition, as shown in Figure 1.8. According to this study, the growth of PAOs is favoured over GAOs at lower temperatures (10ºC), independently of pH and carbon source; at moderate temperature (20ºC) and acetate to propionate ratios of 75-25% and 50-50%, regardless of the applied pH. On the other hand, if propionate and acetate are used as sole carbon source at 20ºC, PAOs are only dominant at pH equals to 7.5.
Figure 1.8: Summary of the bacterial population distributions showing the dominant or coexisting microorganisms as a function of the carbon source, pH and temperature. Accumulibacter (PAO) is signalled by white cells while Competibacter (Competi) or Defluviicoccus-related organisms (Alpha) are in black cells. Light grey tones indicate the coexistence of two microorganisms (Lopez-Vazquez et al., 2009).
1.4 Process modelling
Nowadays, mathematical modelling has become an integral part of biological wastewater treatment, often for optimization and prediction of process performance, and as a supporting tool for design (Lopez-Vazquez et al., 2009). Two different types of models have been used to describe EBPR processes: activated sludge models (ASM) and metabolic models. EBPR metabolic models can be combined with ASM models in order to simulate the behaviour of full-scale EBPR pants.
1.4.1 Metabolic models
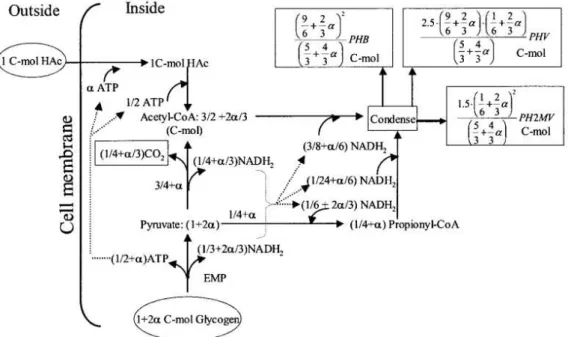
In this section, the anaerobic and aerobic/anoxic stoichiometry of the metabolic model developed by Oehmen, Lopez-Vazquez, et al., (2010c) will be described, since this model describes the biochemical activity of six microbial groups of PAOs and GAOs: PAOI and PAOII; denitrifying (DGB) and non-denitrifying Competibacter (GB); denitrifying (DDEF) and non-denitrifying Defluviicoccus (DEF). In addition, this model also incorporates the carbon source (acetate and propionate), temperature and pH dependencies of these microorganisms obtained through several lab-scale studies.
Anaerobic stoichiometry
According to Oehmen, Lopez-Vazquez, et al., (2010c), the anaerobic stoichiometry is identical for all subgroups of PAOs (PAOI and PAOI) and subgroups of GAOs (DGB, GB, DDEF and DEF).
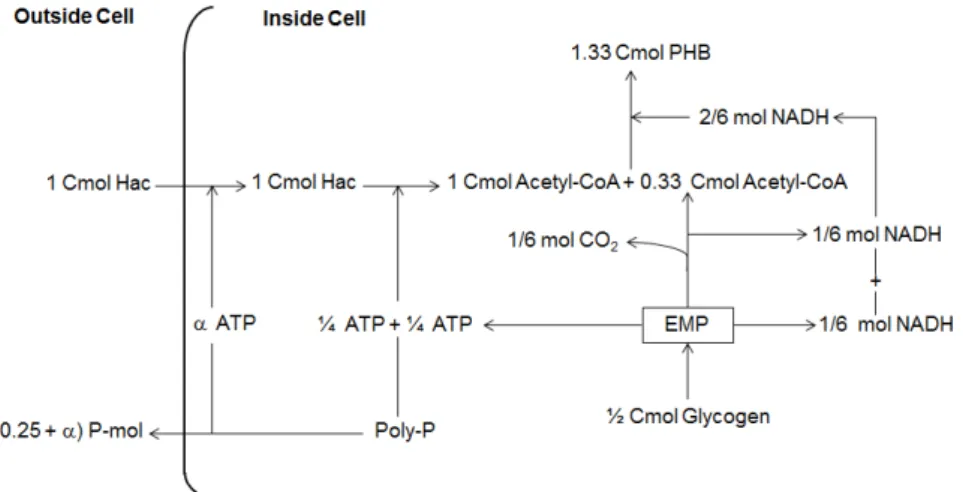
Figure 1.9: Schematic diagram of the anaerobic metabolism of PAOs fed with acetate (Hac) as the sole carbon source (Filipe et al., 2001c).
Figure 1.10 shows the anaerobic metabolism of PAOs fed with propionate as the sole carbon source. Propionate is taken up by PAOs cells and converted to propionyl-CoA, using both poly-P and glycogen hydrolysis as energy sources. Similarly to acetate metabolism, it is unclear the potential contribution of the right branch of the TCA in the production of NADH, while the involvement of glycogen was clearly demonstrated (Oehmen et al., 2007a). The preferred glycolysis pathway is also unclear (Oehmen et al., 2010b). However, Oehmen, Zeng, et al., (2005c) proposed that glycogen is glycolysised to acetyl-CoA, CO2 and NADH2 through ED pathway. Nevertheless, Oehmen,
Lopez-Vazquez, et al., (2010c) later showed that the model is relatively insensitive towards the EMP vs ED pathways for PAOs. Consequently, acetyl-CoA and propionyl-CoA are reduced and condensed to form PHA. As such, four fractions of PHA may be produced, which depends on the molecules that bind together during condensation: PHB, PHV, poly--hydroxy-2-methylbutyrate (PH2MB) and PH2MV. Note that PHV and PH2MB are isomers of each other, and by this reason they are grouped together and referred to simply as PHV, which indicates the sum of these two polymers (Oehmen et al., 2005c).
The following reaction describes the cell maintenance in anaerobic conditions (Smolders et al., 1995):
( ) ( )
The anaerobic processes of GAOs and DGAOs are similar to PAOs, except that poly-P hydrolysis and release as phosphate does not occur (Oehmen et al., 2010c). As shown in Figure 1.11, the main differences, besides those already mentioned, in anaerobic metabolism of GAOs fed with acetate as the sole carbon source in relation to the PAOs are that glycogen hydrolysis to pyruvate provides all the required ATP in the overall process and some of the NADH2. A part of pyruvate is decarboxylated to
form acetyl-CoA and CO2 (providing the additional NADH2), and the rest is converted to propionyl-CoA
via the succinate-propionate pathway, which consumes NADH2. Consequently, the acetyl-CoA and
propionyl-CoA produced condense randomly to form PHB, PHV and PH2MV (Zeng et al., 2003a).
Figure 1.11: Schematic diagram of the anaerobic metabolism of GAOs fed with acetate (Hac) as the sole carbon source (Zeng et al., 2003a).
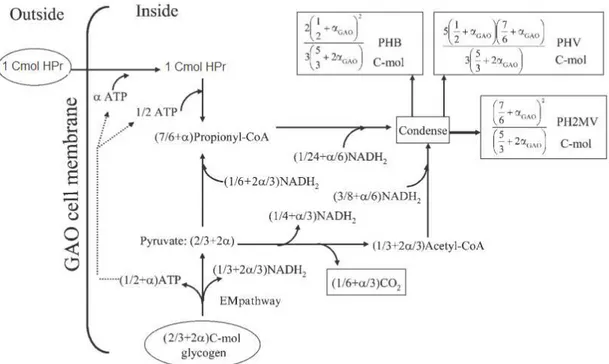
Figure 1.12: Schematic diagram of the anaerobic metabolism of GAOs fed with propionate (HPr) as the sole carbon source (Oehmen et al., 2006b).
Filipe et al., (2001a) proposed that the sole energy source for anaerobic maintenance in GAOs is obtained through glycogen hydrolysis, and Zeng et al., (2003a) showed that glycogen was directly converted to PHA, according to the following reaction:
Aerobic and anoxic stoichiometry
Figure 1.13: Schematic diagram of the aerobic/anoxic metabolism for PAOs. Adapted from (Smolders et al., 1995).
The aerobic and anoxic PHA-based yield coefficients are a function of the P/O ratio ( and N, also known as YNADH_ATP. Note that the subscript N is used to refer anoxic conditions), which represents the
ATP produced per NADH oxidised during oxidative phosphorylation; the phosphate transport energy ( and N); the ATP necessary for biomass synthesis (K1 and K2) and the percentage of acetyl-CoA* ()
and propionyl-CoA* () in the PHA polymer. The NOx and oxygen-based yield coefficients were
calculated by the PHA-based yield coefficients and the degree of reduction of the PHA polymer, as performed by Zeng et al., (2003a). The biomass degree of reduction was also incorporated in the oxygen and NOx consumed per biomass growth yield coefficient, as performed by Lopez-Vazquez et al., (2009) and A. Oehmen, Lopez-Vazquez, et al., (2010c).
Figure 1.14: Schematic diagram of the aerobic/anoxic metabolism for GAOs. Adapted from (Oehmen, 2004).
1.4.2 ASM models
chemical P removal via precipitation comes with ASM2 model and later with ASM2d model. The latter is an extension of the first, which includes two additional processes to account for the fact that PAOs can use cell internal organic storage products for denitrification, i.e. PAOs are able to proliferate not only in aerobic conditions (as proposed by ASM2) but also in anoxic conditions (Henze et al., 1999). The Figure 1.15illustrates the EBPR approach in ASM2d model, wherein under anaerobic conditions acetate is stored intracellularly as PHB polymer, and the energy source for this conversion comes from the cleavage of poly-P and release of P from the cell. It is noteworthy that all organic storage products are lumped into one model component (XPHA), excluding glycogen in order to reduce model complexity
(Gernaey et al., 2004, Henze et al., 1999). Under aerobic or anoxic conditions, PHB is used as energy source for P uptake and biomass growth. Rieger et al., (2001) have incorporated the EBPR process in the ASM3 model, creating the ASM3-BioP model. The ASM2d and ASM3-BioP models have been used in the modelling of full-scale EBPR systems (Wichern et al., 2001, Ingildsen et al., 2006, Lee et al., 2006, Carrette et al., 2001).
Figure 1.15: EBPR approach of ASM2d model. Sac: acetate; SPO4: soluble otho-phosphate; XPHA:
cell-internal storage of PHAs; XPP: stored poly-P; XPAO: active PAO biomass; So: dissolved oxygen;
SNO3: nitrate plus nitrite nitrogen. Adapted from (Meijer, 2004).
1.4.3 Combined metabolic and ASM models
The most common example of this combination is the TUDP model developed by Technical University of Delft, which combines the metabolic models for denitrifying and non-denitrifying EBPR of Murnleitner et al., (1997) with the ASM2d model (Gernaey et al., 2004). This model has been successfully applied to domestic wastewater treatment plants (WWTPs) with numerous configurations such as University of Cape Town (UCT), modified UCT and A2N (Oehmen et al., 2007a). Contrary to
Therefore, the combination of metabolic model developed by Oehmen, Lopez-Vazquez, et al., (2010c) with ASM2d is very interesting, since this model, as already mentioned, incorporates the varied denitrification tendencies of the different groups and subgroups of PAOs and GAOs as well as their different dependencies on the following factors: carbon source (acetate and/or propionate), temperature and pH.
A summary of the properties of the most important ASM models is given in Table 1.1.
Table 1.1: Overview of activated sludge models. Adapted from (Gernaey et al., 2004).
ASM1 ASM3 ASM2 ASM2d ASM3-bio-P TUDP 1
Nitrification X X X X X X
Denitrification X X X X X X
Heterotrophic/autotrophic decay
DR, Cst ER, EA
DR, Cst
DR, Cst ER, EA DR, Cst
Hydrolysis EA Cst EA EA Cst EA
EBPR X X X X
Denitrifying.PAOs X X X
Lysis of PAO/PHA Cst Cst EA EA
Fermentation X X X
Chemical P removal X X
Reactions 8 12 19 21 23 21
State variables 13 13 19 19 17 17
DR: death regeneration concept; EA: electron acceptor depending; ER: endogeneous respiration concept; Cst: not electron acceptor depending;
1
TUDP model is a combination of ASM2d model with metabolic models.
1.5 Thesis objectives
The overall objectives of this thesis are:
(1) Understand the behaviour of Accumulibacter - Tetrasphaera mixed cultures, which are representative of the microbial community of many full-scale EBPR plants.
(2) Combine PAO-GAO metabolic models with ASM models in order to describe better the performance of full-scale EBPR plants.
2 ENRICHMENT OF A MIXED CULTURE OF
ACCUMULIBACTER
AND
TETRASPHAERA
-RELATED PAOs
2.1 Objectives
The lack of biochemical knowledge about the metabolism of Tetrasphaera-related organisms has been a limiting factor to understand the behaviour of full-scale EBPR systems. Therefore, the aim of this study was to investigate the P removal efficiency and metabolic behaviour of an enriched culture of Tetrasphaera-related organisms and Accumulibacter, which were acclimatized with casamino acids as sole carbon source. As such, the substrate uptake profile of this mixed culture was investigated by performing batch tests with individual feeding of the following carbon sources: glucose, acetate, propionate, glutamate, aspartate and glycine; and combined feeding of acetate, propionate and casamino acids in order to assess their relative preferences.
2.2 Methods and materials
2.2.1 SBR operation
A SBR with 500 ml of working volume was operated to obtain an enriched culture of Tetrasphaera-related organisms and Accumulibacter using casein hydrolysate (i.e. casamino acids) as sole carbon source. The SBR was inoculated with sludge from a WWTP in Setubal, Portugal. The cycle time of the SBR was 8 h: 4 h of anaerobic phase, 1 h of settle/decant phase and 3h of aerobic phase. The SBR was fed continuously during the first 3 h of the anaerobic phase with 150 ml of synthetic carbon medium containing casein hydrolysate as the sole carbon source, resulting in a casein concentration in the reactor of 154 mg/L. It was also fed during the first 3 minutes of the aerobic phase with 50 ml of mineral medium and 50 ml of phosphate medium (300 mg P/L). The hydraulic retention time (HRT) and sludge retention time (SRT) were 16 h and 19 days, respectively. Argon was bubbled into the reactor during the anaerobic phase to maintain strict anaerobic conditions. In the aerobic phase, air was bubbled into the reactor at a flow rate of approximately 4.5 L/min. The temperature was controlled at 20 1ºC and the pH was controlled at 7.1 0.1 by automatic addition of HCl 0.1 M when the pH was above the set point. The stirring rate was kept constant at 200-400 rpm during the anaerobic and aerobic phases.
The performance of the SBR was monitored through cyclic studies, whereby samples to analyse the carbon source, PHA, glycogen and orthophosphate were taken every hour throughout a cycle and analysed via chemical analytical methods (detailed below). These samples were centrifuged at 10 000 rpm for 5 min and the supernatant and pellet were stored separately at -20ºC, except for orthophosphate samples, wherein it was added 15 l of H2SO4 4.0 M to the supernatant and stored at
the end of anaerobic and aerobic phases samples for FISH analysis were also taken, and at the end of the aerobic phase a sample to measure total P concentration was taken, which was stored at -20ºC.
2.2.2 Batch tests
A series of batch tests was performed in order to investigate the preferred carbon sources (glucose, acetate, propionate, glutamate, aspartate and glycine) by the enriched culture from the SBR. As such, 3 types of experiments were planned: 1) study the individual uptake of each carbon source during anaerobic phase (4h); 2) same study, but this time for a full anaerobic/aerobic cycle (8h) and 3) study the effect of combined feeding of 3 carbon sources (acetate, propionate and casamino acids) for a full cycle.
For the first experiment, it was performed 7 batch tests: one for each carbon source (glucose, acetate, propionate, glutamate, aspartate and glycine) and another one was selected as blank without carbon source. The tests were conducted in flasks with a working volume of 50 ml. Each flask was inoculated with approximately 17 ml of sludge collected from the main SBR at the end of the cycle, and the sludge was diluted with 33 ml of mineral medium. To ensure anaerobic conditions, nitrogen gas was bubbled into the flasks for 15 minutes and then the flasks were capped and sealed. At the beginning of the experiment a feed pulse of each carbon source (5ml) was added to the respective flask, and samples to analyse carbon source, PHA, glycogen and orthophosphate were taken at various points throughout the anaerobic phase. At the end of the anaerobic phase, samples were taken to measure TSS and VSS. The stirring rate in all batch tests was 250 rpm, the room temperature was 21 1ºC, the pH of culture media was set at 7.4 0.1 and the pH of sludge before inoculation was 6.95.
For the second experiment, it was performed 8 batch tests: one for each carbon source (glucose, acetate, propionate, glutamate, aspartate and glycine) and another two were selected as blanks (without carbon source), one was under anaerobic conditions and the other under aerobic conditions. All tests were conducted in batch reactors with 500 ml of working volume, and with the exception of the test without carbon source operated under anaerobic conditions, the others were connected to a respirometer with a working volume of 45 ml, where an oxygen electrode was introduced.
In batch tests without carbon source, each reactor was also inoculated with approximately 95 ml of sludge collected from the main SBR at the end of the cycle. However, for reactor under anaerobic conditions the sludge was diluted with 355 ml of effluent from the main SBR and with 50 ml of distilled water. This reactor was operated for 7 h. While for the reactor under aerobic conditions, the sludge was diluted with 155 ml of effluent and 50 ml of mineral medium. The experiment began after a feed pulse of phosphate media (50 ml) and the operation lasted for 7 h.
The setup of the third experiment and the operation conditions were similar to the batch reactors with only one carbon source, except for the following changes. The sludge was diluted with 255 ml of effluent from the main SBR. The cycle began after a feed pulse (150 ml) of a synthetic medium containing acetate, propionate and casamino acids.
The anaerobic and aerobic conditions were maintained by bubbling continuously argon and air, respectively, into the batch reactors. The pH was controlled at 7.1 0.1 by the addition of HCl 1M and NaOH 1M, and the room temperature was 22 1 ºC. Samples were taken to analyse the carbon source, PHA, glycogen, orthophosphate, total P concentration, TSS and VSS, and were processed in the same way as that in the main SBR.
2.2.3 Culture media
The composition of the SBR culture media are described as follow: the synthetic carbon medium contained per litre 0.53 g casein hydrolysate (Fluka); the mineral medium contained per litre: 0.74 g NH4Cl, 1.19 g MgSO4.7H2O g, 0.55 g CaCl2.2H2O, 0.01 g allyl-N thiourea (ATU, a nitrification
inhibitor), 0.04 g ethylene-diaminetetraacetic (EDTA) and 3.96 ml micronutrient solution. The micronutrient solution used was identical to that in (Smolders et al., 1994a) and consisted of per litre: 1.5 g FeCl3.6H2O, 0.15 g H3BO3, 0.03 g CuSO4.5H2O, 0.18 g KI, 0.12 g MnCl2.4H2O, 0.06 g
Na2MoO4.2H2O, 0.12 g ZnSO4.7H2O and 0.15 g CoCl2.6H2O. The phosphate medium contained 0.95
g K2HPO4 and 0.58 g KH2PO4 per litre. The synthetic media of carbon and mineral as well as
micronutrient solution were autoclaved at 121ºC and 1 bar during 20 min, but prior to this, the pH was set to 7.4 0.1 by the addition of NaOH 1.0 M in the casein and the mineral media.
In the batch tests, the mineral and phosphate media had the same composition described for the SBR. For the batch tests with only one carbon source performed in flasks (1st experiment) and in reactors (2nd experiment), it was selected an initial concentration of 2mM for the carbon sources (glucose, acetate, propionate, glutamate, aspartate and glycin). For the 3rd experiment, it was selected an initial concentration in reactor of 2.90 C-mmol/L for each carbon source (acetate, propionate and casein hydrolysate), which was similar to the initial concentration in the main SBR. Therefore, the synthetic medium contained per litre: 0.66 g CH3COONa.3H2O, 0.24 g C3H6O2 and 0.18 g casein
hydrolysate. In all carbon source media, the pH was set to 7.4 0.1 by the addition of NaOH 1.0 M.
2.2.4 Chemical analyses
Total P concentration was also determined by segmented flow analysis (Skalar 5100, Skalar Analytical, The Netherlands). Prior to injection, 0.5 ml cell suspension (stored at -20ºC) was mixed with 400 mg potassium persulphate and 5 ml H2SO4 0.3 M, and digested for 1 h at 100ºC.
VFAs and glucose were measured by high-performance liquid chromatography (HPLC) using a Metacarb 87 H (Varian) column and a refractive index detector (RI-71, Merck). The mobile phase was H2SO4 0.01 N solution at a flow rate of 0.6 ml/min and the column was operated at 50ºC. Prior to
injection, 700 l of supernatant (stored at -20ºC) was acidified with 50 l of H2SO4 0.05N and filtered
using a 0.2 m membrane.
The casein hydrolysate uptake was assessed through the analysis of total organic carbon (TOC) by a Shimadzu analyser.
PHA was determined according to the methodology described by (Lanham et al.). Briefly, the pellet stored at -20ºC was lyophilized overnight and 4 mg of biomass was then mixed with 1 ml of acidic methanol (20% H2SO4 v/v) and 1 ml of chloroform solution, which contained 1 mg/ml heptadecane
(Fluka) as internal standard. This mixture was digested for 5 h at 100ºC. After cooling, 0.5 ml of water was used for extraction, and the sample was then mixed for 1 minute in a vortex mixer. The chloroform phase was collected and molecular sieves (0.4 nm, Prolabo) were added for water adsorption. The organic phase was injected into a gas chromatograph (Bruker 430-GC) coupled to a flame ionization detector and equipped with BR-SWax column (60 m, 0.53 mm internal diameter, 1 m film thickness, Bruker, USA). Helium was the carrier gas at a constant pressure (14.5 psi). The temperature of injection was 280ºC, the temperature of the detector was 230ºC and the temperature ramp started at 40ºC, then increased at a rate of 20ºC/min until 100ºC, further increased at a rate of 3ºC/min until 175ºC, and finally increased again at 20ºC/min until 220ºC, to ensure a cleaning step of the column after each injection. The calibration curve was obtained by injecting standards of HB, HV, H2MB (by a co-polymer of PHB-PHV, 88:12 wt, Aldrich) and H2MV (by a 2-hydroxy-caproic acid, Aldrich) with different dilutions.
Glycogen was determined using the method described by Lanham et al., (2012). Briefly, the pellet stored at -20ºC was lyophilized overnight and 2 mg biomass was then mixed with 2 ml of HCl 0.9 M and digested for 3h at 100ºC. The samples were cooled in an ice bath, the supernatant was extracted, filtered using a 0.2 m membrane and glucose was analysed by HPLC. A CarboPac PA10 column (Dionex) and an amperometric detector were used and the analyses were operated at 30ºC and a flow rate of 0.8 ml/min, with sodium hydroxide (NaOH 18 mM) as eluent.
TSS and VSS were determined according to standard methods (APHA-American Public Health Association, 1995).
2.2.5 Microbial characterisation
Daims et al., 1999)) that target all Bacteria; PAOMIX (PAO651, PAO462 and PAO846, see (Crocetti et al., 2000)) that target most members of the Accumulibacter cluster; and Tet1-266, Tet2-892, Tet2-174 and Tet3-654 that target most Tetrasphaera-related organisms (Hien et al., 2011). Details on oligonucleotide probes employed for FISH as well as the percentage of formamide used to hybridize each probe are listed in Table 2.1. FISH samples were observed using an Olympus BX51 epifluorescence microscope.
Table 2.1: Oligonucleotide FISH probes employed in this study.
Probe Sequence 5’-3’ Specifity Formamide
(%)
Reference
EUB338 GCTGCCTCCCGTAGGAGT Most Bacteria 0-50 Amann et al., (1990) EUB338-II GCAGCCACCCGTAGGTGT Planctomycetales
and other Bacteria
not detected by EUB338
0-50 Daims et al., (1999)
EUB338-III GCTGCCACCCGTAGGTGT Verrucomicrobiales
and other Bacteria
not detected by EUB338
0-50 Daims et al., (1999)
PAO462 CCGTCATCTACWCAGGGTATTAAC Most
Accumulibacter
35 Crocetti et al., (2000) PAO651 CCCTCTGCCAAACTCCAG Most
Accumulibacter
35 Crocetti et al., (2000) PAO 846 GTTAGCTACGGCACTAAAAGG Most
Accumulibacter
35 Crocetti et al., (2000) Tet1-266 CCCGTCGTCGCCTGTAGC Uncultured T.
elongata
25 Hien et al., (2011) Tet2-892 TAGTTAGCCTTGCGGCCG Clone ASM47 5 Hien et al.,
(2011) Tet2-174 GCTCCGTCTCGTATCCGG T. jenkinsii, T.
australiensis, T. veronensis, and Candidatus N. limicola
20 Hien et al., (2011)
Tet3-654 GGTCTCCCCTACCATACT Uncultured
Tetrasphaera
35 Hien et al., (2011)
2.3 Results and discussion
2.3.1 Main SBR performance
Figure 2.1: Epifluorescence micrographs of SBR sludge hybridised with probes Tet1-266, Tet-892, Tet2-174, Tet3-654, PAOMIX (Cy3-labelled). All samples were also hybridised with FITC-labelled EUBMIX. Accumulibacter and Tetrasphaera are shown in yellow and other Bacteria are shown in green.
Table 2.2: Different morphologies observed by FISH in the SBR sludge.
Probe Morphology
Tet1-266 Branched rods, short rods in clumps, cluster of tetrads and irregular cocci
Tet2-892 Cluster of tetrads, filaments and short rods in clumps Tet2-174 Small cocci and irregular cocci
Tet3-654 Branched rods, short rods in clumps and irregular cocci
Figure 2.2 shows the metabolic transformations of the SBR, wherein the culture in study demonstrated anaerobic P release, glycogen hydrolysis, a very low PHA synthesis and high casamino acids uptake (about 77-83%); followed by aerobic P uptake (about 100%), glycogen formation and a very low PHA oxidation.
Figure 2.2: Cycle study showing carbon, glycogen, PHA and P transformations from a typical cycle in the SBR. Note that the amount of PHA is the sum of the values of PHB, PHV and PH2MV. However, PHV was the most significant fraction.
Table 2.3: Biochemical transformations from a typical cycle in the SBR: comparison with metabolic models of Accumulibacter fed with acetate or propionate as sole carbon source.
Anaerobic results
Accumulibacter+Tetrasphaera
(this study)
Accumulibacter
Carbon source Casein hydrolysate Acetate Propionate P release/substrate
(P-mol/C-mol)
0.40 0.50 a 0.40 b
Glycogen/substrate (C-mol/C-mol)
0.45 0.50 a 0.33 b
PHB/substrate (C-mol/C-mol)
0.01 1.33 a 0.00 b
PHV/substrate (C-mol/C-mol)
0.04 0.00 a 0.56 b
PH2MV/substrate (C-mol/C-mol)
0.01 0.00 a 0.67 b
PHA/substrate (C-mol/C-mol)
0.06 1.33 a 1.23 b
Anaerobic pH 6.70.1 7 7
Aerobic results
P uptake (Pmmol/L) 1.54 2.50 c 2.20 c
% P in TSS 8-19 7-17 d 7-17 d
Glycogen production (C-mmol)
2.38 3.62 e 3.78 f
a
(Smolders et al., 1994a); b (Oehmen et al., 2005a); c (Oehmen et al., 2005b); d (Oehmen et al., 2007a); e (Smolders et al., 1994b) and f (Oehmen et al., 2007b).
2.3.2 Batch tests performance
Batch tests were performed with sludge from the main SBR to study the effects of a switch in carbon source from casein hydrolysate to one of the following carbon sources: glucose, acetate, propionate, glutamate, aspartate and glycine. The batch tests results are presented in Figure 2.3, Figure 2.4 and Figure 2.5. However, this discussion will be more focused on batch tests with individual feeding of acetate, propionate and glucose, and on the batch test with combined feeding of acetate, propionate and casamino acids, since it was not possible to have ready the results of amino acids uptake prior to the date of delivery of this thesis.
Figure 2.3: Comparison of carbon, P and PHAs profiles between batch experiments (1st and 2nd) performed with different carbon sources (acetate, propionate, glucose, glutamate, aspartate and glycine. Carbon profiles are only shown for tests with acetate (A and D), propionate (A and D) and glucose (C and
A B C
Figure 2.4: Results of batch experiment (3rd) performed with a combined feeding of acetate, propionate and casamino acids. A) Carbon and P profiles and B) PHAs profiles.
in both experiments) (see Figure 2.3-C and F).
The comparison between the uptake rates of acetate and propionate in the 1st and 2nd experiments is not very appropriate because they were fed different concentrations in C-mmol/L of each carbon source (this was performed in order to be consistent on a molar basis). However, this comparison can be made in the 3rd experiment since it was fed 2.90 C-mmol/L of each of the following carbon sources: acetate, propionate and casamino acids. As shown in Figure 2.4-A, the propionate was completely taken up by the mixed culture, and its uptake rate was the highest. About 88% of the acetate was consumed (corresponding to 2.54 C-mmol/L) and about 64% of casamino acids (corresponding to 1.85 C-mmol/L) were consumed. Noteworthy in this test, is that the uptake rate of acetate increased after propionate depletion, showing that propionate was preferred over acetate by the culture.
Relatively to P profiles, in both experiments with individual feed of acetate and propionate, P release was observed during the anaerobic phase (see Figure 2.3-A and D), and the same happened in the 3rd experiment with combined feeding of 3 carbon sources (see Figure 2.4-A). Aerobic P uptake was observed in the 2nd and 3rd experiments (these values are listed in Table 2.4). It is noteworthy that the initial concentration of phosphorus in the 2nd and 3rd experiments was different from zero (about 25-46 mg P/L) because contrary to what was done in the 1st experiment, wherein the sludge was diluted only with mineral medium, in these experiments the sludge was also diluted with effluent from the main SBR. Nonetheless, this effluent contains P since the settle/decant phase occurs between the anaerobic and aerobic phase. However, the fact that the initial concentration of P was different from zero makes these results more interesting since it is closer to the operation of a WWTP.
For this reason, surprising results were achieved relatively to P profiles with individual feed of glucose, aspartate, glutamate and glycine in the 2nd experiment. As shown in Figure 2.3-F, P uptake was observed during anaerobic phase in all tests: 19 ppm with glucose and 7-11 ppm with the other carbon sources (see Table 2.4). Considering that a typical value of P uptake in WWTPs is about 10 ppm, the values obtained in these tests cannot be ignored. The same did not happen in the 1st experiment, because as already mentioned the initial concentrations of P in these tests were zero. Consequently, there was a slight release of P with these carbon sources, except in the glucose test (see Figure 2.3-C and Table 2.4).
Table 2.4: Batch tests results of P release and uptake.
Carbon source Anaerobic P release
or uptake (mg P/L)
Aerobic P uptake (mg P/L) -Acetate
1st exp. in flasks 49.98 -
2nd exp. in reactor 20.71 14.13
-Propionate
1st exp. in flasks 56.49 -
2nd exp. in reactor 15.60 10.84
-Glucose
1st exp. in flasks 0.00 -
2nd exp. in reactor -18.51 3.07
-Aspartate
1st exp. in flasks 14.76 -
2nd exp. in reactor -8.90 7.69
-Glutamate
1st exp. in flasks 7.18 -
2nd exp. in reactor -11.14 3.72
-Glycine
1st exp. in flasks) 8.47 -
2nd exp. in reactor -7.03 0.00
-Acetate + Propionate + Casein
43.93 27.70
Relatively to the results obtained with aspartate, glutamate and glycine, although there was a slight P release in the 1st experiment, when its values are compared with those of acetate and propionate, it is evident that these releases were insignificant. On the other hand, in all tests (2nd experiment) the anaerobic P uptake was higher than aerobic P uptake. Thus, the same explanation given for the glucose test may be applied here, since no PHA production was found in all tests.
and propionate substrates. The P release to substrate uptake ratio was also lower in the 2nd experiment and of a similar level in the 3rd experiment. It should be noted that it could be that the presence of GAOs also had an influence on the activity of the culture. This can only be confirmed after further FISH analysis and comparison of the results with the glycogen utilisation ratios.
Table 2.5: Comparison of anaerobic biochemical transformations between batch experiments and metabolic models of Accumulibacter.
Carbon source P release or uptake/subs.
PHB/subs. PHV/subs. PH2MV/subs. PHA/subs.
- Acetate 1st exp. in flasks (this study)
0.40 1.38 0.15 0.00 1.53
2nd exp. in reactor (this study)
0.17 0.70 0.03 0.00 0.72
Accumulibacter 0.50 a 1.33 a 0.00 a 0.00 a 1.33 a
-Propionate 1st exp. in flasks (this study)
0.30 0.02 0.74 0.71 1.47
2nd exp. in reactor (this study)
0.10 0.00 0.18 0.18 0.36
Accumulibacter 0.40 b 0.00 b 0.56 b 0.67 b 1.23 b
-Glucose 1st exp. in flasks (this study)
0.00 0.00 0.00 0.00 0.00
2nd exp. in reactor (this study)
-0.22 0.00 0.00 0.00 0.00
-Acetate + Propionate + Casein (this study)
0.19 0.04 0.17 0.05 0.26
Note: All data expressed in C-mol/Cmol, apart from P release or uptake/subs., which is expressed in P-mol/Cmol.
a
(Smolders et al., 1994a); b (Oehmen et al., 2005a); c (Oehmen et al., 2005b); d (Oehmen et al., 2007a); e (Smolders et al., 1994b) and f (Oehmen et al., 2007b).
Table 2.6: Comparison of aerobic biochemical transformations between batch experiments and metabolic models of Accumulibacter.
Carbon source PHA oxidation/P
uptake (C-mol/P-mol)
PHA oxidation/PHA storage (%) - Acetate
2nd exp. in reactor (this study)
4.66 73.59
Accumulibacter 3.0 a 93.9 a
-Propionate 2nd exp. in reactor (this study)
2.79 53.26
Accumulibacter 2.3 a 78.1 a
-Acetate + Propionate + Casein (this study)
1.46 68.59
a
(Oehmen et al., 2005b).
The results of anaerobic and aerobic cell maintenance are represented in Figure 2.5-A and B, respectively. As shown in this Figure, the TOC profiles are constant over time, which makes sense since no carbon source was fed in these tests. No P release was found in anaerobic cell maintenance, while in the aerobic test, P uptake (23.57 mg P/L) was found. It suggests that in anaerobic maintenance, the cells use other type of energy source instead of P. On the other hand, in the test of aerobic maintenance, it is observable that the cells were able to use the energy provided by the remaining unidentified internal storage compound for P uptake. It means that the internal storage compound was not completely oxidized during the aerobic phase of the main SBR (note that the batch tests were inoculated with sludge from the main SBR at the end of the aerobic phase).
2.4 Conclusions and recommendations for future research
The metabolic behaviour of an enriched culture of Tetrasphaera-related organisms and Accumulibacter acclimatized with casamino acids as sole carbon source was identified. Anaerobically, this culture was able to perform: casamino acids uptake, P release, glycogen hydrolysis and very low PHA synthesis. On the other hand, in the aerobic phase this culture was able to perform: P uptake, glycogen formation and very low PHA oxidation. Future work is recommended in order to identify which polymer is produced in the anaerobic phase, and is used as carbon source, and consequently, energy source in the subsequent aerobic phase. It is noteworthy that both PAO groups were identified by their respective hybridization probes. However, Tetrasphaera-related organisms were the most abundant PAO group in all cyclic studies.