BGD
10, 6783–6837, 2013Modelling changes in nitrogen cycling to
sustain increases in forest productivity
R. F. Grant
Title Page
Abstract Introduction
Conclusions References
Tables Figures
◭ ◮
◭ ◮
Back Close
Full Screen / Esc
Printer-friendly Version
Interactive Discussion
Discussion
P
a
per
|
Dis
cussion
P
a
per
|
Discussion
P
a
per
|
Discussio
n
P
a
per
|
Biogeosciences Discuss., 10, 6783–6837, 2013 www.biogeosciences-discuss.net/10/6783/2013/ doi:10.5194/bgd-10-6783-2013
© Author(s) 2013. CC Attribution 3.0 License.
Open Access
Biogeosciences Discussions
Geoscientiic Geoscientiic
Geoscientiic Geoscientiic
This discussion paper is/has been under review for the journal Biogeosciences (BG). Please refer to the corresponding final paper in BG if available.
Modelling changes in nitrogen cycling to
sustain increases in forest productivity
under elevated atmospheric CO
2
and
contrasting site conditions
R. F. Grant
Department of Renewable Resources, University of Alberta, Edmonton, AB, T6G 2E3, Canada
Received: 2 February 2013 – Accepted: 27 February 2013 – Published: 17 April 2013
Correspondence to: R. F. Grant ([email protected])
BGD
10, 6783–6837, 2013Modelling changes in nitrogen cycling to
sustain increases in forest productivity
R. F. Grant
Title Page
Abstract Introduction
Conclusions References
Tables Figures
◭ ◮
◭ ◮
Back Close
Full Screen / Esc
Printer-friendly Version
Interactive Discussion
Discussion
P
a
per
|
Dis
cussion
P
a
per
|
Discussion
P
a
per
|
Discussio
n
P
a
per
|
Abstract
If increases in net primary productivity (NPP) caused by rising concentrations of at-mospheric CO2(Ca) are to be sustained, key N processes such as soil mineralization,
biological fixation, root uptake and plant translocation must be hastened. Simulating the response of these processes to elevatedCais therefore vital for models used to project 5
the effects of rising Ca on NPP. In this modelling study, hypotheses are proposed for
changes in soil mineralization, biological fixation, root uptake and plant translocation with changes in Ca. Algorithms developed from these hypotheses were tested in the
ecosystem modelecosysagainst changes in N and C cycling measured over several years under ambient vs. elevatedCain Free Air CO2Enrichment (FACE) experiments
10
at the Duke Forest in North Carolina, the Oak Ridge National Laboratory forest in Tennessee, and the USDA research forest in Wisconsin, USA. Simulating more rapid soil N mineralization was found to be vital for modelling sustained increases in NPP measured under elevated vs. ambientCa at all three FACE sites. This simulation was accomplished by priming decomposition of N-rich humus from increases in microbial
15
biomass generated by increased litterfall modelled under elevatedCa. Simulating more
rapid nonsymbiotic N2fixation, root N uptake and plant N translocation under elevated
Ca was found to make much smaller contributions to modelled increases in NPP,
al-though such contributions might be greater over longer periods and under more N-limited conditions than those simulated here. Greater increases in NPP withCa were
20
BGD
10, 6783–6837, 2013Modelling changes in nitrogen cycling to
sustain increases in forest productivity
R. F. Grant
Title Page
Abstract Introduction
Conclusions References
Tables Figures
◭ ◮
◭ ◮
Back Close
Full Screen / Esc
Printer-friendly Version
Interactive Discussion
Discussion
P
a
per
|
Dis
cussion
P
a
per
|
Discussion
P
a
per
|
Discussio
n
P
a
per
|
1 Introduction
The extent to which forest net primary productivity (NPP) increases under elevated at-mospheric CO2concentration (Ca) has been found to vary greatly with site conditions.
These increases are greater in warmer environments (Myers et al., 1999) because elevatedCasuppresses photorespiration (Long, 1991), in water-limited environments 5
(H ¨attenschwiler et al., 1997) because elevatedCareduces transpiration and raises
wa-ter use efficiency (Rogers et al., 1983), and in nutrient-rich environments which enable more rapid nutrient uptake (Oren et al., 2001).
In temperate forests, increases in NPP withCa have been found to be constrained
by the availability of nitrogen (N). This constraint may be greater in deciduous than
10
in coniferous forests because of their greater nutrient demands (Norby et al., 2010). Consequently studies of elevatedCaeffects on forest NPP and growth have given
vari-able results. Norby et al. (2005) found an increase in NPP of 23 % after 1–3 yr under 560 vs. 360 µmol mol−1 in a meta-analysis of Free Air CO2 Enrichment (FACE)
exper-iments with young, temperate-zone forests. However longer-term exposure of trees to
15
elevatedCahas shown this increase to decline over time (Hattenschwiler et al., 1997; Idso, 1999; Medlyn et al., 1999; Norby et al., 2010) unless N uptake increases com-mensurately with NPP (Oren et al., 2001).
Several changes in N processes have been observed in experimental studies by which N uptake and accumulation may be hastened under elevatedCa, thereby mod-20
erating long-term N limitations to NPP:
1. more rapid mineralization of soil N primed by increased litterfall (Crow et al., 2009; Drake et al., 2011; Phillips et al., 2011),
2. more rapid symbiotic or nonsymbiotic N2fixation primed by increased root C
allo-cation or litterfall (Hofmockel and Schlesinger, 2007; Norby, 1987),
25
BGD
10, 6783–6837, 2013Modelling changes in nitrogen cycling to
sustain increases in forest productivity
R. F. Grant
Title Page
Abstract Introduction
Conclusions References
Tables Figures
◭ ◮
◭ ◮
Back Close
Full Screen / Esc
Printer-friendly Version
Interactive Discussion
Discussion
P
a
per
|
Dis
cussion
P
a
per
|
Discussion
P
a
per
|
Discussio
n
P
a
per
|
4. greater translocation and recovery of N from senescing plant material (Drake et al., 2011).
Biogeochemical models used to forecast the response of forest productivity to rising
Ca must therefore simulate changes in these processes that result in additional N
up-take and retention (Crow et al., 2009; Finzi et al., 2007). These processes are either
5
absent or poorly represented in current models used to study the effects of risingCaon
forest growth (Iversen, 2010), although they are represented in detail in the ecosystem modelecosys(Grant et al., 2007, 2009a, b, c, 2010, 2011a). The importance of these processes to simulating sustained increases in forest NPP and growth under elevated vs. ambientCawas assessed by testing output from algorithms for these processes in 10
ecosysagainst changes in forest N and C cycling under elevated vs. ambientCa
mea-sured or calculated over several years from forest Free Air CO2 Enrichment (FACE)
experiments in the Duke Forest, Orange County NC, in the Oak Ridge National Lab-oratory (ORNL) forest at Oak Ridge TN, and the USDA Forest Service experimental farm in Rhinelander WI. Results from this testing were used to estimate the relative
15
contribution from each of these four processes to sustaining increases in forest NPP with elevated Ca under contrasting climates (temperature and precipitation) and tree functional types (coniferous vs. deciduous).
2 Model description
The key algorithms governing the simulation of C and N transformations in ecosys
20
are described in the Supplement to this article, in which equations and variables ref-erenced in the Results below are described and listed in Appendices A through H. Algorithms representing biological processes in soil (Appendices A, G and H), physical processes driving soil – plant – atmosphere water transfer (Appendix B), biological pro-cesses in plants (Appendices C and F), and chemical propro-cesses governing soil solute
25
BGD
10, 6783–6837, 2013Modelling changes in nitrogen cycling to
sustain increases in forest productivity
R. F. Grant
Title Page
Abstract Introduction
Conclusions References
Tables Figures
◭ ◮
◭ ◮
Back Close
Full Screen / Esc
Printer-friendly Version
Interactive Discussion
Discussion
P
a
per
|
Dis
cussion
P
a
per
|
Discussion
P
a
per
|
Discussio
n
P
a
per
|
in atmospheric boundary conditions. Algorithms representing physical processes driv-ing soil water, heat, gas and solute transfers (Appendix D) were solved at a 5 min time step assuming constant boundary conditions during each hour. All parameters in these algorithms remained unchanged from those in earlier studies of forests, crops and grasslands cited in the Introduction. The key model hypotheses for the effects of
5
elevatedCa on the four N processes given in the Introduction are described in further
detail below with reference to equations in the Supplementary Material
2.1 Model hypotheses for changes in N cycling under elevatedCa
2.1.1 More rapid mineralization of soil N primed by increased litterfall
Decomposition 10
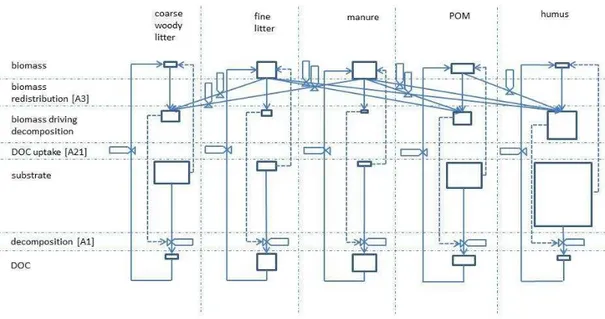
Organic transformations in ecosys occur in five organic matter–microbe complexes (coarse woody litter, leaf and fine non-woody litter, animal manure (if present), partic-ulate organic matter (POM), and humus), each of which consists of five organic states (three decomposition substrates – solid organic C, N and P, sorbed organic C, N and P, and microbial residue C, N and P, their decomposition products – dissolved organic
15
C, N and P (DOC, DON and DOP), and the decomposition agent, active microbial biomass (M)) in a surface residue layer and in each soil layer. The rates at which each of the three substrates decompose in each complex are first-order functions ofM in diverse heterotrophic microbial functional types, including obligate aerobes (bacteria and fungi), facultative anaerobes (denitrifiers), obligate anaerobes (fermenters),
het-20
erotrophic (acetotrophic) and autotrophic (hydrogenotrophic) methanogens, and aer-obic and anaeraer-obic heterotrophic diazotrophs (non-symbiotic N2 fixers) [A1, A2]. De-composition rates are also Monod functions of substrate C concentrations in soil [A4], calculated from the fraction of substrate mass colonized byM [A5]. These decomposi-tion rates drive transfers of C, N and P from the substrates to DOC, DON and DOP [A7].
BGD
10, 6783–6837, 2013Modelling changes in nitrogen cycling to
sustain increases in forest productivity
R. F. Grant
Title Page
Abstract Introduction
Conclusions References
Tables Figures
◭ ◮
◭ ◮
Back Close
Full Screen / Esc
Printer-friendly Version
Interactive Discussion
Discussion
P
a
per
|
Dis
cussion
P
a
per
|
Discussion
P
a
per
|
Discussio
n
P
a
per
|
Mineralization
Growth ofMby each microbial functional type in each organic matter–microbe complex [A25] is calculated from its uptake of DOC [A21], DON and DOP [A22]. Growth is driven by energy yields from growth respiration (Rg) [A20] remaining after subtracting maintenance respiration (Rm) [A18] from heterotrophic respiration (Rh) [A11] driven by
5
DOC oxidation [A13]. The resulting contents of C, N and P inMdrive rates of microbial decay [A23, A24], products of which are transferred to microbial residues and humus for further decomposition [A36]. Ratios of microbial C : N and C : P drive mineralization vs. immobilization of NH+4 [A26a, b] and H2PO−4 [A26d, e], soil concentrations of which
control root and mycorrhizal uptake [C23].
10
Priming
Values ofM used to drive decomposition [A1] are modelled by allowing M to transfer among the five organic matter-microbe complexes according to differences in the con-centration ofM with respect to that of its substrate in each complex [A3]. These trans-fers are indicated by changes in the relative sizes of the state variables for biomass
15
vs. those of their substrates before and after redistribution in Fig. 1. The larger specific decomposition rates used in the fine litter and manure complexes [A4] cause concen-trations of M vs. substrate in these complexes to be greater than those in the POM and humus complexes (Fig. 1). Consequently someM is transferred from the litter and manure to the POM and humus complexes, thereby priming decomposition of the
sub-20
strates in these complexes. Similarly, someMmay also be transferred from the POM to the humus complex. This transfer implements the hypothesis of Fontaine et al. (2004) that fast growing microbes specializing in utilization of fresh inputs produce extracellu-lar enzymes that metabolize not only fresh material, but also existing SOC. The priming caused by this transfer in ecosys has been tested against changes in decomposition,
25
BGD
10, 6783–6837, 2013Modelling changes in nitrogen cycling to
sustain increases in forest productivity
R. F. Grant
Title Page
Abstract Introduction
Conclusions References
Tables Figures
◭ ◮
◭ ◮
Back Close
Full Screen / Esc
Printer-friendly Version
Interactive Discussion
Discussion
P
a
per
|
Dis
cussion
P
a
per
|
Discussion
P
a
per
|
Discussio
n
P
a
per
|
larger litter substrate and hence larger M generated by increased litterfall, as occurs under elevatedCa. Because POM and humus have lower C : N ratios than does litter,
this priming favours mineralization over immobilization.
2.1.2 Greater biological N2fixation primed by increased litterfall
Nonsymbiotic diazotrophic M populations in each complex conduct N2 fixation [A27]
5
and associated respiration [A28] to remedy N deficits calculated from their biomass and C : N ratios. These deficits arise when biomass N from uptake of DON [A22] and immobilization of NH+4 and NO−3 [A26b, c] is less than that needed to attain set C : N ratios with biomass C from uptake of DOC [A21]. These deficits increase with larger litter substrate and hence larger diazotrophic M generated by increased litterfall, as
10
occurs under elevatedCa, particularly when higher litterfall C : N ratios increase DOC
vs. DON uptake. Under these conditions N2fixation rates increase, as observed exper-imentally by Jurgensen et al. (1992). The subsequent decay of diazotrophicM [A23] causes transfer of diazotrophic N [A24] to microbial residues and humus for decom-position and uptake by otherM [A36], and to NH+4 through mineralization [A26a], from
15
which it can contribute to root and mycorrhizal uptake [C23]. These same algorithms are used to model symbiotic diazotrophicM populations in roots of leguminous host plants (Appendix F).
2.1.3 Greater N uptake from denser and deeper root growth
C allocation and root growth 20
Growth of branch, root and mycorrhizal organs is driven by growth respirationRg[C17] and consequent assimilation of the nonstructural C product of CO2fixation (σC) [C20],
coupled with assimilation of the nonstructural N and P products of root and mycorrhizal uptake (σNandσP). Amounts ofσC,σNandσPin each organ are maintained by translo-cation along branch-root-mycorrhizal concentration gradients [C50–C53] generated by
BGD
10, 6783–6837, 2013Modelling changes in nitrogen cycling to
sustain increases in forest productivity
R. F. Grant
Title Page
Abstract Introduction
Conclusions References
Tables Figures
◭ ◮
◭ ◮
Back Close
Full Screen / Esc
Printer-friendly Version
Interactive Discussion
Discussion
P
a
per
|
Dis
cussion
P
a
per
|
Discussion
P
a
per
|
Discussio
n
P
a
per
|
production ofσC from branch CO2 fixation [C1–C12] and of σNand σP from root and mycorrhizal uptake [C23], vs. consumption ofσC,σN andσP from Rg and phytomass
growth [C20] (Grant, 1998).
Root growth and N uptake
Production and consumption in different plant organs are differently affected by
envi-5
ronmental conditions such as water or nutrient stress, so that translocation ofσC,σN
andσP, and hence growth of different organs, change with environmental conditions.
More rapid CO2fixation, as occurs under elevatedCa, raisesσC:σNandσC:σPratios in branches with respect to those in roots and mycorrhizae, and so increases branch-root-mycorrhizal concentration gradients ofσC[C50] while reducing those ofσNandσP 10
[C51]. These changes hasten transfer ofσC from branches to roots and mycorrhizae [C50, C52], and slow transfer of σN and σP from roots and mycorrhizae to branches
[C51, C53], thereby increasing root and mycorrhizalσC:σNratios and hence root and
mycorrhizal growth at the expense of branch growth. Consequent increases in root and mycorrhizal surface areas and lengths hasten N and P uptake [C23a–f] with respect to
15
CO2fixation. Increases in root and mycorrhizalσC:σNratios may further hasten N and
P uptake by reducing uptake product inhibition [C23g]. The model thus implements the shoot:root functional equilibrium hypothesis of Thornley (1995).
2.1.4 Greater translocation of N from senescing plant material
First-order respiration of σC [Rc in C14] drives autotrophic respiration (Ra) by all 20
branches, roots and mycorrhizae [C13]. Rc is first used to meet maintenance respi-ration requirements (Rm), calculated independently of Rc from the N content in each
organ [C16]. Any excess ofRc over Rm is expended as growth respirationRg, which
drives organ growth [C20]. WhenRm exceeds Rc, the shortfall is met by the respira-tion of remobilizable C (Rs) in leaves, roots and mycorrhizae [C15]. ThisRs drives the 25
BGD
10, 6783–6837, 2013Modelling changes in nitrogen cycling to
sustain increases in forest productivity
R. F. Grant
Title Page
Abstract Introduction
Conclusions References
Tables Figures
◭ ◮
◭ ◮
Back Close
Full Screen / Esc
Printer-friendly Version
Interactive Discussion
Discussion
P
a
per
|
Dis
cussion
P
a
per
|
Discussion
P
a
per
|
Discussio
n
P
a
per
|
andσP. Translocation of remobilizable N or P can also occur when ratios of σN:σC or σP:σCbecome smaller than those of structural N : C or P : C required for growth of new
phytomass, from the assumption that productivity is improved if new phytomass has priority for limiting nutrient reserves. This translocation increases retention ofσNorσP,
and hence availability ofσNorσPfor new growth.
5
Non-remobilizable C associated with translocated C is lost as litterfall C [C18], so that litterfall is not prescribed from assumed turnover rates, but arises from fixation vs. respiration of C and uptake vs. assimilation of N and P as determined by soil and weather. ElevatedCacould therefore hasten litterfall and increase translocation by
in-creasingRm with respect to Rc, or by reducingσN:σC with respect to structural N:C 10
required for growth. Amounts of litterfall N and P are reduced with respect to that of litterfall C by additional translocation of remobilizable N and P toσNandσP. This
addi-tional translocation increases as ratios ofσN:σC orσP:σC decline [C19], so that N : C
and P : C ratios in litterfall decline from those in the living phytomass from which it orig-inates. This decline in litterfall nutrient ratios therefore increases with declining nutrient
15
status as frequently, although not always, observed in field studies (Barnes et al., 1998; Kimmins, 2004). ElevatedCa could therefore increase this additional translocation by lowering ratios ofσN:σC.
In branches, translocation and hence litterfall start at the lowest node at which leaves are present, and proceeds upward until the requirement forRs,σNorσPby the branch is
20
met. In roots or mycorrhizae, translocation and hence litterfall start with secondary axes and proceeds to primary axes in each soil layer until the requirement forRs,σNorσPby
roots or mycorrhizae in the soil layer is met. For deciduous plant functional types, litter-fall is hastened by phenologically-driven withdrawal ofσC,σNandσP into storage pools
under shortening photoperiods and declining temperatures during autumn. These
stor-25
BGD
10, 6783–6837, 2013Modelling changes in nitrogen cycling to
sustain increases in forest productivity
R. F. Grant
Title Page
Abstract Introduction
Conclusions References
Tables Figures
◭ ◮
◭ ◮
Back Close
Full Screen / Esc
Printer-friendly Version
Interactive Discussion
Discussion
P
a
per
|
Dis
cussion
P
a
per
|
Discussion
P
a
per
|
Discussio
n
P
a
per
|
2.2 Effects of changes in N cycling on CO2fixation modelled under
elevatedCa
Each of the four changes in N processes described above contributes to maintaining foliarσNvs.σC under elevatedCa, the first three through increased N uptake, and the
fourth through increased N retention. In so doing, these changes help to maintainσC 5
andσNassimilation and hence leaf N concentrations [C12] and to reduceσC product inhibition (downregulation) of CO2 fixation [C11] under elevated Ca. These changes
therefore help to maintain elevated rates of CO2fixation under elevatedCa.
3 Model testing
Ecosyswas tested against measurements of NPP, phytomass growth and N
concen-10
trations in leaves and litterfall under ambient vs. elevatedCa in FACE experiments at
the Duke Forest in Orange County NC (35.98◦N, 79.91◦W), at the Oak Ridge National Lab (ORNL) in Oak Ridge TN, (35.90◦N, 84.33◦W) and at the USDA Forest Service experimental farm in Rhinelander WI (45.61◦N, 89.51◦W). A summary of site charac-teristics and methodology for these experiments is given in Finzi et al. (2007), Norby
15
et al. (2005), and in other references cited below. Modelling methodology at each site followed a common approach described below:
3.1 The Duke Forest FACE Experiment
Productivity of a loblolly pine (Pinus taeda) stand planted in 1983 was measured from 1997 to 2005 under ambient (∼371 µmol mol−1) vs. elevated (∼571 µmol mol−1) Ca 20
(Drake et al., 2011; McCarthy et al. 2010). The history of this site was simulated by planting a temperate coniferous functional type (e.g. Grant et al., 2007; 2009a) in 1958 on a soil with properties given in Oh and Richter (2005), and growing it until 1983 under historicalCaand repeating sequences of ½-hourly weather data recorded from
1997 to 2005 at the Duke Forest. Ammonium and nitrate concentrations in precipitation
BGD
10, 6783–6837, 2013Modelling changes in nitrogen cycling to
sustain increases in forest productivity
R. F. Grant
Title Page
Abstract Introduction
Conclusions References
Tables Figures
◭ ◮
◭ ◮
Back Close
Full Screen / Esc
Printer-friendly Version
Interactive Discussion
Discussion
P
a
per
|
Dis
cussion
P
a
per
|
Discussion
P
a
per
|
Discussio
n
P
a
per
|
were set to give wet N deposition rates reported in Drake et al. (2011), and atmo-spheric ammonia concentrations used to calculate ammonia deposition [D15] were set to 5 nmol mol−1. This spinup allowed the model to achieve stable changes in C stocks during successive weather sequences. The modelled stand was then clearcut (Grant et al., 2007) and a second stand was planted in 1983 with the same plant density as that
5
at which the field site was planted in the same year. This stand was grown until 2006 under 371 µmol mol−1Caand repeating sequences of ½-hourly weather data recorded
from 1997 to 2005 at the Duke Forest. This run was then repeated from 1997 to 2005 under 571 µmol mol−1Ca. To simulate the response to N fertilizer measured at the site,
both runs were repeated with annual fertilizer applications of 11.2 g N m−2as urea from
10
1998 to 2005 as described in McCarthy et al. (2010). Model output for NPP, phytomass and key N transfers were compared with those measured over the same period under the same changes inCa and N. Seasonal changes in forest productivity modelled
un-der ambient Ca were also tested against daily net CO2 exchange measured by eddy covariance in the Duke Forest under contrasting weather conditions (Katul and Oren,
15
2012).
3.2 The ORNL FACE Experiment
Productivity and N relations of a sweetgum (L. styraciflua L.) stand planted in 1988 was measured from 1998 to 2008 under ambient (∼370 µmol mol−1) vs. elevated
(∼550 µmol mol−1) Ca (Norby et al., 2010). The history of this site was simulated by 20
planting a temperate deciduous functional type (e.g. Grant et al., 2009a) in 1954 on a soil with properties given in Johnson et al. (2004), and growing it until 1988 un-der historical Ca and repeating sequences of ½-hourly weather data recorded from
1990 to 1998 at the ORNL Walker Branch site, and from 1999 to 2008 at the ORNL FACE site (Riggs et al., 2010). Ammonium and nitrate concentrations in precipitation
25
BGD
10, 6783–6837, 2013Modelling changes in nitrogen cycling to
sustain increases in forest productivity
R. F. Grant
Title Page
Abstract Introduction
Conclusions References
Tables Figures
◭ ◮
◭ ◮
Back Close
Full Screen / Esc
Printer-friendly Version
Interactive Discussion
Discussion
P
a
per
|
Dis
cussion
P
a
per
|
Discussion
P
a
per
|
Discussio
n
P
a
per
|
The modelled stand was then clearcut and a second stand was planted in 1988 with the same plant density as that at which the field site was planted in the same year. This stand was grown until 2008 under 370 µmol mol−1Caand repeating sequences of
½-hourly weather data recorded from 1990 to 1998 at the ORNL Walker Branch site and from 1999 to 2008 at the ORNL FACE site. This run was then repeated from 1998
5
to 2008 under 550 µmol mol−1Ca. To simulate the response to N fertilizer measured at
the site (Norby et al., 2010), the run under 370 µmol mol−1Ca was repeated with
an-nual fertilizer applications of 20 g N m−2 as urea from 2004 to 2008. Model results for
NPP, wood increment, leaf N concentrations and root mass were compared with those measured over the same period under the same changes inCaand N.
10
3.3 The Rhinelander FACE Experiment
Productivity and N relations of an aspen (Populus tremuloides Michx). stand planted in 1998 was measured from 1998 to 2006 under ambient (∼374 µmol mol−1) vs.
el-evated (∼541 µmol mol−1) Ca (King et al., 2005, Kubiske et al., 2010; Talhelm et al.,
2012). The history of this site was simulated by planting an annual cereal functional
15
type (e.g. Grant et al., 2011b) each year from 1956 to 1971 on a soil with proper-ties given in Dickson et al. (2000), under historical Ca and repeating sequences of
½-hourly weather data recorded from 1999 to 2006 at the Rhinelander FACE site. Am-monium and nitrate concentrations in precipitation were set to give wet N deposition rates reported in NADP maps for Wisconsin, and atmospheric ammonia
concentra-20
tions were set to 5 nmol mol−1. A boreal deciduous functional type (e.g. Grant et al.,
2009a) was then planted in 1972 and grown under 1999–2006 hourly weather data until 1996. This spinup allowed the model to achieve stable changes in C stocks dur-ing successive weather sequences. The stand was then clearcut and a second boreal deciduous stand was planted in 1996 with the same plant density as that at which
25
BGD
10, 6783–6837, 2013Modelling changes in nitrogen cycling to
sustain increases in forest productivity
R. F. Grant
Title Page
Abstract Introduction
Conclusions References
Tables Figures
◭ ◮
◭ ◮
Back Close
Full Screen / Esc
Printer-friendly Version
Interactive Discussion
Discussion
P
a
per
|
Dis
cussion
P
a
per
|
Discussion
P
a
per
|
Discussio
n
P
a
per
|
1999 to 2006 at the Rhinelander FACE site. This run was then repeated from 1998 to 2006 under 541 µmol mol−1Ca. Model results for NPP, wood increment and litter N
concentration were compared with those measured over the same period under the same changes inCa.
3.4 Sensitivity of modelled NPP to changes in N cycling under ambient vs. 5
elevatedCa
To examine sensitivity of NPP modelled under elevated vs. ambientCa to the N
pro-cesses described above, the model runs at the Duke FACE site were repeated with selected processes disabled. The extent to which priming of soil N mineralization (hy-pothesis 1) raised NPP under elevated vs. ambient Ca was examined by setting the 10
transfer rate constant in [A3a] to zero and offsetting the consequent slowing of POM and humus decomposition by increasing the specific rate constants for POM and hu-mus decomposition in [A4a]. In this way POM and huhu-mus decomposition was made independent of changes in litterfall caused by changes inCa. The extent to which more rapid nonsymbiotic N2 fixation (hypothesis 2) raised NPP under elevated vs. ambient 15
Cawas examined by disabling diazotrophic fixation in [A27]. The extent to which greater
translocation and recovery of N (hypothesis 4) raised NPP under elevated vs. ambient
Ca was examined by setting the translocation fractions for N and P in [C19c,d] to a
common value that was independent of changes in nonstructural N:C ratios caused by changes inCa. The extent to which increased root growth (hypothesis 3) raised NPP 20
under elevated vs. ambientCawas not directly tested because a simple intervention to make root growth independent ofCa in the model was not available. Results for NPP
with each disabled process were then compared with those from the model runs with all processes enabled.
To examine whether sensitivity of NPP modelled under elevated vs. ambientCa dif-25
BGD
10, 6783–6837, 2013Modelling changes in nitrogen cycling to
sustain increases in forest productivity
R. F. Grant
Title Page
Abstract Introduction
Conclusions References
Tables Figures
◭ ◮
◭ ◮
Back Close
Full Screen / Esc
Printer-friendly Version
Interactive Discussion
Discussion
P
a
per
|
Dis
cussion
P
a
per
|
Discussion
P
a
per
|
Discussio
n
P
a
per
|
used in the Duke FACE runs. NPP modelled under elevated vs. ambientCa at ORNL was then compared for the deciduous vs. coniferous types.
4 Results
4.1 The Duke Forest FACE Experiment
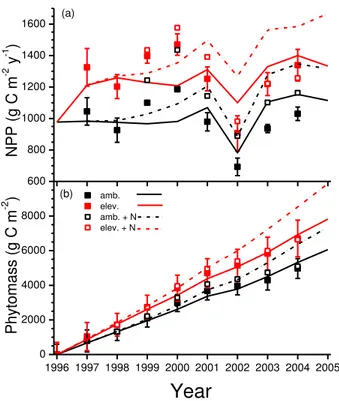
Net primary productivity measured and modelled without fertilizer at the Duke
For-5
est rose by 23–30 % from 1997 through 2001 after Ca was increased from 371 to 571 µmol mol−1 (Fig. 2a). Both rises were greater than 30 % in 2002 when drought re-duced modelled NPP less under elevated vs. ambient Ca. However measured rises
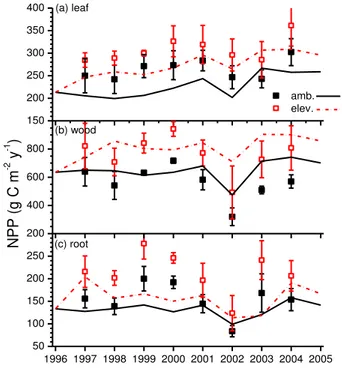
in NPP remained near 30 % during 2003 and 2004, while modelled rises declined to near 20 %. Almost 80 % of the measured and modelled rises in NPP were allocated to
10
leaves (Fig. 3a) and wood (Fig. 3b), and only about 20 % to roots (Fig. 3c).
Annual fertilizer applications caused modelled and measured NPP and phytomasses to rise above unfertilized values over time (Fig. 2a, b), indicating a slight N limitation to forest productivity at the Duke site. However rises in NPP modelled under 571 vs. 371 µmol mol−1C
awith fertilizer were similar to those without fertilizer (20–30 %), while 15
measured rises were smaller (10–20 %) (Fig. 2a). Consequently gains in phytomass modelled under elevatedCawith fertilizer were larger than those measured (Fig. 2b).
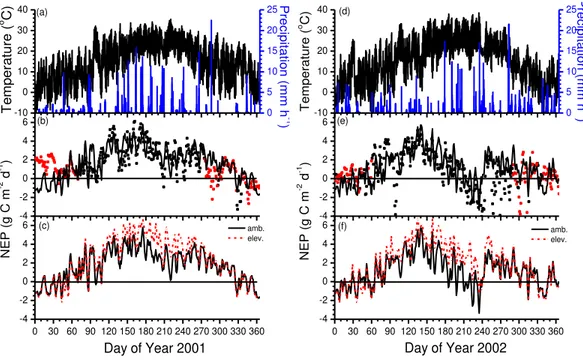
The presence of an eddy covariance flux tower in the Duke Forest enabled testing of net CO2exchange modelled under ambientCaand seasonal changes in air
temper-ature (Ta) and precipitation during two years, 2001 and 2002, with lower than average 20
annual precipitation. In 2001 with well-distributed precipitation during summer (Fig. 4a), daily-aggregated net CO2uptake rose withTauntil late June, but declined slightly with
further warming during July and August, so that the Duke forest remained a net sink of CO2 during most of the year (Fig. 4b). In 2002 with more variable precipitation (Fig. 4d), daily-aggregated net CO2uptake rose withTauntil late May, after which it de-25
BGD
10, 6783–6837, 2013Modelling changes in nitrogen cycling to
sustain increases in forest productivity
R. F. Grant
Title Page
Abstract Introduction
Conclusions References
Tables Figures
◭ ◮
◭ ◮
Back Close
Full Screen / Esc
Printer-friendly Version
Interactive Discussion
Discussion
P
a
per
|
Dis
cussion
P
a
per
|
Discussion
P
a
per
|
Discussio
n
P
a
per
|
so that the Duke forest became a net source of CO2 during late summer (Fig. 4e). Consequently annual NPP was lower in 2002 than in 2001 (Fig. 2a).
Increases in net CO2 exchange modelled under elevated vs. ambientCawere then
examined under the same seasonal changes inTaand precipitation in 2001 and 2002. Increases in net CO2uptake modelled in 2001 rose withTafrom near zero whileTawas 5
less than 15◦C during winter (Fig. 4a, d) to as much as 50 % whenTa rose above 25 ◦C during summer (Fig. 4c). Increases modelled in 2002 rose with soil drying during
August because net CO2uptake declined more slowly under elevated vs. ambientCa
(Fig. 4f). This slower decline was caused by higher soil water contents (θ) modelled under elevatedCabefore the drought (about 0.03 m3m−3) which allowed greater water
10
uptake, transpiration and hence CO2 fixation under elevated Ca as the drought
pro-gressed. This higherθwas caused by transpiration which had been reduced from that under ambientCa[B1c] since the start of the experiment in 1997 by increased canopy
stomatal resistance (rc) modelled from the different responses of carboxylation and
diffusion to elevatedCa[B2a] (Grant et al., 1999, 2004). During the drought, increased 15
rc modelled under elevatedCa caused higher canopy water potential (ψc) [B14] and
hence slower rises in rc [B2b] while ψc declined, further enabling CO2 fixation to be sustained during periods of low precipitation [C6a, C7a, C9] (Fig. 4f). These slower de-clines in net CO2fixation during drought caused greater increases in annual NPP to be
modelled under elevated vs. ambientCain 2002 than in 2001, although such increases
20
were not as apparent in the measured NPP (Fig. 2a).
These increases in NPP were driven by ones in gross primary productivity (GPP in [C1]) modelled under 571 vs. 371 µmol mol−1C
a(Table 1) caused by increases in
mes-ophyll aqueous CO2 concentrations [C6a], calculated from intercellular gaseous CO2
concentrations assumed to rise proportionally withCa. These increases in GPP were 25
partially offset by increases in autotrophic respiration (Rain [C13]) driven by increased biomassRm [C16] and Rg [C17] (Fig. 2b) when calculating increases in NPP. These
increases drove a cumulative gain in NPP of 2032 g C m−2
(2317 g C m−2
BGD
10, 6783–6837, 2013Modelling changes in nitrogen cycling to
sustain increases in forest productivity
R. F. Grant
Title Page
Abstract Introduction
Conclusions References
Tables Figures
◭ ◮
◭ ◮
Back Close
Full Screen / Esc
Printer-friendly Version
Interactive Discussion
Discussion
P
a
per
|
Dis
cussion
P
a
per
|
Discussion
P
a
per
|
Discussio
n
P
a
per
|
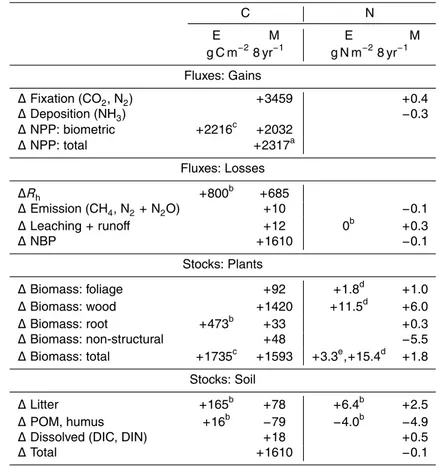
biometric measurements by McCarthy et al. (2010) (Table 1). This gain was partially offset by a cumulative increase in Rh of 685 g C m−
2
that was consistent with one of 800 g C m−2 estimated by Drake et al. (2011). This gain was further offset by small increases in C losses from CH4 emission, leaching and runoff, when calculating net
biome productivity (NBP) (=Flux Gains – Flux Losses in Table 1).
5
Almost 70 % of the cumulative gain in NPP modelled from 1997 to 2004 ap-peared in plant foliage, wood, root and nonstructural C stocks, giving a total gain in plant biomass of 1593 g C m−2 (Fig. 2b) which was similar to one of 1735 g C
m−2 derived from biometric measurements by McCarthy et al. (2010). The remain-ing 724 g C m−2 of this gain in NPP were returned to the soil as litterfall, consistent
10
with an increase of 79 g C m−2yr−1measured in 1998 by Finzi et al. (2001). Of this
in-crease in litterfall, 316 g C m−2was above-ground, corresponding to increased inputs of 48±14 g C m−2yr−1measured in the forest floor by Lichter et al. (2008), which included
some root litterfall. The remaining 408 g C m−2of the increase in modelled litterfall was
below-ground, which was greater than an increase of 15 g C m−2yr−1 in root litterfall
15
averaged from measurements over this period by Pritchard et al. (2008a).
This increase in modelled litterfall generated a rise in midseason M of 21 % un-der elevated Ca [A25], similar to one of 15 % in microbial C estimated by Drake et
al. (2011), which drove the modelled increase in Rh [A11] (Table 1). Differences
be-tween increases in litterfall andRh caused changes in soil C stocks, including a gain
20
in litter, but a loss in POC and humus, the decomposition of which was primed by the increase inMfrom litterfall [A3] (Fig. 1). These gains in soil C were slightly smaller than those estimated by Drake et al. (2011) (Table 1).
Additional N required to sustain the increase in GPP modelled under elevated vs. ambientCawas partially provided by a small cumulative increase in nonsymbiotic N2 25
fixation [A27] driven by that in Rh (Table 1). This increase arose from modelled rates of N2 fixation averaging 0.180 vs. 0.175 g N m−2yr−1 under elevated vs. ambient C
a,
BGD
10, 6783–6837, 2013Modelling changes in nitrogen cycling to
sustain increases in forest productivity
R. F. Grant
Title Page
Abstract Introduction
Conclusions References
Tables Figures
◭ ◮
◭ ◮
Back Close
Full Screen / Esc
Printer-friendly Version
Interactive Discussion
Discussion
P
a
per
|
Dis
cussion
P
a
per
|
Discussion
P
a
per
|
Discussio
n
P
a
per
|
a decrease in atmospheric NH3 deposition to the canopy [D15], and by an increase
in N leaching, both caused by reduced stomatal conductance (gc) and transpiration modelled under elevatedCa [B2a], except during drought as described earlier. Wet N
deposition was the same under both ambient and elevatedCaand so was not included
in Table 1.
5
The cumulative difference in N inputs modelled under elevated vs. ambient Ca did
not account for the gains in plant structural N stocks needed to sustain the increases in plant structural C stocks (Table 1). Most of these gains were consequently drawn from plant nonstructural N stocks in seasonal reserves used in the model to buffer dif-ferences between plant N requirements and root N uptake under variable growth
con-10
ditions. The remainder of these gains was drawn from soil N stocks through increased mineralization of POM and humus N [A26a], driven by the more rapid decomposition of POM and humus C described earlier (Table 1). The consequent decline in POM and humus N stocks (Table 1) was partially offset by a gain in litter N stocks from immobi-lization of some of the additional NH+4 and NO−3 [A26b, c] mineralized from POM and
15
humus. This loss in POM and humus N stocks, and gain in litter N stocks, were consis-tent with the loss in mineral-associated C and gain in organic horizon C estimated by Drake et al. (2011) (Table 1).
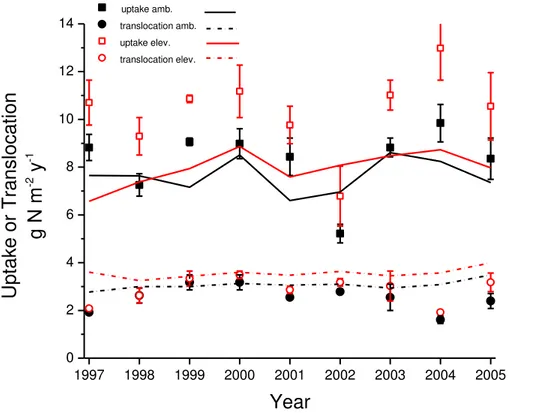
The gain of plant N and loss of soil N modelled under elevated vs. ambientCa
(Ta-ble 1) was achieved by increased root and mycorrhizal uptake [C23] of the N
mineral-20
ized from POM and humus and not immobilized in litter, and by increased translocation of N from senescing plant material [C19] (Fig. 5). This increase in translocation caused litterfall N modelled under elevatedCato remain similar to that modelled under
ambi-entCa, in spite of the increase in litterfall C (Table 1), and so enabled the increase in N uptake modelled under elevatedCato be almost fully retained in the forest canopy. 25
These modelled increases in uptake and translocation were corroborated by experi-mental findings (Drake et al., 2011) (Fig. 5).
The modelled increases in N2 fixation, uptake and translocation (Table 1; Fig. 5)
BGD
10, 6783–6837, 2013Modelling changes in nitrogen cycling to
sustain increases in forest productivity
R. F. Grant
Title Page
Abstract Introduction
Conclusions References
Tables Figures
◭ ◮
◭ ◮
Back Close
Full Screen / Esc
Printer-friendly Version
Interactive Discussion
Discussion
P
a
per
|
Dis
cussion
P
a
per
|
Discussion
P
a
per
|
Discussio
n
P
a
per
|
elevatedCa as the experiment progressed (Fig. 2). The contribution of each of these
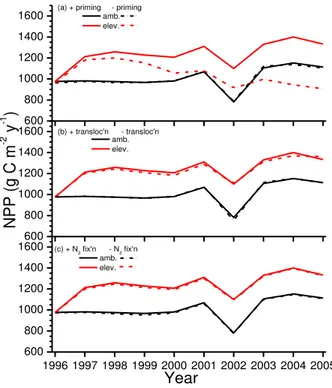
processes to increases in NPP was then examined by modelling changes in these in-creases when each process was disabled. When the algorithm for priming POM and humus decomposition by litterfall was disabled [A3] (Fig. 1), the model was unable to simulate rises in NPP consistent with those modelled and measured after the first
5
2 yr under elevatedCa (Fig. 6a). When the algorithm for the effect ofσN:σC ratios on
translocation was disabled [C19], the model simulated rises in NPP under elevatedCa
that were only slightly smaller than those with the algorithm enabled (Fig. 6b). When nonsymbiotic N2fixation was disabled [A27], NPP modelled under both ambient and
el-evatedCawas only marginally reduced (Fig. 6c). The algorithm for priming was appar-10
ently essential for modelling NPP response to elevatedCa, while those for translocation and N2fixation were much less so.
However modelled gains in plant N through increased root N uptake and transloca-tion under elevatedCa (Fig. 5) were not commensurate with those in plant C through increased NPP (Fig. 2a). Consequently the model simulated a rise in the NPP:N
up-15
take ratio from 162 to 173 g C g N−1 under 371 vs. 571 µmol mol−1Ca. The increase in
this ratio was consistent with one from 158 to 170 g C g N−1(assuming 0.5 g C g DM−1)
measured at the Duke FACE site by Finzi et al. (2007). Consequently foliar N concen-trations modelled in 1998 declined from 24.0 to 22.6 mg N g C−1while those measured in the same year by Finzi et al. (2001) declined from 21.0 to 18.8 mg N g C−1, although 20
this measured decline was considered to be nonsignificant. These rises in NPP : N uptake ratios and consequent declines in foliar N concentrations suggest a gradually increasing N limitation that will eventually reduce future increases in NPP.
4.2 The ORNL FACE Experiment
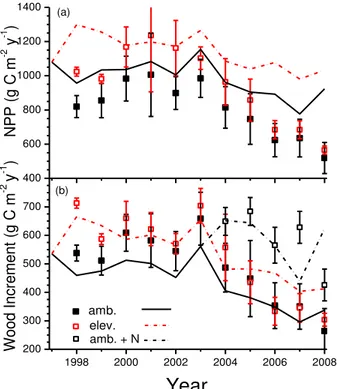
Net primary productivity modelled at ORNL was generally larger than that derived from
25
measurements (Fig. 7a), although wood growth increments were similar (Fig. 7b). NPP modelled under 550 µmol mol−1Ca rose sharply above that under 370 µmol mol−
1
Ca
BGD
10, 6783–6837, 2013Modelling changes in nitrogen cycling to
sustain increases in forest productivity
R. F. Grant
Title Page
Abstract Introduction
Conclusions References
Tables Figures
◭ ◮
◭ ◮
Back Close
Full Screen / Esc
Printer-friendly Version
Interactive Discussion
Discussion
P
a
per
|
Dis
cussion
P
a
per
|
Discussion
P
a
per
|
Discussio
n
P
a
per
|
thereafter so that gains in NPP modelled under elevatedCa became smaller as the
experiment progressed. Almost 80 % of the modelled rise in NPP was allocated to leaves (Fig. 8a) and wood (Fig. 8b), and onlyca. 20 % to roots (Fig. 8c) as was mod-elled at Duke (Fig. 3). Gains in leaf NPP modmod-elled under elevated Ca in the model
were larger, while those in root NPP were smaller, than gains derived from biometric
5
measurements by Norby et al. (2010) who attributed most of the total gain in NPP at ORNL to root production, particularly in 2000–2002 (Fig. 8c). The greater modelled vs. measured NPP (Fig. 7a) was mostly attributed to greater modelled vs. measured root NPP (Fig. 8c).
Norby et al. (2010) attributed these declining gains in NPP to more rapid declines in
10
tree N status, apparent in lower foliar N concentrations measured under elevatedCa
(Fig. 9). Lower foliar N concentrations were also modelled [C6, C12] through changes inσNvs.σC[C11], although values were consistently 15 mg N g C−
1
larger than those measured (Fig. 9). Strong N limitations to NPP were also indicated by the sharp rise in wood increment measured and modelled under ambient Ca after fertilizer applica-15
tion started in 2004 (Fig. 7b). In the model, declining N status caused greater alloca-tion ofσC,σNand σP to roots vs. leaves and wood [C50–C53], so that root NPP was maintained (Fig. 8c) while leaf and wood NPP declined (Fig. 8a, b) as the experiment progressed.
The modelled trend towards smaller gains in NPP as the experiment progressed was
20
reversed in 2002, 2006 and 2007 (Fig. 7a). During these years soil drying following lower than average precipitation in 2001 and in 2005–2007 caused smaller declines in NPP to be modelled under elevated vs. ambientCa(Fig. 7a), as at the Duke Forest in 2002 (Fig. 2a). Smaller declines under elevatedCawere also apparent in NPP derived
from measurements in 2002, but not in 2006 and 2007. The greater decline in NPP
25
measured under elevated vs. ambientCain 2007 was attributed by Warren et al. (2011) to greater declines in transpiration, gc and hence C gain under elevated Ca during
BGD
10, 6783–6837, 2013Modelling changes in nitrogen cycling to
sustain increases in forest productivity
R. F. Grant
Title Page
Abstract Introduction
Conclusions References
Tables Figures
◭ ◮
◭ ◮
Back Close
Full Screen / Esc
Printer-friendly Version
Interactive Discussion
Discussion
P
a
per
|
Dis
cussion
P
a
per
|
Discussion
P
a
per
|
Discussio
n
P
a
per
|
et al. (2011), allowed smaller declines in transpiration,gcand hence in net C uptake to be modelled under elevatedCaas droughts progressed.
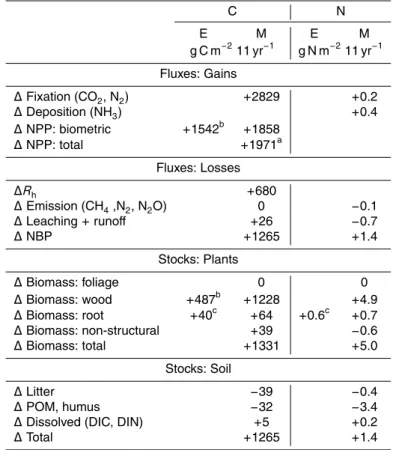
Increases in GPP [C1] modelled under 550 vs. 370 µmol mol−1 Ca drove a
cumu-lative gain in NPP from 1998 to 2008 of 1858 g C m−2 (1971 g C m−2 including root
exudation), slightly greater than one of 1542 g C m−2 derived from biometric
measure-5
ments by Norby et al. (2010) (Table 2). This gain was partially offset by an increase of 680 g C m−2inR
h, and by a small increase in C losses from leaching and runoff, when
calculating NBP (Table 2).
About two-thirds of the gain in NPP modelled from 1998 to 2008 appeared in plant wood, root and nonstructural C stocks (Table 2). Gains in foliar stocks were
10
not modelled because values were calculated at the end of each year after leafoff. The remaining 640 g C m−2 of this gain in NPP were returned to the soil as litter-fall, of which 302 g C m−2 was above-ground, consistent with an annual increase of 40 g C m−2yr−1 in surface litterfall measured in 2000 by Johnson et al. (2004). The remaining 338 g C m−2 of the increase in modelled litterfall was below-ground, which
15
was less than the 675±500 g C m−2increase in total root litterfall estimated to 2006 by
Iversen et al. (2008).
This increase in modelled litterfall generated a rise in midseasonMof 9 % [A25], sim-ilar to one of 13 % in microbial C measured in July 2000 by Johnson et al. (2004), which drove the modelled increase inRh[A11] (Table 2). This increase slightly exceeded that 20
in litterfall, causing small declines in litter, POM and humus C stocks primed by the increase inM from litterfall [A3] (Fig. 1). These declines contrasted with a substantial increase in soil C measured by Iversen et al. (2012) under elevated vs. ambientCa in 2009, but this increase was also apparent in pretreatment measurements of soil C by Johnson et al. (2004) and so may have been caused by natural soil variability.
25
Additional N required to sustain the increase in GPP modelled under elevated vs. ambient Ca was partially provided by a small cumulative increase in nonsymbiotic
N2 fixation [A27], and in atmospheric NH3 deposition due to greater N
BGD
10, 6783–6837, 2013Modelling changes in nitrogen cycling to
sustain increases in forest productivity
R. F. Grant
Title Page
Abstract Introduction
Conclusions References
Tables Figures
◭ ◮
◭ ◮
Back Close
Full Screen / Esc
Printer-friendly Version
Interactive Discussion
Discussion
P
a
per
|
Dis
cussion
P
a
per
|
Discussion
P
a
per
|
Discussio
n
P
a
per
|
losses from emissions and leaching caused by greater N immobilization [A26] in the soil profile at this N-limited site (Table 2). The reduction in N loss from leaching in the model was consistent with one of 0.2 g N m−2yr−1measured experimentally in 1999 by Johnson et al. (2004).
The cumulative net gains in N inputs partly accounted for the substantial increase
5
in plant structural N stocks needed to sustain increases in plant structural C stocks (Table 2). Some of this increase in plant structural N stocks was drawn from plant non-structural N stocks, and the remainder was drawn from soil N stocks through increased mineralization of POM and humus N [A26a], driven by the more rapid decomposition of POM and humus C described earlier.
10
As for the Duke Forest, the gain of plant N and loss of soil N modelled under elevated vs. ambientCaat ORNL (Table 2) was achieved by increased root and mycorrhizal
up-take [C23], some of which might be attributed to increased root and mycorrhizal growth as well as to priming of humus decomposition. Detailed measurements of root produc-tivity by Iversen et al. (2008) enabled testing of changes in root growth and function
15
modelled under ambient vs. elevated Ca (Fig. 10a). Modelled root and mycorrhizal
mass densities increased under 550 vs. 370 µmol mol−1C
a (Fig. 9), but less than did
measured values during 2001 (Fig. 10a), the year of greatest root productivity reported in Iversen et al. (2008) (Fig. 8c).
In the model, greater root and mycorrhizal growth [C20b] under elevated Ca was
20
driven by greater shoot- root and root-mycorrhizal transfers of σC [C50, C52] from
greater concentration gradients generated by greater CO2 fixation [C1] (Grant, 1998)
(Fig. 10a). Greater growth drove greater root and mycorrhizal elongation [C21b, c] (Fig. 10b) used to calculate path lengths and surface areas for mineral N uptake [C23a– d]. Greater σC concentrations drove an increase in C exudation [C19e-i] of 53 vs. 25
42 g C m−2yr−1 (Grant, 1993) (Fig. 10c), while more rapid root and mycorrhizal
res-piration [C15] and lowerσN vs.σC drove an increase in root and mycorrhizal litterfall
BGD
10, 6783–6837, 2013Modelling changes in nitrogen cycling to
sustain increases in forest productivity
R. F. Grant
Title Page
Abstract Introduction
Conclusions References
Tables Figures
◭ ◮
◭ ◮
Back Close
Full Screen / Esc
Printer-friendly Version
Interactive Discussion
Discussion
P
a
per
|
Dis
cussion
P
a
per
|
Discussion
P
a
per
|
Discussio
n
P
a
per
|
al. (2008). These increases in exudation and litterfall provided more substrate for litter
Mgrowth [A1] and hence priming of POM and humus decomposition [A3] (Fig. 1) under elevatedCa. However greater root and mycorrhizal elongation generated only slightly
more rapid mineral N uptake [C23a–d], in which increases in mycorrhizal uptake offset reductions in root uptake below 0.5 m (Fig. 10d).
5
Gains in NPP modelled and measured at ORNL were smaller than those at the Duke Forest after the third year under elevatedCa(Fig. 7a vs. Fig. 2a) in spite of similar soil
attributes and climate, suggesting that deciduous forests may respond less to elevated
Ca than do coniferous. When the deciduous functional type used the ORNL
simula-tions was replaced with the coniferous one used at Duke, values of NPP modelled
10
under ambient and elevatedCa remained similar to those modelled earlier from 1998 to 2004 (Fig. 11a). However NPP modelled for the coniferous functional type under ambient Ca did not decline thereafter while that under elevated Ca rose (Fig. 11a).
The smaller gains in NPP modelled for the deciduous functional type under elevated
Cafrom 2005 through 2008 were attributed to larger declines in leaf N concentrations 15
than those for the coniferous functional type (Fig. 11b). These greater declines were caused by greater N loss from above-ground litterfall relative to N gain from root up-take, and hence less retention of N in the deciduous canopy than in the coniferous. This lesser retention was caused by phenology-driven withdrawal of branchσC,σNand
σPand consequent additional litterfall modelled during autumn in deciduous functional
20
types. Less retention of N was apparent in smaller ratios of NPP:N uptake modelled at ORNL (90 vs. 108 g C g N−1under 370 vs. 550 µmol mol−1Ca) than at Duke (162 vs.
173 g C g N−1). These smaller ratios were consistent with ones of 120 vs. 112 g C g N−1
(assuming 0.5 g C g DM−1) measured at ORNL by Finzi et al. (2007). Consequently ratios of NPP modelled under elevated vs. ambientCaremained smaller for the decid-25
BGD
10, 6783–6837, 2013Modelling changes in nitrogen cycling to
sustain increases in forest productivity
R. F. Grant
Title Page
Abstract Introduction
Conclusions References
Tables Figures
◭ ◮
◭ ◮
Back Close
Full Screen / Esc
Printer-friendly Version
Interactive Discussion
Discussion
P
a
per
|
Dis
cussion
P
a
per
|
Discussion
P
a
per
|
Discussio
n
P
a
per
|
4.3 The Rhinelander FACE Experiment
The forest stands at Rhinelander were exposed to elevated vs. ambientCawithin a year
of planting, so that elevatedCa raised GPP [C1] and hence NPP during early growth by increasing both CO2 fixation rates per unit leaf area [C6a] and leaf area growth
[C21a]. Consequently gains in NPP modelled under elevatedCa were relatively large 5
during 1998 and 1999 when elevatedCaincreased leaf area growth at low values of LAI limiting to CO2 fixation (Fig. 12a). These gains declined from 2000 to 2004 when LAI
attained values less limiting to CO2 fixation. Only ∼60 % of these gains in NPP were
allocated to foliar and wood production in the model (Fig. 13a, b), with the remainder allocated to root production (Fig. 13c). However measured gains were allocated more
10
to foliar and wood production and less to root production than were modelled gains, so that root and hence total NPP in the model rose above that measured as the experiment progressed.
Declining gains in NPP modelled from 2001 to 2004 (Fig. 12a) were not attributed to increasing N limitation, because litterfall N concentrations measured and modelled
un-15
der ambient and elevatedCadid not decline as the experiment progressed, in contrast to ORNL where foliar N concentrations declined (Fig. 9). Some N limitation to gains in NPP was apparent in lower litterfall N concentrations measured and modelled under elevated Ca (Fig. 14), due in the model to lower foliar N concentrations and greater N translocation as modelled at the other sites (Figs. 5 and 9). Kubiske et al. (2010)
20
attributed declining gains in tree growth measured from 2001 to 2004 under elevated vs. ambientCa(Fig. 12b) to declining July radiation recorded at Rhinelander. This de-cline was accompanied by one in temperature, causing modelled and measured rises in NPP and wood increment to slow under ambientCa, and more so under elevatedCa,
during 2001–2004 (Fig. 12a, b). Conversely, radiation andTarecorded at Rhinelander
25
BGD
10, 6783–6837, 2013Modelling changes in nitrogen cycling to
sustain increases in forest productivity
R. F. Grant
Title Page
Abstract Introduction
Conclusions References
Tables Figures
◭ ◮
◭ ◮
Back Close
Full Screen / Esc
Printer-friendly Version
Interactive Discussion
Discussion
P
a
per
|
Dis
cussion
P
a
per
|
Discussion
P
a
per
|
Discussio
n
P
a
per
|
These responses of modelled NPP to radiation andTa suggested that some of the
interannual variation in gains of NPP under elevated vs. ambientCacould be attributed
to responses of CO2 fixation to seasonal variation in weather. Because 2004 and
2005 were the coolest and warmest years respectively during the experimental pe-riod (May–September 2004 vs. 2005: average radiation 18.4 vs. 19.7 MJ m−2
d−1
,
av-5
erageTa 15.1 vs. 17.1◦C), days with contrasting radiation and Ta in these two years
were selected to examine modelled response of diurnal CO2 exchange to 541 vs.
374 µmol mol−1C
a (Fig. 15). Radiation recorded during DOY 202–203 was higher in
2005 than in 2004 (Fig. 15a) while daytime Ta was similar (Fig. 15b). Rises in CO2
influxes modelled under elevated vs. ambient Ca were greater during DOY 202–203 10
in 2005 vs. 2004, particularly with lower radiation during DOY 203 in 2004 (Fig. 15c). Greater rises in CO2 influxes with higherCawere modelled under higher radiation
be-cause CO2-limited carboxylation [C6a] responded more toCathan did radiation-limited
carboxylation [C7a, b].
Values of Ta recorded during DOY 218–219 were higher in 2005 than in 2004 15
(Fig. 15a) while radiation was similar (Fig. 15b). Rises in CO2influxes modelled under
elevated vs. ambient Ca were greater during DOY 218–219 in 2005 vs. 2004, partic-ularly with lowerTa during DOY 218 in 2004 (Fig. 15c). Greater rises in CO2 influxes
with elevatedCa were modelled under higherTa because elevated Ca offset adverse
effects of higherTaon carboxylation through increased CO2compensation points [C6c,
20
d] and Michaelis-Menten constants [C6e], and through decreased solubility of CO2vs. O2 [C6a], thereby reducing photorespiration vs. carboxylation. These greater rises in
CO2influxes modelled with higherCaunder higher radiation andTacontributed to the
greater gains in NPP and wood increment modelled in 2005 vs. 2004 (Fig. 12).
Increases in GPP [C1] modelled under 541 vs. 374 µmol mol−1 Ca [C1] (Fig. 15) 25
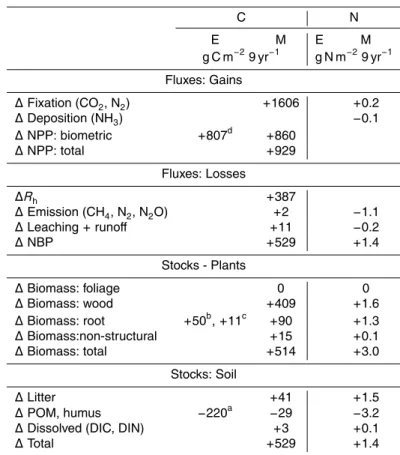
drove a cumulative gain in NPP from 1998 to 2006 of 860 g C m−2 (Table 3) which on an annual basis was smaller than one of 807 g C m−2
BGD
10, 6783–6837, 2013Modelling changes in nitrogen cycling to
sustain increases in forest productivity
R. F. Grant
Title Page
Abstract Introduction
Conclusions References
Tables Figures
◭ ◮
◭ ◮
Back Close
Full Screen / Esc
Printer-friendly Version
Interactive Discussion
Discussion
P
a
per
|
Dis
cussion
P
a
per
|
Discussion
P
a
per
|
Discussio
n
P
a
per
|
an increase inRh of 387 g C m− 2
and by small increases in C losses from emission, leaching and runoff(Table 3).
About 55 % of modelled gains in NPP appeared in plant wood, root and nonstruc-tural C stocks (Table 3). Gains in foliar stocks were not modelled because values were calculated at the end of each year after leafoff. The remaining 415 g C m−2of this gain
5
in NPP were returned to the soil as litterfall, of which 149 g C m−2was above-ground,
consistent with an increase in annual surface litterfall of 32 g C m−2yr−1 measured in 2003 by Liu et al. (2005) and an average of 30 g C m−2yr−1 measured from 2002 to 2008 by Talhelm et al. (2012). The remaining 266 g C m−2 of the increase in modelled
litterfall was below-ground.
10
This increase in modelled litterfall drove the modelled increase inRh(Table 3) which
almost entirely offset that in litterfall, causing a small rise in litter C stocks and a small decline in POM and humus C stocks primed by an increase in M from litterfall [A3] (Fig. 1). These changes in soil C stocks in the model were consistent with a small increase in coarse POM stocks and concurrent small decrease in mineral-associated
15
organic matter observed by Hofmockel et al. (2011b) under elevated vs. ambientCaat
Rhinelander.
Additional N required to sustain the increase in GPP modelled under elevated vs. ambientCawas partially provided by a small cumulative increase in nonsymbiotic N2
fixation [A27], partially offset by a small decrease in atmospheric NH3 deposition (Ta-20
ble 3). Additional N was provided by reductions in N losses from emissions and leach-ing caused by greater N immobilization in the soil profile [A26].
The cumulative net gain in soil N inputs partly accounted for the increase in plant structural N stocks needed to sustain the increase in plant structural C stocks (Ta-ble 3). The remainder of this increase was drawn from soil N stocks through increased
25