BJRS
RADIATION SCIENCES
04-02 (2016) 01-15CTDI versus New AAPM Metrics to assess Doses in CT:
a case study
M. C. S. Campelo
a; M. C. Silva
b; R. A. Terini
ca Curso de Física, Pontifícia Universidade Católica de São Paulo, 01303-050, S. Paulo, SP, Brasil.
maria.macalidi@gmail.com
b Setor de Física Médica, Hospital Israelita Albert Einstein (HIAE), 01308-050, São Paulo, SP, Brasil..
marciac.silvag@gmail.com
c Laboratório de Ensaios Não-Destrutivos (LABEND), Instituto de Energia e Ambiente, 05508-010, Universidade de São Paulo, Cidade Universitária, S. Paulo, SP, Brasil.
ricardoaterini@gmail.com
ABSTRACT
In modern CT, CTDI100 measurements would underestimate accumulated dose at the gantry center. AAPM TG 111 report proposed improved metrics for CT dosimetry, mainly for helical and wide beam width scanning. In this study, a methodology to assess CT dose, inspired on TG 111, was applied. Dosimeters were firstly calibrated in lab in beams like those utilized clinically. Using a reference 0.6cc Farmer chamber, two CT “pencil” chambers were cali-brated in PKL by substitution method. Results showed differences ≤ 2% in the calibration coefficients, for three col-limation apertures. A small 0.6cc chamber was calibrated in air kerma with this setup, without any collimator. After this, in a private Brazilian hospital, the small chamber was applied in dosimetry tests of a CT scanner, according to TG 111, determining Dose profiles and Equilibrium dose free-in-air (Deq,air) for some protocols and pitch values. Results showed that Deq,air increased when reducing pitch and Equilibrium dose-pitch product free in air (p.Deq,air) remain constant. In measurements with a 450mm CT phantom, differences between Planar Average Equilibrium Dose (Deq,p) and CTDIvol ranged between 30-37%. This occurs because CTDIvol cannot include dose profile "tail" contribution, caused by scattering in phantom, especially for wide beam widths.
Keywords:
1. INTRODUCTION
Computed tomography (CT) is among the largest sources of collective radiation dose. Absorbed dose in CT exams can be more than ten times higher than in other common radio-graphic procedures(1). Smith-Bindman et al. (2009)(2) demonstrated that, for example, the median
effective dose delivered through a single routine chest CT scan was equivalent to 119 ordinary chest radiograph series.
In 2008(3), from more than 2 billion radiological exams (medical, dental, etc.) performed
annually, 5% were CT scans. This fraction, however, accounted for 34% of the world annual collective dose. Radiation exposure in CT has increased substantially over the past two decades due to the growing number of new installed scanners and CT procedures requests. It’s a consen-sus that efforts need to be undertaken, including careful dosimetry, to minimize radiation risks and harms from CT, avoiding unnecessary studies, reducing the dose per study and the variation in dose across patients and facilities(2).
CT dosimetry is generally performed using an ionization chamber with 100mm length (the "pencil" chamber). First of all, to obtain reliable values, the utilized dosimeters should be properly calibrated in beams and setups like those measured clinically(1,4). For this purpose, CT
standard beams should be characterized in the dosimetry lab where the calibration should be per-formed.
To assess dose information in CT clinical procedures, pencil chambers are generally ap-plied to obtain measurements both in air or inserted into cylindrical phantoms, to determine the CT Dose Index (CTDI100). In the latter case, the chamber also detects scattered radiation
gener-ated in the phantom when irradigener-ated, which is included in the total exposure of the patient. This requires that the response of the sensitive volume of the CT chamber be uniform throughout the axial length. Thus, first, the calibration methodology of such dosimeters should be revised in the light of the recent modalities and image acquisition technologies in CT(4).
Furthermore, AAPM Task Group 111(5) recently proposed improved metrics for CT
do-simetry, using a small ion chamber, instead of the usual pencil one, positioned in a phantom long enough to establish dose equilibrium at the chamber location, mainly considering helical and
multi-slice cone-beam scanning. Dosimetry in CT is commonly made obtaining CTDI100 values,
measured with a CT chamber inside a cylindrical phantom, in center and in periphery holes, in a single rotation and no table movement. This way, we can determine(1) the weighted CTDI
(CTDIW), the volumetric CTDI (CTDIvol), and the air kerma-length product (PKL), related by:
(1)
Where L is the scan length and the pitch factor is b/nT, with b = table increment and nT = total nominal width along the rotation axis.
Nevertheless, recent works have indicated that, in helical and multi-slice tomography with high number of rows, measured values of CTDI100 underestimate accumulated dose at
cen-ter, as they do not include contributions of the dose profile "tail", caused by scattering in the phantom (or tissue). (6,7)
This study aimed to contribute to review the assessment of Dose in CT in Brazil and wherever needed, inspired on IAEA and AAPM recommendations(1,5).
2. MATERIALS AND METHODS
A. Improving the Calibration method: Setting a Farmer ion chamber as reference to cali-brate CT chambers
Initially, CT standard beams (RQT)(1) were characterized at the IEE-USP Non-Destructive
Testing Laboratory (LABEND), using a calibrated 0.6cm3 PTW Farmer chamber as reference.
This chamber was used as the reference instead of a pencil chamber, as it is similar to the small CT chamber that would be applied in field measurements, according to AAPM recommenda-tions. Then, we have calibrated two CT “pencil” chambers in PKL by the substitution method,
with and without any collimator in front of the chamber to be calibrated(1,4). In addition, we
cali-brated a Radcal CT 0.6cm3 ion chamber in air kerma against the Farmer one.
Additionally, in other set of measurements, the homogeneity of a PTW pencil chamber re-sponse was checked as described below.
A.1. CT standard beams characterization
Calibration measurements were made in the IEE/LABEND, using a constant potential Philips industrial X-ray equipment with an optical bench, a PTW monitor chamber and Pb colli-mators. The reference dosimeter was a 0.6cm3 Farmer type PTW chamber (no buildup cap) and a
PTW UNIDOS electrometer, both calibrated at the Radioprotection and Dosimetry Institute of the National Commission of Nuclear Energy (IRD/CNEN).
From previously characterized standard RQR beams with the reference Farmer chamber, CT specific beams (RQT 8, 9 and 10) were characterized, by adding suitable copper filtration (1,4).
A.2. Calibration of the CT chambers
As a sequence, the calibration of two CT pencil type ion chambers (PTW and Radcal), connected to their electrometers, has been performed against the reference chamber in RQT beams, by the substitution method.
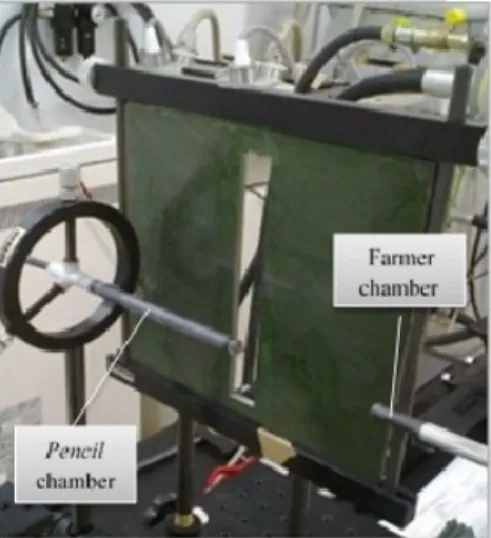
Each CT chamber were kept distant 0.97m from the tube focal spot. Calibration was car-ried out in Air kerma-length product (PKL) in two ways: (A) without any collimator, thus
irradiat-ing the whole chamber length, or (B) irradiatirradiat-ing only its central portion, settirradiat-ing a reference Pb collimator(1) of aperture 2cm (B.2) or 5cm (B.5) which remained 0.90m from the tube focus, in
front of the chamber to be calibrated (Fig. 1). In each case, the aperture would represent, in lab, a scanning length used in a clinical CT procedure.
In both methods, values of tube current, exposure time and Practical Peak Voltages (PPV)(8,9) have been set identical for each beam, and the readings have been corrected for
stand-ard air density and for relative position of the collimator. In each condition, PKL values and the
calibration coefficients of each CT chamber were determined as
(2).
In the above expression, PKL-ref and PKL-user are the air kerma-length product determined,
respec-tively, with the Farmer reference chamber,and with the chamber in calibration.
Finally, a 0.6cc ion chamber from Radcal Co. has been calibrated against the reference chamber in RQT beams, with no collimator, in terms of air kerma.
Additionally, the response homogeneity of one “pencil” chamber was checked. Thus, we shifted the chamber perpendicularly to the beam, behind the collimator, in steps of 1cm, and cal-ibration procedure was repeated in each position with B.2 setup, for all RQT beams.
B. Improving the Dosimetry of clinical CT scanners B.1. Dose profiles
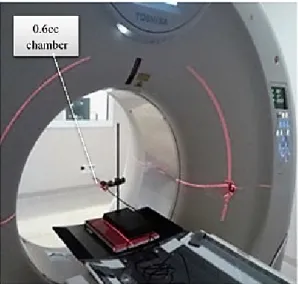
In another step, the calibrated Radcal 0.6cc chamber was initially set aligned in air on z-axis of a Toshiba Aquilion One scanner, from a private Brazilian hospital, to measure dose profiles (Fig. 2). For this, an axial beam with nominal slice thickness nT was used, in which measure-ments were taken with table incremeasure-ments of 1mm, in adjacent axial slices, so that the chamber covered a length L(mm), from -L/2 to L/2, large enough to include the scattering tail(7). Three
different nT values were used: (a) 64x0.5mm, (b) 80x0.5mm and (c) 4x8mm. All measurements were made using 120kV, 400mA and 0.5sec rotation time.
Figure 2 – Setup used to measure dose profiles, using a calibrated 0.6cc CT chamber, in z-axis of a Toshiba CT Scanner.
B.2. Free-in-air Dose Measurements
With the same setup and detector, values of Equilibrium dose-pitch product free-in-air (p.Deq,air) and Equilibrium Dose free in air, Deq,ar(5,10), have been obtained, from the cumulative
dose measured in air, but with continuous table movement, in helical acquisition from -L/2 to L/2, for various routine protocols, all with fixed 100mA:
1) Skull: nT=32x0.5=16mm, 120kV, 0.75s rotation, 75mAs, FOV 220.2(S), Pitch: 1.406; 0.906; 0.844; 0.656, L=72mm;
2) Chest: nT=80x0.5=40mm, 120kV, 0.5s rotation, 50mAs, FOV 400(L), Pitch: 1.388; 1.100; 0.813; 0.637, L=91mm;
3) Child abdomen: nT=64x0.5=32mm, 100kV, 0.5s rotation, 50mAs, FOV 320(M), Pitch: 1.484; 0.906; 0.828; 0.641, L=80mm.
The scan length L, for each protocol, was defined by Eq. (3)(5):
(3),
Where : Charge-collection length (mm) of the ionization chamber (in this case, 21mm).
In the third step, using the Radcal 0.6cc chamber and a large CT phantom (Fig. 3), values of Central Cumulative Dose, DL(0), were measured for L=50mm to 450mm-nT, for two different
abdomen protocols:
(a) nT=64x0.5=32; pitch 0.828; large focal spot; large bow tie filter; 400mA; 0.5s rota-tion time; 120kV.
(b) The same, but with nT=80x0.5=40 and pitch 0.813.
Figure 3 – Setup for the CT clinical measurements using the 0.6cc chamber (central position) and a 450mm phantom (3 joined CT phantoms, 150mm each).
With these values, a curve of DL(0) vs. L was plotted and a best fit to the measured data
was obtained applying Eq.4(5):
(4)
Where h(L) is the approach to equilibrium function and α parameter relates to the scatter-to-primary ratio (SPR) along phantom axis.
This was performed in order to evaluate the Equilibrium cumulative dose (Deq), i.e., the
saturation value of DL(z=0) curve, and the Equilibrium scanning length (Leq), that is, the
mini-mum scanning length Lneeded to obtain Deq. Equilibrium dose was determined for the central
(c) and peripheral axes (Ph, with chamber in 12 o’clock position).
Finally, values of the Planar average equilibrium dose (Deq,p) were calculated (assuming
Deq proportional to r2) from Eq.(5), to be compared to the CTDIvol values informed by the CT
scanner during examinations (5, 10).
3. RESULTS AND DISCUSSIONS
A. Calibration of CT chambers against a Farmer one in CT standard beams A.1. CT standard beams characterization
RQT beams have been characterized for PPV values(8,9) invasively determined with deviations
≤ 0.10kV, and for 1st. HVL values obtained with differences ≤ 0.04mmAl from standard reference
values(1), as appearing in 2nd and 3rd columns of Table 1 below.
A.2. CT chamber calibrations
Table 1 summarizes, for example, the results obtained for the calibration coefficients of the 100mm PTW CT chamber, together with beam characterization parameters. Results for the Rad-cal pencil chamber were similar. Results showed differences up to 2% in the obtained coeffi-cients, for all the analyzed HVL values (6.94 to 10.13mmAl), depending on the collimator aper-ture. When using collimator, the obtained coefficients are systematically lower, but differences remain inside uncertainties range. Finally, last right column shows the calibration data, in air kerma, obtained for the 0.6cc Radcal chamber, for the same standard beams, with no collimator.
Table 1 – Parameters obtained in a 100mm CT chamber calibration in PKL against the Farmer
reference chamber, for RQT beams (1), with and without collimation (methods B and A). The last
right column shows calibration data, in air kerma, obtained for the 0.6cc Radcal chamber for the same beams, with no collimator.
Standard Beam PPV (kV) HVL (mmAl) NPKL-user (A) NPKL-user-100 (B.2) (L=2 cm) NPKL-user-100 (B.5) (L=5 cm) Nk-user-0.6 (no collimator) RQT 8 100.07 6.90 1.003(27) 0.983(20) 0.982(17) 0.974(34) RQT 9 120.03 8.40 1.023(26) 1.001(19) 1.004(16) 0.985(34) RQT 10 149.80 10.10 1.008(27) 0.987(19) 0.992(17) 0.986(34)
In the homogeneity tests, results show that the response of both “pencil” chambers changed slowly (~3% in 3.0cm), along the lateral positions behind the 2cm aperture collimator, for all RQT standard beam, but homogeneity was just verified until ~3.5cm from chamber cen-ter, considering uncertainties.
B. Dosimetry of a clinical CT scanner
B.1. Determination of Dose profiles (in air):
Fig.4 shows dose profiles obtained for the axial protocol applied with the Toshiba scanner, for different nominal slice thicknesses nT. Experimental beam widths have been obtained as the profile FWHM, determined as accurately as possible.
The obtained values were: (a) 37.8(25) mm, 18% higher than the nominal width nT; (b) 47.2(25) mm, 18% higher than nT and (c) 34.3(25) mm, 7% higher than nT.
Figure 4 – Dose profile measured with the CT 0.6cc Radcal chamber, for axial protocols in a Toshiba Scanner, with nT= (a) 64x0.5=32mm; (b) 80x0.5=40mm and (c) 4x8=32mm. Blue traces
are to determine FWHM.
Therefore, in this survey of dose profiles, slice thicknesses were 7 to 18% higher than the nominal values, due to scattering in the phantom.
B.2. Evaluation of Equilibrium Doses free in air
From the cumulative dose measured in air, values of p.Deq,air and Deq,air were determined(5).
Table 2 shows that Deq,air values increase as the pitch is reduced, while p.Deq,air values remain
Table 2 – Values of Deq,ar and pDeq,ar , normalized by mAs, obtained in three analyzed
proto-cols, for four pitch modes of equipment operation: detail (dt), standard (std), other (ot) and fast (ft).
B.3. Assessment of the dose delivered in CT procedures (in phantom).
Fig. 5 shows an example of DL(0) vs. L graph, with a best fit of the approximation
func-tion to equilibrium h(L) (Eq. 4) to the measured central and peripheral values of DL(0). From
these curves, values of Deq and Leq have been determined for each chamber position in the
phan-tom and analyzed protocol.
Skull Chest Child Abdomen
Pitch Deq,ar (mGy/mAs) pDeq,ar (mGy/mAs) Pitch Deq,ar (mGy/mAs) pDeq,ar (mGy/mAs) Pitch Deq,ar (mGy/mAs) pDeq,ar (mGy/mAs) dt 151.82(8) 98.13(6) dt 89.95(6) 56.46(4) dt 74.03(11) 46.22(7) 0.656 0.637 0.641 std 118.11(5) 98.21(5) std 75.75(6) 56.68(5) std 57.31(5) 46.22(11) 0.844 0.813 0.828 ot 110.13(5) 98.31(5) ot 52.55(4) 56.96(4) ot 52.37(5) 46.21(5) 0.906 1.100 0.906 ft 70.96(7) 98.30(9) ft 41.67(18) 56.99(24) ft 32.10(5) 46.40(7) 1.406 1.388 1.484
Figure 5 – Approach to equilibrium of Cumulative Dose DL(0) in central and peripheral axis,
for a beam with 40mm (80x0.5) thickness, in (b) helical protocol (see B.3). Red lines are the ap-proximation function to equilibrium.
Curves of approach to equilibrium have been obtained for the 80x0.5 and for the 64x0.5 pro-tocols. Table 3 shows collected data at central (c) axis in the phantom, and at peripheral axis, discriminating mean (me), maximum (mx) and minimum (mn) obtained values. These variations occur because, in periphery measurements, tube rotation can start in different positions, influenc-ing the collected data.
From Deq (central and peripheral medium, maximum and minimum), values of Planar
Aver-age Equilibrium Dose (Deq,p) were calculated(5). Table 3 shows that, as expected, Deq,p exceeds
CTDIvol, differences ranging between 30-37%.
CTDIvol values have been obtained from the panel of the CT equipment, which has been
Table 3 – Approach to equilibrium function data collected from the curves, for both measured protocols, 80x0.5 and 64x0.5, including the values for DL, α, Leq and R². Columns at right show
the calculated values of Planar Average Equilibrium Dose, Deq,p (Eq.5), and their difference
(%) to the CTDIVOL given by equipment.
Protocols DL (mGy) α Leq (mm) R² Parameters to Calculate Deq,p Deq,p (mGy) CTDIVOL (Equipment) (mGy) Δ (%) 80x0.5 (c) 25.87 (7) 1.01 (1) 497 (80) 1.00 - 80x0.5 (me) 36.72 (30) 0.64 (8) 354 (45) 0.99 80x0.5 (c-me) 31.30 (27) 23.4 34% 80x0.5 (mx) 38.05 (22) 0.46 (2) 478 (37) 1.00 80x0.5 (c-mx) 31.96 (21) 23.4 37% 80x0.5 (mn) 35.69 (42) 0.75 (16) 318 (59) 0.97 80x0.5 (c-mn) 30.78 (37) 23.4 32% 64x0.5 (c) 28.27 (7) 1.00 (1) 497 (50) 1.00 - 64x0.5 (me) 39.59 (44) 0.48 (5) 378 (60) 0.98 64x0.5 (c-me) 33.93 (38) 25.5 33% 64x0.5 (mx) 41.22 (44) 0.41 (2) 506 (63) 0.99 64x0.5 (c-mx) 34.74 (38) 25.5 36% 64x0.5 (mn) 37.85 (56) 0.99 (35) 211 (55) 0.95 64x0.5 (c-mn) 33.06 (50) 25.5 30%
4. CONCLUSIONS
It is possible to conclude, first, that the collimation of the CT pencil chamber under test has some influence on the calibration result, which is in agreement with the recommendations of IAEA(1) and Hourdakis et al.(11), based on measurements made in "good geometry".
The growing number of CT exams in Brazil requires, indeed, the calibration of the CT cham-bers utilized for dosimetry and quality control tests in reference beams such as those utilized in the clinical practice. This work reinforces this necessity and indicates the possibility of use small chambers as references to other small ones as well as to CT “pencil” chambers.
The use of a Farmer-like chamber in CT for dose measurements is a more suitable alternative for helical scans and wide beam width scanners (like multislice units with many rows), allowing,
for example, the survey of dose profiles. In the present work, slice thicknesses were evaluated from the profiles and their values were 7 to 18% higher than the nominal values.
Moreover, CTDIvol values, as informed by the CT equipment, were lower than Planar
aver-age equilibrium doses (Deq,p) values, determined in agreement with AAPM TG111(5) report,
dif-ferences ranging between 30-37% (for nT=40mm and 32mm). Results were similar in ac-ceptance tests made with another Toshiba CT scanner in the same hospital. These results are also in agreement with the findings of Descamps et al.(10), obtained using a Siemens CT scanner,
and of Dixon and Ballard(7), who used two GE scanners.
Differences between values of CTDIvol and Deq,p are also consistent with results of Monte
Carlo simulations made by Boone(12) showing that CTDI
vol systematically underestimates dose
and thus seems to be no longer suitable for determining the absorbed dose during a CT examina-tion, as stands AAPM TG111 report(5).
Other groups have been trying to investigate ways of still avail the dose index values report-ed by the scanners to evaluate the new dose quantities(13). Besides, teams like Platten et al.(14),
from IPEM (UK), are appraising some alternatives to replace the usual CTDIvol, as reported
(with no AEC), by AAPM methodology or even by a simpler upgrade in the original method. As originally proposed, CTDIvol is still a useful index to track across patients, protocols and
scanners for quality assurance purposes, but indeed, it is clearly not the value of patient dose(5,10).
An additional warning is that not all radiologists are realizing this fact, just because the lack of adequate education in radiation physics. As comments Dr. Carvalho, A.C.P.(15), based on large
teaching experience, “sometimes unnecessary imaging studies are frequently requested because the assisting physician does not have in mind that the radiation dose delivered by a chest CT scan corresponds to the dose delivered by approximately 200 to 500 chest radiographies, not to men-tion the much higher cost of computed tomography.”
After all, we tend to agree with him, when he conclude that, “it is necessary to rethink the curricular reforms, the modern pedagogy, distance teaching and learning, the internet, the tablets, and seriously thinking of resuming the education of physicians enabling them to care for human beings.”(15)
5. AKNOWLEDGEMENT
We wish to acknowledge to LABEND of IEE-USP and to Hospital Israelita Albert Einstein de São Paulo by the use of their facilities, and also to the Brazilian agencies FAPESP and CNPq by the partial financial support.
REFERENCES
1 IAEA - International Atomic Energy Agency. Dosimetry in Radiology: An International
Code of Practice. Technical Reports Series n° 457. Vienna: IAEA, 2007.
2 SMITH-BINDMAN R. et al.. Radiation dose associated with common computed tomography
examinations and the associated lifetime attributable risk of cancer. Arch. Intern. Med., v.169(22), p. 2078-2086, 2009.
3 UNSCEAR - United Nations Scientific Committee on the Effects of Atomic Radiation.
Sources and Effects of Ionizing Radiation. UNSCEAR 2008 Report, vol. I, Annex A: Medi-cal Radiation Exposures, NY: UNSCEAR, 2010.
4 MERIMAA HK, TAPIOVAARA M, KOSUNEN A, TOROI P. Calibration and features of air
kerma-length product meters. Rad. Prot. Dos., v. 152(4), p. 384-392, 2012.
5 AAPM - American Association of Physics in Medicine. Comprehensive methodology for the
evaluation of radiation dose in X-ray computed tomography. AAPM report no. 111, Task
Group 111. College Park, MD: AAPM, 2010.
6 BOONE J M. The trouble with CTDI100. Med. Phys., v. 34, p. 1364–1371, 2007.
7 DIXON R L. and BALLARD, A. C.. Experimental validation of a versatile system of CT
do-simetry using a conventional ion chamber: Beyond CTDI100. Med. Phys., v. 34, p. 3399– 3413, 2007.
8 KRAMER HM, SELBACH HJ, ILES WJ. The Practical Peak Voltage of Diagnostic X-Ray
9 TERINI RA, POTIENS, MPA, HERDADE, SB, PEREIRA, MAG, PIRES, JSJ, VIDEIRA,
HS. Measurement of the quantity Practical Peak Voltage in the radiology practice. Radiologia Brasileira, v. 42, p. 389-394, 2009.
10 DESCAMPS C, GONZALEZ M. Measurements of the dose delivered during CT exams
using AAPM Task Group Report No. 111, Journal of Applied Clinical Medical Physics, vol. 13, N. 6, 2012.
11 HOURDAKIS CJ, BOZIARI A, KOUMBOULI E, Calibration of pencil type ionization
chambers at various irradiation lengths and beam qualities. Proceedings IAEA IDOS 2010, vol.2, 21-33, IAEA STI/PUB/1514, 2010.
12 BOONE JM, Dose spread functions in computed tomography: A Monte Carlo study. Med.
Phys., v. 36, p. 4547–4554, 2009.
13 LI X, ZHANG D, LIU B, Calculations of two new dose metrics proposed by AAPM Task
Group 111 using the measurements with standard CT dosimetry phantoms. Med. Phys., v. 40, 081914, 2013. Available at http://dx.doi.org/10.1118/1.4813899 .
14 PLATTEN DJ et al. Radiation dosimetry for wide-beam CT scanners: recommendations of a
working party of the Institute of Physics and Engineering in Medicine, Br. J. Radiol., 86:20130089, 2013.
15 CARVALHO ACP. Medical knowledge of ionizing radiations, Radiol Bras. v. Mar/Abr.