Análise dos Falsos AVCs admitidos na Unidade de
AVC do Hospital de Santa Maria entre 2007 e
2013
Discente: Mariana Alves Vargas
Orientadora: Professora Doutora Ana Catarina Gaspar Fonseca Ano lectivo: 2015/2016
Index
Abstract ... 2 Resumo: ... 3 Introduction ... 4 Hypothesis ... 10 Objectives ... 10 Methods: ... 11 Results: ... 16 Patient demographics: ...17 SM Etiologies ...18Provisional diagnosis in the emergency department ...22
Thrombolysis: ...29
Degree of expertise: ...30
Secondary goals: ...31
Discussion: ... 32
Abstract
Background: The diagnosis of stroke is first done in the emergency department. In 2010, changes were made in the neurology emergency rota that resulted in a decrease in the number of emergency hours done by neurology specialists.
We aim to analyze repercussions of such changes on the number or pattern of admitted stroke mimics (SM).
Methods: Observational retrospective study from January 2007 to December 2013. We used a segmented linear regression – ARIMA to evaluate changes in the temporal pattern of admitted stroke mimics. Time of intervention was set between July 2010-August 2010. A statistical correlation between the number of emergency hours done by neurology residents and the number of admitted stroke mimics was calculated using the Pearson Correlation Coefficient.
Results: Of the 2552 patients admitted to the stroke unit, 290 were SM (11.4%). After July-August 2010 there was an increase in the number of SM admitted (p=0.003) The most common provisional diagnosis in the emergency department was vertebro-basilar stroke (n=137).
After 2010 the most frequent stroke mimic diagnosis changed from psychiatric conditions to peripheral vertigo .
A correlation was found between the number of hours done primarily by neurology residents and the number of stroke mimics admitted (Pearson correlation coefficient=0.94; p=0.002).
Conclusion: Changes in neurology emergency shift schedules were associated to an increase in the rate of admitted stroke mimics and to a higher number of mimics with a final diagnosis of peripheral vertigo.
Resumo:
Introdução :O diagnóstico de Acidente Vascular Cerebral é realizado no serviço de urgência. Em 2010, ocorreram alterações nas escalas de urgência de neurolgia que resultaram num menor número de horas realizadas por especialistas em neurologia. Pretendemos com este estudo analisar se estas alterações se associaram a modificações no número e padrão de falsos AVCs internados
Metodologia: Estudo observacional, retrospetivo de 2007 a 2013. A variação do número de internamentos ao longo do tempo foi analisada através da regressão segmentar - ARIMA - sendo a altura da intervenção entre Julho e Dezembro de 2010. O coeficiente de Correlação de Pearson foi utilizado para avaliar a associação entre o número de horas realizadas por internos e o número de falsos AVCs
Resultados: Dos 2552 pacientes admitidos na Unidade de AVC, 290 foram Falsos AVCs(11.4%). Após Julho-Agosto 2010 verificou-se um aumento no número de falsos AVCs internados (p=0.03) O diagnóstico provisório mais comum no serviço de urgência foi AVC vertebro-basilar (n=137).
Após 2010 o diagnóstico mais comum passou de Condições Psiquiátricas a S.Vertiginoso Periférico
Foi encontrada uma correlação entre o número de horas realizadas primariamente por internos de neurologia e o número de falsos AVCs internados (Coeficiente de Correlação de Pearson=0.94; p=0.002).
Conclusão: A alteração na organização do serviço de urgência conduziu a um maior número de internamentos por falsos AVC e a maior número de pacientes internados com síndromes vertiginosos periféricos.
Introduction
Stroke is the leading cause of mortality and morbidity in Portugal 1, the second most
common cause of death 2 and the third most common cause of disability-adjusted
life-years (DALYs) lost woldwide2
In 2013, there were 5 million deaths from stroke (51% died from ischemic stroke (IS)), 113 million DALYs lost due to stroke (58% due to IS) and 10.3 million new strokes (67% IS).3Furthermore, stroke is the second most frequent cause of dementia, the most
frequent cause of epilepsy in the elderly4 and a frequent cause of depression5.
In order to improve stroke prognosis, prompt diagnosis and accurate therapeutic strategies are of utmost importance. In the acute phase, the only interventions with proven clinical efficacy are the admission to a stroke unit6 and fibrinolysis within 4.5h
of symptoms onset7.
Stroke units are defined as an organized in-hospital facility that is exclusively or nearly exclusively devoted to care for patients with stroke, staffed by a multidisciplinary team with specialization in stroke care.6
The core disciplines of the team include medicine, nursing, physiotherapy, occupational therapy, speech and language therapy and social work .
The typical components of stroke unit care associated with efficacy in clinical trials, as described by the european stroke organization, include:5
(1)Adequate medical assessment and evaluation of nursing and therapeutic needs (2)Acess to adequate imaging, including brain-CT scan and MRI
(3) Early management strategies including, early mobilization, avoidance of urinary catherization prevention and treatment of hypoxia, hyperglycaemia, dehydration, infections and pyrexia.
(4)Ongoing rehabilitation, involving a coordinated multidisciplinary team with early assessment of needs after discharge.
The admission of stroke patients to stroke units is associated with a decrease in mortality (absolute reduction 3%), dependency (a 5% increase of independent survivors), need of institutionalized care (reduction in 2%), and better long term
Commented [M1]: In Portugal ,in ACIN2 study done in the
North Region (2009-2010) the incidence of stroke per 1000 habitants is 2,5 (IC 95%, 2,2 a 2,9) for rural populations and 1,8 (IC 95%, 1,7 a 1,9) for urban populations. The lethality observed for both sub-groups was 16,0% e 10,2%.
Commented [M2]:
Commented [M3]:
The typical components of stroke unit care associated with efficacy in clinical trials, as described by the european stroke organization, include:5
Medical assessment and diagnosis, including imaging (CT, magnetic resonance imaging [MRI]), and early assessment of nursing and therapeutic needs
early management, consisting of early mobilization, prevention and treatment of complications, and treatment of hypoxia, hyperglycaemia, pyrexia and dehydration • ongoing rehabilitation, involving coordinated multidisciplinary team care, and early assessment of needs after discharge.
Commented [M4]: Não sei se deva incluir este parágrafo
outcomes, than admission to other general medical wards 8. All patients appear to
benefit from treatment in stroke units irrespective of their gender, age, sub-type of stroke or stroke severity, 8.
In the acute phase, the admission of stroke patients to stroke units is cost-effective, as it reduces the cost of post-acute in-patient care and is associated with better long term outcomes, despite having an increase of 16% in cost compared to general neurology wards, due to higher resource use of personnel and diagnostic procedures9 ,
However stroke units are a finite space and therefore accessible to a limited number of patients1.
Nonetheless up to 31% of 10111213141516 patients admitted with a diagnostic hypothesis
of stroke in the emergency department turn out to have other diagnostics. These conditions that have a clinical presentation similar to stroke, but turn out to be of non-vascular etiology are designated as Stroke mimics (SM),. Examples of SMs include epilepsy, migraine with aura, multiple sclerosis, peripheral vertigo, and somatoform disorder, amongst others.
There is not a uniform definition of Stroke Mimics across the literature. Some studies define SM as conditions diagnosed as stroke but that do not have ischemic changes in MRI. Others consider that there should be a definite alterative diagnosis, while others include in the definition of stroke mimics other vascular etiologies such as subarachnoid hemorrhage and cerebral venous thrombosis.
Table 1: Review of literature of studies regarding stroke mimics
Time of assignment of initial Evaluators Studies performed Patients included
Frequent mimics Factors associated with SM
Commented [M5]: Twenty-one trials (3994 participants) compared stroke unit care with care provided in general wards. Stroke unit care showed reductions in the odds of death recorded at final (median one year) follow-up (odds ratio (OR) 0.81, 95% Confidence Interval (CI) 0.69 to 0.94; P = 0.005), the odds of death or institutionalised care (OR 0.78, 95% CI 0.68 to 0.89; P = 0.0003) and the odds of death or dependency (OR 0.79, 95% CI 0.68 to 0.90; P = 0.0007).
stroke diagnosis Stroke mimic rate % Norris (1982) Before admission to stroke unit Neurology residents emergency physician, neurologists History, physical 821 108 (13%) Epilepsy, toxic metabolic disorders, syncope. Vroomen (2008) Before admission to stroke unit Neurologists History, physical, laboratory, CT-Scan 669 4.8% migraine with prolonged aura, conversion disorder, epilepsy, metabolic disorder Ay (1999) Patients with stroke-like neurologic deficits normal brain DWI Neurologists History, physical, MRI, MR-DWI 27 3.7% Seizures, Migraine, Transient global amnesia Hemmen (2008) Emergency department Stroke team, composed of emergency physicians and staff neurologists CT-Scan, laboratory 411 104 (25.3%) Intracranial haemorrage was included in the definition of SM. Most common SM
were old deficit made
apparent by medical illness, hypotension, seizure, intoxication, hypoglycemia, mass lesion Kothari (1995) Emergency department Emergency Physicians 75% Neurologists 25% History, physical, laboratory, CT-Scan 4.6% paresthesia or numbness of unknown causes, seizure, complicated
migraine , peripheral neuropathy , cranial nerve neuropathy, psychogenic paralysis Tobin (2009) Emergency department Emergency physician History, physical, laboratory 206 22% seizures, encephalopathy,
syncope and migraine
Kuruvilla (2011) Young patients aged 16-50 years admitted to the emergency department Neurologists History, physical, laboratory, CT-Scan 14% Peripheral vertigo, alcohol intoxication, migraine headache Patients age ,35 years (p=0.05)and patients with posterior circulation stroke (p=0.006) were more likely to be misdiagnosed Merino (2013) Emergency department Emergency physicians History, physical, laboratory, CT-Scan 8,187 30% lack of history of hypertension, atrial fibrillation, or hyperlipidemia Hand 2015 Emergency department Emergency physicians History, physical 336 31%
Mimics: cognitive impairment and
abnormal signs in other systems .
stroke: exact time of onset, definite focal
symptoms, abnormal vascular findings,
presence of neurological signs, being able
The “overdiagnosis” of stroke (diagnosing SM as stroke) has significant clinical, economic, psychological and social consequences.
Irrespective of the etiology, the management of stroke mimics in a stroke unit is not cost-effective 17. It implies increased length of hospital stay, excessive usage of
complementary means of diagnosis and the use of unnecessary medication with risk of adverse effects.17
In addition the misdiagnosis of Stroke bears an important psychological burden for the patient and relatives, who go through stages of grief and anxiety, as the diagnosis of Stroke may be perceived as a “sentence” of disability.
It is therefore important to make the accurate diagnosis of stroke in the emergency department distinguishing it from stroke mimics.
Despite advances in imaging, the differential diagnosis between SM and stroke is essentially clinical. Brain computerized tomography scan has a low sensitivity for the diagnosis of stroke in the acute phase. Brain MRI has higher sensitivity in the acute phase, but is often unavailable. It is more expensive and may be associated with false negatives, particularly in infarcts of small dimensions and of the posterior fossa regions. The differential diagnosis between stroke and a stroke mimic depends on several factors namely the degree of clinical expertise 13 14 epidemiological factors, presenting
complaints, time of onset and pattern of neurological deficits, vascular distribution of symptoms and which laboratory and imaging exams are available when the assessment is made 1518
In Hospital de Santa Maria, admissions to the stroke unit are determined by the neurology emergency team, composed of neurology residents and consultants. In 2010, several experienced clinicians stopped doing emergencies and as a result less emergency hours were done by neurology consultants. No other changes occurred in the structure or policies of the emergency department, providing a natural quasi-experiment to evaluate how changes in the structure of the emergency department
influences the diagnostic accuracy of stroke of a similar population of patients with the same information available.
To the best of our knowledge, there are no other studies in literature analyzing the repercussion of changes in the neurology emergency rota on the admission of stroke mimics to a stroke ward.
Hypothesis
Changes in the neurology emergency rota altered the number and pattern of admitted stroke mimics
Objectives
Analyze the evolution and characteristics of the stroke mimics admitted to the stroke unit between 2007 and 2013.
Asses whether there were statistical significant differences between the number and type of stroke mimics admitted before or after 2010.
Secondary goals
Analysis of length of hospital stay and post-admission complications of stroke mimics. Verify whether there were differences in the number of patients submitted to thrombolysis.
Methods:
Study Design: Observational, retrospective
Data was collected from a prospective database that includes all patients admitted to the Stroke Unit of the Neurology Department of Hospital de Santa Maria in Lisbon between January 2007 and December 2013. Patients with the diagnosis of stroke mimic were retrieved from the database.
Whenever additional information was needed it was obtained using either discharge notes from the Stroke Unit or the electronic medical record system of the emergency department.
Intervention:
Between July 2010 and December 2010 several older and experienced clinicians stopped doing emergencies, as a result shifts started to be more frequently done primarily by neurology residents and less emergency hours were done by neurology consultants.
No other changes in the functioning of the emergency department or in patient evaluation occurred.
Because of these changes, for statistical analysis, the time variables were dichotomized in two different time periods, before 2010 and after 2010.
Setting
Hospital de Santa Maria is an an university hospital. The emergency department covers a population of 800 000, and approximately 600 patients are seen daily.
On arrival, patients with sudden neurological symptoms that are within the time window for intravenous alteplase (iv rtPA) are first seen by a neurologist or neurology resident. All other patient after this time window or with a contraindication for iv rtPA are first examined by a rotating emergency physician, either an internal medicine specialist or a general practitioner, which then requests a neurological consultation by the neurology emergency team.
After evaluation by the on-call neurologist patients with a provisional diagnosis of stroke are admitted to the stroke unit, for further evaluation, etiological investigation and treatment.
Thrombolysis is given to patients within the time frame of 4.5h if they meet the criteria and there are no contraindications.
Baseline investigations in the emergency room, included neurological and physical examination, routine blood analysis (blood and coagulation screen, glucose, electrolytes hepatic and renal function parameters), 12-lead electrocardiography and brain CT scan
After stroke department admission patients were also submitted to Carotid/vertebral duplex scans, transcranial Doppler, echocardiography and 24-h Holter monitoring. When required, after admission to the stroke ward patients did brain MRI.
True strokes were defined as clinical syndromes characterized by focal neurological dysfunction of sudden onset, occurring in a cerebrovascular territory distribution with a duration superior to 24hours, with causes other than vascular excluded 41.
For the purpose of our study, cerebral venous thrombosis was considered as a diagnosis of stroke.
Transient ischemic attack was defined as a clinical syndrome characterized by sudden focal neurological symptoms, presumed to be vascular of origin that lasted less than 24h .
Stroke Mimics were defined as conditions with a clinical presentation suggestive of acute focal brain dysfunction, that were diagnosed as other conditions after additional investigation and clinical follow-up and with no changes suggestive of ischemic etiology in the DWI-MRI.
E.g:
-Aura with or without migraine 19;
-Seizures 20;
-Syncope 21;
-Conversion disorder, -Somatization disorder -Generalized anxiety disorder , -Peripheral vertigo ,
Commented [M6]: O triplex scan e o Doppler não são
feitoas À entrada pois não? A menos que o paciente vá ser submetido à fiblinólise
The following variables were collected: (1) population demographics:
a. age, b. sex,
(2) past medical history:
a. vascular risk factors, known at the time of presentation,
i. hypertension, defined as arterial tension 140/90 mmHg measured in several measurements and on different occasions or usage of anti-hypertensive medication
ii. diabetes mellitus: fasting blood glucose 126mg/dl on two different measurements, random glucose levels 200mg/dl with expoliative symptoms , anti-diabetic medication 22
iii. atrial fibrillation,
iv. dyslipidemia- defined as abnormal elevation of plasma cholesterol or triglycerides 23
v. smoking – if the patient had current smoking habits. b. history of previous stroke or previous TIA
c. known conditions at the time of presentation that could mimic stroke: 1. migraine or
2. peripheral causes of vertigo, and
d. if any previous neurological deficit was present
(3) history of the present event:
a. symptoms and presenting complaints: i. changes in the level of consciousness, ii. behavioral changes or changes in humor, iii. headache,
iv. abnormal verbal output, v. dysarthria,
vi. diplopia,
vii. changes in the visual field (both positive and negative symptoms),
ix. side of weakness,
x. changes in motor coordination, xi. involuntary movements, xii. unsteadiness of gait xiii. vertigo.
b. Neurological examination
i. National Institute of Health Stroke Scale (NIHSS) score ii. Presence of gait instability.
(5) Results of anteciliary means of diagnosis,
Whether there was any previous CT scan, if there were any abnormalities in the CT scan done in the emergency department and if the patient was latter submitted to an MRI.
(6) Provisional diagnosis, classified as: a) Anterior Circulation Infarct; b)Lacunar Infarct;
c) Posterior Circulation Infarct; d)Transient Ischemic Attack; e)Intracranial hemorrhage; f)Cerebral venous thrombosis;
g) Reversible cerebral vasoconstriction syndrome ; h) Arterial dissection;
(8)Final Diagnosis, which was broadly classified within 20 categories: a) Migraine
b) Peripheral Vertigo c) Psychiatric Conditions d) Multiple Sclerosis
e) Acute Mononeuropathy/Isolated Neuropathy of Cranial Nerve
f) Brain Tumour
g) Infectious disorders of the SNC h) Systemic disorders
i) Wernicke Syndrome j) Toxic/Metabolic k) Old Deficit l) Epilepsy
m) Ophthalmic Disorders n) Other Headache Disorders o) Syncope
p) TCE
q) Osteo-articular r) Other conditions
Work schedules of the emergency department were analyzed to determine the distribution across the years of emergency hours done primarily by neurology residents.
Statistical analysis:
Statistical analysis was performed using SPSS 21 and Microsoft Excel for Mac 2011 software. The descriptive statistics for all variables were calculated. Qualitative variables are presented as number (percentage). Quantitative variables are presented either as mean ± standart deviation(SD) if they follow a normal distribution or median (interquartile range) if otherwise.
Categorical variables were compared using either Pearson’s qui-Square or Fisher’s exact test. Continuous variables were assessed using the T-student test after assessing for normality with the Kolmogorov-Smirnov test.
Changes in the temporal pattern of the admissions of stroke mimics were calculated by performing a interrupted time series analysis, using a segmented linear regression (ARIMA). Interrupted time series design is the strongest, quasi-experimental approach for evaluating longitudinal effects of interventions. Time of intervention was set between July 2010-December 2010. Time was measured at four months intervals.
Statistical correlation between the number of emergency hours done by neurology residents and the number of stroke mimics was calculated by performing a linear regression after assessing for correlation with the Spearmen coefficient.
In order to perform the Qui-Square test, to asses the variation of the final diagnosis across the years, final diagnosis were grouped in the following categories psychiatric conditions, peripheral vertigo, migraine, multiple sclerosis, acute peripheral neuropathy and other conditions.
.
Statistical significance was set at p=0.05.
Results:
Between January 2007 and December 2013 there were 2552 admissions to the Stroke Unit in Hospital de Santa Maria in Lisbon, from which 290 patients were Stroke Mimics.
Figure 1: Distribution per year of patients admitted to the stroke unit who were stroke mimics. Results are presented as % of total admissions to the stroke unit in that year. Error bar shows 95% confidence interval.
Stroke mimics had the following distribution per year: 36 were admitted in 2007, 33 in 2008, 25 in 2009 32 in 2010, 43 in 2011, 59 in 2012 and 62 in 2013.
After July 2010-October 2010 there was an increase in the number of stroke mimics admited to the stroke unit (ARIMA segmental regression changes in the number of admissions before this period p=0.237; number of admissions before versus after July-December 2010 p=0.003)
Figure 2 Segmented regression comparing the number of stroke mimics admitted to the stroke unit in 4 months intervals from 2007 to 2013. Arrow shows time of intervention - between July 2010-October 2010
Patient demographics:
The youngest patient was 19 and the oldest was 90.
Most stroke mimic patients were female (57.10%), most stroke patients were male (58.20%). p<0.01. 0,0% 5,0% 10,0% 15,0% 20,0% 2007 2008 2009 2010 2011 2012 2013
Stroke Mimics Distribution per Year
n=290
St ro ke M im ic s % TimeRegarding previous medical history, stroke mimics patients had 1 [0-2] vascular risk factors known at the time of presentation.
The most common risk factor was hypertension 128 (44.1%) followed by dyslipidemia 100 (34.00%) .
The least frequent risk factors were atrial fibrillation 7 (2.4%) and ischemic heart disease 16 (5.5%).
56 (19%) patients had a previous history of Stroke and 12 (4.1%) patients had a previous transient ischemic attack.
Table 2 shows a further description of vascular risk factors and previous medical history. Table 2: Patient Demographics Age (mean + SD) 52.6 ±15.32 Female (n, %) 199 41.80% Vascular Risk factors(mean+SD) 1,2 ±1.07 Hypertension 128 44.1% Dyslipidemia 100 34.00% Diabetes 44 15.00% Smoking 66 22.40% Atrial Fibrillation 7 2.40% Ischemic Heart Disease 16 5.5% Other 31 10.58%
Previous Medical History
Previous Stroke 56 19.00%
Previous TIA 11 3.70%
History of Migraine 37 10.79%
History of Vertigo 18 5.25%
Before and after 2010 there were no statistical significant differences between the mean NIHSS (3.06±0.27vs 2.3± 0.18; p=0.59) , age (52.27± vs 52.39± p=0.95), and number of vascular risk factors (p=0.13), previous history of stroke (p=0.17)/TIA (p=0.27)
SM Etiologies
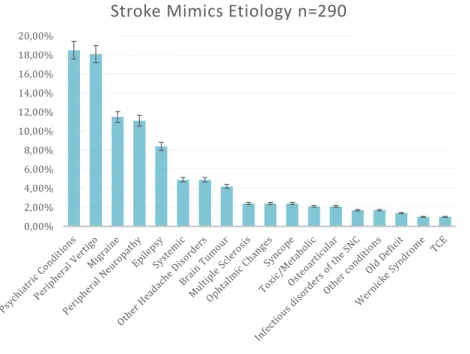
Figure 3 shows the final diagnosis for stroke mimics
Figure 3 Distribution of the final diagnosis for Stroke Mimics
The most common final diagnosis were Psychiatric Conditions in 53 patients (18.50%); Peripheral Vertigo 52 (18.1%) ; Migraine 33 (11.50%) and Acute mononeuropathy or Isolated Neuropathy of a Cranial Nerve 32 (11.10%) ;
Of the psychiatric conditions 25 patients had a conversive disorder, 12 a somatoform disorder, 15 had generalized anxiety disorder and 1 had depression.;
The distribution of stroke mimic diagnosis, varied through the years and is shown in figure 4 0,00% 2,00% 4,00% 6,00% 8,00% 10,00% 12,00% 14,00% 16,00% 18,00% 20,00%
Figure 4 distribution of the final diagnosis for stroke mimics across the years 0,00% 10,00% 20,00% 30,00% 2007 2008 2009 2010 2011 2012 2013
Distribution of Stroke Mimics Etiologies per year n=290
Parkinson Disorder Other conditions Osteoarticular TCE Syncope
Other Headache Disorders Ophtalmic Changes Epilepsy Old Deficit Toxic/Metabolic Wernicke Syndrome Systemic
Infectious disorders of the SNC
Brain Tumour
Neuromuscular Disorders Acute
mononeuropathy/Isolated Neuropathy of Cranial Nerve Multiple Sclerosis Psychiatric Conditions Peripheral Vertigo Migraine
Figure 5 SM etiologies , before and after 2010
After the intervention, the most frequent stroke mimic diagnosis changed from psychiatric conditions to peripheral vertigo p=0.04.
0,00% 5,00% 10,00% 15,00% 20,00% 25,00% 30,00%
<2010 >=201 0
Stroke Mimics Etiology- Before and after
intervention n=290
Other conditions Osteoarticular TCE Syncope
Other Headache Disorders Ophtalmic Changes Epilepsy Old Deficit Toxic/Metabolic Wernicke Syndrome Systemic
Provisional Diagnosis in the Emergency Department
Figure 6 shows the provisional diagnosis in the emergency department for SM. Before admission to the stroke unit 137 (47.20%) patients had a provisional diagnosis of VB-stroke; 53 (18.30%) Anterior Circulation Stroke; 34 ( 11.70%) Lacunar Infarct and 38 (13.11%) of transient ischemic attack. There were no significant changes in the frequency of each provisional diagnosis across the years (p=0.94).
Figure 6 Provisional diagnosis in the emergency department for SM
0,00% 5,00% 10,00% 15,00% 20,00% 25,00% 30,00% 35,00% 40,00% 45,00% 50,00% 55,00%
Provisional Diagnosis in the Emergency Department
n=290
Commented [AF8]: Isto vem no inicio pq é parte dos
There were no statistically significant changes in the most common provisional diagnosis (qui-square test p=0.44) of patients admitted before 2010 and after 2010.
Figure 7 Provisional diagnosis in the emergency department for SM
0,00% 5,00% 10,00% 15,00% 20,00% 25,00% 30,00% 35,00% 40,00% 45,00% 50,00% 55,00% Before 2010 After 2010
Provisional Diagnosis in the ED before and after 2010
n=290
Posterior circulation stroke Lacunary Stroke Anterior Circulation Stroke
Intracranial Haemorrage T.I.A Cerebral Venous Thrombosis
Vasospasm Aneurism dissection
Medulary Infarct
Commented [M9]: Isto é pertinente??
Figure 8 shows the distribution of the provisional diagnosis in the emergency department per stroke mimic etiology
Figure 8 provisional diagnosis in the emergency department per stroke mimic etiology
SM with provisional diagnosis of VB-stroke had peripheral vertigo, psychiatric conditions and acute mono-neuropathies. Lacunar infarcts were mostly psychiatric conditions.
Anterior circulation infarcts were psychiatric conditions, epilepsy and brain tumors. Intracranial hemorrhage was brain tumor, migraine and other headache disorders. TIA were mostly migraine and epilepsy.
0% 50% 100%
VB-Stroke Lacunar-Infarct Anterior Circulation Stroke Intracranial Haemorrage TIA Cerebral Venous Trombosis Dissection
Provisional diagnosis in the emergency department vs
SM etiology
Migraine Peripheral Vertigo Psychiatric Conditions Multiple Sclerosis Acute mononeuropathy/Isolated Neuropathy of Cranial Nerve Brain TumourInfectious disorders of the SNC Systemic Wernicke Syndrome Toxic/Metabolic Old Deficit Epilepsy Ophtalmic Changes Other Headache Disorders Syncope
Before admission to the stroke unit all patients had a brain CT-scan. In 34 patients the CT-Scan showed lesions “de novo” and an ischemic cause could not be ruled out; 40 patients had old CT scans which showed lesions either of vascular etiology or other
During their hospital stay, most patients (282 , 96.42%) were submitted to DWI MRI. In 38 (12.90%) patients brain MRI contributed to the final diagnosis. There was no significant difference in the number of patients submitted to MRI across the years (p=0.21)
Commented [M10]: VERIFICAR!!!
Commented [AF11]: Isto coloca-se no fim pq sao
Presenting Complaints
On arrival to the emergency department, the most common presenting complaints of Stroke Mimic Patients were sensory loss 105 patients (35.70%), headache 103 (35.00%); motor changes 86 (29.30%) and vertigo 63 (21.40%);.
Involuntary movements 14 (4%)and ataxia were rare in SM.
Figure 9 shows presenting complaints of SM when admitted to the emergency department.
Figure 9 Presenting complaints of patients admitted to the Stroke Unit.
0% 20% 40% 60% 80% 100% Ataxia Involuntary movements Behavioural changes Disarthria Aphasia Visual field deficits Gait instability Double Vision Altered level of consciousness Vertigo Motor complaints Headache Sensitive changes
Presenting Complaints n=290
Symptoms:
The mean NIHSS score at entry, was 2±3 the minimum was 0 the maximum was 21. Figure 10 show the variation of NIHSS score per stroke mimic etiology
Figure 10 Box plot showing distribution of NIHSS per stroke mimic etiology
Ninety two (32.41%) patients had a normal neurological examination. Table 3 shows the final diagnosis of patients with a normal neurological exam.
Table 3 : final diagnosis in patients with normal neurological exam n=93 Migraine 23 25.00%
Peripheral Vertigo 14 15.20%
Psychiatric Conditions 8 8.70%
Multiple Sclerosis 3 3.30%
Acute Mononeuropathy/Isolated Neuropathy of Cranial Nerve
4 4.30% Brain Tumour 3 3.30% Systemic 2 2.20% Toxic/Metabolic 2 2.20% Old Deficit 1 1.10% Epilepsy 8 8.70% Ophthalmic Changes 5 5.40%
Other Headache Disorders 8 8.70%
Syncope 5 5.40%
TCE 1 1.10%
Osteoarticular 4 4.30%
Other conditions 1 1,10%
Figure 11 Changes in the neurological examination seen in the emergency department of patients admitted to the stroke unit
.
The most frequent abnormalities in the neurological exam were sensory loss 76 (26%); arm paresis 82(28%), leg paresis 69 (24%), facial paresis 44 (15%), ocular paresis 48(16%) and gait instability 38(13%)
Only 2 (1%) patients had extinction/neglect, 9 (3%) had changes in the level of conscience and 14 (5%) had visual fields deficits
0% 5% 10% 15% 20% 25% 30% 35% 40% 45%
Thrombolysis:
Of the 427 patients submitted to fibrinolysis 11 (2.6%) patients were SM. The mean NIHSS score was 9±3 minimum 0, max. 21.
Of those patients 5 were psychiatric conditions (50 %); 1 (10 %) were brain tumors, 2 (20%) were infectious disorders of the central nervous system, 1 (10 %) were toxic/metabolic disorders and 1 was epilepsy (10 %).
No statistically significant difference was found between the number of patients submitted to fibrinolysis before and after 2010(p=0.67)
Degree of expertise:
Figure 12 shows the percentage of the hours in the emergency department that were done per year by primarily by neurology residents.
Figure 12 Percentage of the hours in the emergency department that were done per year by primarily by neurology residents
There was a statistical significant correlation between the number of hours spent in the E.D by neurology residents and the number of admitted Stroke Mimics, Pearson correlation coefficient=0,94; p=0.002. Figure 11 shows the linear regression.
Figure 13 Linear regression
0% 5% 10% 15% 20% 25% 30% 2007 2008 2009 2010 2011 2012 2013
Percentage of Hours in the emergency
department that were done per year
by primarily by neurology residents
Secondary goals:
The median length of hospital stay was 4 days [2-6] the minimum was 1 day and the maximum was 65 days.
41 patients had complications namely infections 12 (4%), post-lumbar puncture headache 8 (2.7%), psychiatric conditions 7 (2.4%) and metabolic deregulation 4 (1%).
Discussion:
After 2010 a statistically significant increase in the proportion of stroke mimics admitted to the stroke unit and a change in the pattern of admitted stroke mimics was observed.
Among possible contributing factors, one might be the fact that between 2009 and 2010, several experienced clinicians stopped doing emergencies, leading to an increase in the number of emergency hours done primarily by neurology residents.
In fact, there was a statistically significant correlation between the stroke mimic rate and the number of emergency hours done by neurology residents.
Even in this era of technological advancements, clinical judgment, thorough knowledge of cerebrovascular anatomy and familiarity with characteristic stroke syndromes remain indispensable in the evaluation of suspected strokes in the emergency department. Despite advances in imaging, in the acute phase Stroke remains essentially a clinical diagnosis being influenced by clinical expertise.
Most studies in the literature compared the diagnostic accuracy of emergency physicians with that of neurologists. While some studies found statistical significant differences 1427others were not able to reproduce such results2829
Few studies provide data for diagnostic accuracy of stroke across different levels of training.
In 1984 Norris compared the diagnostic accuracy of different physicians using clinical vignettes. Of 50 cases that were stroke mimics, the ER physician was correct in 22% of times, the neurology resident in 36% and the neurology consultant in 76%. A possible limitation of this study is the fact that patients did not have a CT-Scan before the diagnostic decision, however in a later study by the same author there were no statistical significant differences between the proportions of SM misdiagnosis before CT-scan or after CT-scan 40 (16%) vs 45 (13%). In a prospective study (Ferro et al, 1998) a rate of SM of 9% was found. This study included 4 different hospitals and the rate of SM and diagnostic uncertainty was lower in non teaching hospitals. In contrast
(Mohamed et al, 2013) found that the rate of missed strokes was lower in hospitals with neurology residency programs. However, both studies analyzed small samples of stroke mimics.
Differences in diagnostic accuracy could be explained by differences in cognitive processes. One of the earliest phases in the diagnostic process is the formulation of the working hypothesis30.
Experienced clinicians have a more schematic reasoning, generating broader hypothesis and drawing on previous experience to recognize patterns and cues in the neurological examination while leaving room for altering their initial diagnosis. Conversely, less experienced clinicians tend to use linear thinking to arrive quickly at a diagnosis, using as working hypothesis less common conditions or the possibility of common conditions presenting with unusual symptoms, discounting and explaining
away data that disagrees with their initial hypothesis (mild confirmation bias).
A potential concern here is that there may be a trade-off between the rate of stroke mimics and the rate of missed strokes, and that a decrease in the rate of stroke mimics happens at the expense of an increase of missed strokes.
Posterior circulation stroke was found to be the most common provisional diagnosis in the emergency department. This is not surprising as location of stroke influences diagnostic accuracy. Anterior circulation stroke usually presents with clear focal deficits, while posterior circulation strokes tend to present with more amorphous symptoms. Posterior circulation strokes pose a diagnostic difficulty for both neurologists and emergency physicians, especially in younger patients31 and if
symptoms such as vertigo, double vision, ataxia, loss of conscience or paresis of cranial nerves are present in isolation. 1127
In retrospective studies, emergency physicians failed to make the diagnosis of posterior circulation stroke in 35% of cases32, and neurologists had a sensitivity for this clinical
diagnosis between 54.2% and 70.8% with a specificity between 84.4% and 89.9%33.
Higher rates of stroke mimics in patients with symptoms associated with lesions in the VB territory could also be explained by a more cautious approach, as posterior circulation strokes often may be unnoticed and have a propensity for bad outcomes 34. In a retrospective study by (Caplan LR et al, 2009) which followed a cohort of 15
patients over a 5-year period with misdiagnosed cerebellar infarction in the Emergency Department, the overall mortality was 40% and among the survivors nearly 50% had disabling deficits.
There were no changes in the diagnostic categories across the years. Studies show that experts and novices do not differ in the diagnostic categories only in their depth.
Before 2010 the most frequent diagnosis for stoke mimics was psychiatric conditions and after 2010 peripheral vertigo. Other common misdiagnosis were migraine with aura, acute peripheral mono-neuropathy and toxic/metabolic disorders.
Because these are heterogeneous conditions several factors could have contributed to the misdiagnosis. Broadly the main diagnostic difficulties in stroke mimics can be classified within the following groups :
(1) Stroke mimics that could be differentiated from cerebrovascular disorders though a thorough history taking and medical examination. In such cases factors that influence the misdiagnosis are degree of clinical expertise and possibly exhaustion.
(2) First presentation of a condition with sudden onset of symptoms that could mimic stroke such as migraine, epilepsy, multiple sclerosis, amongst others. (3) Conditions with atypical presentations in a patient with vascular risk factors.
E.g Migraine with prolonged aura, hypoglycemia with focalizing signs. (4) Isolated symptoms, such as hemiparesis/hemisensory loss, dysarthria, loss
of conscience in a patient with vascular risk factors.
(5) “de novo” lesions in the CT-Scan, where it is unclear whether their etiology is ischemic or otherwise.
(6) Symptoms suggestive of posterior fossa lesions.
Psychiatric conditions are essentially a diagnosis of exclusion and usually are only
considered when despite a thorough investigation no organic cause was found. In the emergency department, these diagnosis can be suggested by odd affective responses, psychiatric comorbidities, history of similar episodes and fluctuating
changes in the neurological exam however based solely on this changes it is impossible to rule out acute ischemia.
In our study, most patients with psychiatric conditions reported isolated left sided sensory changes, headache and motor changes and had either a normal neurological exam or isolated motor or sensory loss. The most common provisional diagnosis in the emergency department was lacunar infarcts, for which CT-scan available in the ED lacks sensibility. The pattern of admissions to the stroke unit of psychiatric conditions changed across the years possibly because in the presence of such conditions more
experienced clinicians tended towards a more conservative and cautious approach fearing missed strokes.
Peripheral vertigo.
In the USA nearly 2.6 million visits to the emergency department per year are due to complaints of dizziness, vertigo or imbalance, of which 150,000 receive the final diagnosis of peripheral vertigo35. The number of imaging exams used to investigate
such patient has been increasing and so have associated costs36. The costs associated
with dizziness are $4 billion per year (about 4% of total ED costs) and neuroimaging was estimated to account for about 12% of the total costs for dizziness.36
Isolated vertigo is a strong predictor of a non vascular etiology, in a prospective study by (Kerber et al,. 2006) of 1666 patients presenting to emergency department with complaints of vertigo only 3.2 % were diagnosed with TIA or stroke, being imbalance and unsteadiness of gait predictors of ischemic disorders32. In another study (Lee H, et
al; 2006), of 240 patients clinically diagnosed with vestibular neuritis, with isolated vertigo lasting for more than 24h and a normal neurological examination, 10.4% had a cerebellar infarction37 38.
In order to improve diagnostic accuracy in the evaluation of the evaluation of patients presenting with acute vestibular symptoms the HINTS method, a three-step bedside evaluation composed of horizontal head impulse test, nystagmus evaluation in and testing of skew, can be used.
Commented [M14]: Isto são resultados acho eu- o melhor
Normal horizontal head impulse test, direction-changing nystagmus in eccentric gaze, or skew deviation (vertical ocular misalignment) has a 100% sensitivity and 96% specificity for the detection of stroke. 39
Despite the increase in the proportion of stroke mimics across the years, few stroke mimics were submitted to fibrinolysis and no significant changes in the number of SM submitted to fibrinolysis were observed.
This could be explained by several factors namely the fact that stroke mimics often present with minor clinical deficits, Merino et al showed that stroke mimics are five times more likely to present with minor clinical deficits (NIHSS score of 1-4), which is concordant with our finding that the mean NIHSS for SM was 2±3. In addition 92 (32%) patients showed no changes in the neurological examination.
The most common reasons for exclusion from thrombolysis, appointed by Chang et al were:
(1) late arrival to the emergency department, as conditions such as migraine with aura or toxic metabolic disorders may lead to the development of focal deficits but of slower onset.
(2) Conditions that manifest by signs and focal deficits not detected or with low representation in the NIHSS.
(3) Rapid resolution of symptoms, in conditions such as migraine with aura40
Changes in healthcare outcomes are usually multifactorial in nature. Discerning which factors influence the misdiagnosis of stroke is vital to increasing clinical effectiveness and the odds of positive outcomes of stroke patients.
Strong points of our study reside in the analysis of a large sample of patients with stroke mimics, in addition, Hospital de Santa Maria is an urban teaching hospital with a heterogeneous population, therefore results may apply to other populations. Another strong suit was the fact that most were submitted to MRI and no particular changes between the number of patients submitted to MRI occurred.
The existence of a correlation between the increase in the number of hours done primarily by neurology residents and the number of stroke mimics does not imply a
relation of causality and because this is a retrospective single center study, based on chart review with no control group we can not exclude the influence of other changes in the organization of the emergency department extrinsic to neurology department.
Conclusion
Changes in neurology emergency shift schedules were associated with an increase in the rate of admitted stroke mimics and a higher number of stroke mimics with a final diagnosis of peripheral vertigo.
Commented [MAV16]: The main pitfalls are that this is a,
Bibliography
1. Cérebro-cardiovasculares D. Doenças Cérebro-Cardiovasculares em números –
2014.
2. Global, regional, and national incidence, prevalence, and years lived with disability for 301 acute and chronic diseases and injuries in 188 countries, 1990–2013: a systematic analysis for the Global Burden of Disease Study 2013 Lancet. 2015;386(9995):743-800.
3. Feigin VL, Krishnamurthi R V, Parmar P, et al. Update on the Global Burden of Ischemic and Hemorrhagic Stroke in 1990-2013: The GBD 2013 Study Neuroepidemiology. 2015;45(3):161-176.
4. Rothwell PM, Coull AJ, Silver LE, et al. Population-based study of event-rate, incidence, case fatality, and mortality for all acute vascular events in all arterial territories (Oxford Vascular Study) Lancet (London, England).
2005;366(9499):1773-1783..
5. Ntaios G, Dziedzic T, Michel P, et al. European Stroke Organisation (ESO) guidelines for the management of temperature in patients with acute ischemic stroke. Int J Stroke. 2015;10(6):941-949.
6. Unit S, Collaboration T. Organised inpatient (stroke unit) care for stroke. Stroke Unit Trialists’ Collaboration Cochrane Database Syst Rev. 2000;(2):CD000197.
7. Wardlaw JM, Murray V, Berge E, Del Zoppo GJ. Thrombolysis for acute
ischaemic stroke Cochrane database Syst Rev. 2009;(4):CD000213. 8. Organised inpatient (stroke unit) care for stroke Cochrane database Syst Rev.
2013;9:CD000197.
9. Epifanov Y, Dodel R, Haacke C, et al. Costs of acute stroke care on regular neurological wards: a comparison with stroke unit setting Health Policy. 2007;81(2-3):339-349.
10. Hand PJ, Kwan J, Lindley RI, Dennis MS, Wardlaw JM Distinguishing
Between Stroke and Mimic at the Bedside: The Brain Attack Study. Stroke. 2006;37(3):769-775.
11. Vroomen PC a J, Buddingh MK, Luijckx GJ, De Keyser J. The Incidence of Stroke Mimics Among Stroke Department Admissions in Relation to Age Group J Stroke Cerebrovasc Dis. 2008;17(6):418-422.
12. Kothari RU, Brott T, Broderick JP, Hamilton C a. Emergency physicians. Accuracy in the diagnosis of stroke. Stroke 1995;26(12):2238-2241.
13. Ferro JM, Pinto a N, Falcão I, et al. Diagnosis of stroke by the nonneurologist. A validation study. Stroke 1998;29(6):1106-1109.
14. Norris JW, Hachinski VC. MISDIAGNOSIS OF STROKE. Lancet
1982;319(8267):328-331.
15. Nguyen PL, Chang JJ. Stroke Mimics and Acute Stroke Evaluation: Clinical Differentiation and Complications after Intravenous Tissue Plasminogen Activator J Emerg Med. March 2015.
16. Hemmen TM, Meyer BC, McClean TL, Lyden PD. Identification of Nonischemic Stroke Mimics Among 411 Code Strokes at the University of California, San Diego, Stroke Center J Stroke Cerebrovasc Dis. 2008;17(1):23-25.
17. Goyal N, Male S, Al Wafai A, Bellamkonda S, Zand R. Cost Burden of Stroke Mimics and Transient Ischemic Attack after Intravenous Tissue Plasminogen Activator Treatment J Stroke Cerebrovasc Dis. 2015;24(4):828-833. 18. Lioutas V-A, Sonni S, Caplan LR. Diagnosis and misdiagnosis of
cerebrovascular disease. Curr Treat Options Cardiovasc Med. 2013;15(3):276-287.
19. The International Classification of Headache Disorders, 3rd edition (beta version). Cephalalgia. 2013;33(9):629-808.
20. Proposal for revised classification of epilepsies and epileptic syndromes. Commission on Classification and Terminology of the International League Against Epilepsy Epilepsia. 30(4):389-399.
21. Moya A, Sutton R, Ammirati F, et al. Guidelines for the diagnosis and management of syncope (version 2009). Eur Heart J. 2009;30(21):2631-2671. 22. American Diabetes Association. Diagnosis and classification of diabetes
mellitus. Diabetes Care. 2014;37 Suppl 1(Supplement_1):S81-S90. 23. Catapano AL, Reiner Z, De Backer G, et al. ESC/EAS Guidelines for the
management of dyslipidaemias: the Task Force for the management of dyslipidaemias of the European Society of Cardiology (ESC) and the European Atherosclerosis Society (EAS) Atherosclerosis. 2011;217 Suppl :S1-S44. 24. Chalela JA, Kidwell CS, Nentwich LM, et al. Magnetic resonance imaging and
computed tomography in emergency assessment of patients with suspected acute stroke: a prospective comparison Lancet (London, England). 2007;369(9558):293-298.
25. Edlow JA, Newman-Toker DE, Savitz SI. Diagnosis and initial management of cerebellar infarction. Lancet Neurol. 2008;7(10):951-964.
26. Oppenheim C, Stanescu R, Dormont D, et al. False-negative diffusion-weighted MR findings in acute ischemic stroke AJNR Am J Neuroradiol. 2000;21(8):1434-1440.
27. Mohamed W, Bhattacharya P, Chaturvedi S. Early access to a neurologist reduces the rate of missed diagnosis in young strokes J Stroke Cerebrovasc Dis. 2013;22(8):e332-e337.
28. Artto V, Putaala J, Strbian D, et al. Stroke mimics and intravenous thrombolysis Ann Emerg Med. 2012;59(1):27-32.
29. Kothari RU, Brott T, Broderick JP, Hamilton CA. Emergency Physicians : Accuracy in the Diagnosis of Stroke Stroke. 1995;26(12):2238-2241. 30. Sisson JC, Donnelly MB, Hess GE, Woolliscroft JO. The characteristics of
early diagnostic hypotheses generated by physicians (experts) and students (novices) at one medical school Acad Med. 1991;66(10):607-612.
31. Kuruvilla A, Bhattacharya P, Rajamani K, Chaturvedi S. Factors associated with misdiagnosis of acute stroke in young adults J Stroke Cerebrovasc Dis. 2011;20(6):523-527.
32. Kerber KA, Brown DL, Lisabeth LD, Smith MA, Morgenstern LB. Stroke
among patients with dizziness, vertigo, and imbalance in the emergency department: a population-based study Stroke. 2006;37(10):2484-2487. 33. Albright KC, Raman R, Ernstrom K, et al. NIH Public Access. Stroke.
2012;1(1):1106-1109.
34. Chase M, Joyce NR, Carney E, et al. ED patients with vertigo: Can we identify clinical factors associated with acute stroke? Am J Emerg Med.
2012;30(4):587-591.
35. Newman-Toker DE, Hsieh Y-H, Camargo CA, Pelletier AJ, Butchy GT, Edlow
JA. Spectrum of dizziness visits to US emergency departments: cross-sectional analysis from a nationally representative sample Mayo Clin Proc.
2008;83(7):765-775.
36. Saber Tehrani AS, Coughlan D, Hsieh YH, et al. Rising annual costs of dizziness presentations to U.S. emergency departments Acad Emerg Med. 2013;20(7):689-696.
37. Kim JS, Lee H. Vertigo due to posterior circulation stroke Semin Neurol. 2013;33(3):179-184.
38. Lee H, Sohn S-I, Cho Y-W, et al. Cerebellar infarction presenting isolated vertigo: frequency and vascular topographical patterns Neurology. 2006;67(7):1178-1183.
39. Kattah JC, Talkad A V, Wang DZ, Hsieh Y-H, Newman-Toker DE. HINTS to
diagnose stroke in the acute vestibular syndrome: three-step bedside oculomotor examination more sensitive than early MRI diffusion-weighted imaging Stroke. 2009;40(11):3504-3510.
40. Chang J, Teleb M, Yang JP, et al. A model to prevent fibrinolysis in patients with stroke mimics J Stroke Cerebrovasc Dis. 2012;21(8):839-843..
41. World Health Organization. World Health Report 2002. Geneva,
Aknowledgments
“Art is long; life is short; opportunity is fleeting; judgement is difficult; experience is deceitful” Hipocrates
I would like to thank:
My advisor Ana Catarina Gaspar Fonseca for accepting to mentor me in this research project. For all her patience, avaliability , suggestions and insightful discussions. For setting an example as a teacher, as researcher and as clinitian. Marisa Costa for all her support and stroke unit data base
Filipe Nascimento , Sérgio Maltês and Sofia Teixera for their critiques and corrections
My friends and colleagues. My parents who are my rock.
Apendix
Stroke mimic etiology Presenting complaints (frequencies >20%) Neurological examination Imaging Provisional diagnosis in the E.D Duration of Symptoms Psychiatric conditions n=53 Sensitive phenomena, (positive or negative) left sided: 18 (52,9%) right sided 11 (38%) bilateral 4(11,8%) Motor weakness left sided 11 (36,7%), right sided 14 (46,7%), bilateral 5 (16,7%). NIHSS was 3,08±2,99, max 15 Normal 10 Motor Arm 33 Leg 28 Sensory loss 33 Slurred Speech 8 CT Scan 3 (5,70%) MRI negative in all patients Lacunar-Infarct 21(40%), VB-Stroke 15 (29%) Anterior circulation stroke 11 (21%). >24h with remission 24 (79%) No remission of symptoms 6 (11%) Peripheral Vertigo n=52 Vertigo 48 (92,3%) Gait instability 27 (51,90%) Headache 12 (23,10%) NIHSS 0,83±1,451, max 8 Normal 32 ataxia 9 sensory changes 8 gait instability 29 CT Scan 5 (9,60%) MRI contributed to the diagnosis in 4 (7,7%) patients VB-Stroke 50 (96%) >24h with remission 49 (94%) Migraine n=33 Headache 84,80% Sensitive phenomena, (positive or negative) 63,60% Visual field changes 30,30% Double vision 21,20% NIHSS 0,52±1,004, max 4 Normal 24 sensory changes 9 Motor Arm 5 Leg 2 CT Scan 3 ( 9,10%) MRI negative in 32 (97%) patients T.I.A 10 (30%) VB-Stroke 8 (24%) Intra-cranial hemorrhage 4 (12%) Cerebral venous thrombosis 4 (12%) Less than 1h 4(12%) Less than 24h 4 (12%) >24h with remission 24 (73%) Acute peripheral neuropathies n=32 Double Vision 17(53,10%) Motor weakness 12 (37,50%) Sensory loss 11 (34,40%) NIHSS 1,75± 1,295 Horizontal gaze paresis 17 Facial paresis 11 Arm Strength 8 Sensitive 11 CT Scan negative in 31 (96,90%) MRI negative in 29 90,60% VB-Stroke 22 (69%) >24h with remission 22 (69%) No remission of symptoms 8 (25%) Multiple Sclerosis n=7 Sensitive 5 (71,40%) Left 4 (57,10%) Right 1 (14,30%) Motor 3 (42,9%) NIHSS 1,29± 1,496 Previous deficit 2 ( 28,60%) Normal 3 Motor Arm 3 Sensitive 3CT-Scan new lesions 3 42,90% MRI contributed to the diagnosis in 4 (57,10% ) patients VB-Stroke 4(57%) T.I.A 2 (29%) >24h with remission 3 (43%) no remission 3 (43%) Epilepsy n=24 Motor loss 9 (37,50%) Right 4 Left 4 Aphasia 29,20% Sensitive 25% NIHSS 2,58±3,4 Normal 8 Strength Arm 7 Leg 8 Face 5 Aphasia8 CT-scan Previous ischemic lesion 6 new lesions 0 MRI no lesions 22 (91,70%) Anterior circulation stroke 9 (38%) TIA 11 (46%) Less than 1h 3 (13%) Less than 24h 5 (21%) >24h with remission 16 (67%)