Open access
Assessing inequalities in geographical
access to emergency medical services in
metropolitan Lisbon: a cross- sectional
and ecological study
Katielle Susane do Nascimento Silva ,1 Miguel Padeiro2
To cite: Silva KSdN, Padeiro M. Assessing inequalities in geographical access to emergency medical services in metropolitan Lisbon: a cross- sectional and ecological study. BMJ Open 2020;10:e033777. doi:10.1136/ bmjopen-2019-033777 ►Prepublication history and supplemental material for this paper is available online. To view these files, please visit the journal online (http:// dx. doi. org/ 10. 1136/ bmjopen- 2019- 033777).
Received 22 August 2019 Revised 05 August 2020 Accepted 30 September 2020
1Centre of Geographical Studies
(CEG), Institute of Geography and Spatial Planning (IGOT), University of Lisbon, Portugal, Lisboa, Portugal
2Centre of Studies in Geography
and Spatial Planning (CEGOT), University of Coimbra, Coimbra, Portugal
Correspondence to Ms Katielle Susane do Nascimento Silva; katielle@ campus. ul. pt
Original research
© Author(s) (or their employer(s)) 2020. Re- use permitted under CC BY- NC. No commercial re- use. See rights and permissions. Published by BMJ.
ABSTRACT
Objectives Studies have suggested that material
deprivation is strongly associated with negative health outcomes, and lower usage of various levels of healthcare. We aim to analyse geographical access to emergency medical services (EMSs) and hospital emergency units by EMS in relation to deprivation in the Lisbon Metropolitan Area (LMA), Portugal.
Design This study estimates road network- based access
times from the centroids of statistical sections (census block groups equivalent) to locations of EMS and hospital emergency services. Each statistical section has been linked to a Material Deprivation Index (MDI). A non- parametric analysis of variance (ANOVA) was undertaken to compare MDI- linked statistical sections in terms of access to emergency care. Geographical access analysis was conducted for 2018.
Primary outcome measure Road network- based access
time (in minutes) for EMSs to statistical sections and then on to emergency units in hospitals.
Results Overall, 82.4% of the LMA population is located
less than a 10 min drive from an EMS without transport, and 99.1% from an EMS with transport. Travel time from EMS with transport to hospital is potentially less than 20 min for 95.2% of the population. However, 63.1% of residents living beyond a 30 min threshold (total time from emergency call to hospital arrival) are in areas with very high MDI (18.8% in high MDI, 13.3% in medium MDI, 4.7% in low MDI, 0% in very low MDI). Kruskal- Wallis ANOVA confirms discrepancies in access times between better- off and poorer areas.
Conclusion Poorer areas experience worse geographical
access to EMS and hospital emergency units. More research is needed to explore the quality of services and their outcomes, and to refine the analysis by focusing on specific vulnerable groups.
INTRODUCTION
Spatial justice is concerned with equitable access to resources and opportunities. In many cases, improvements in living condi-tions and the distribution of services have been unequally shared across individuals, groups and geographical areas, with poten-tial health consequences on vulnerable groups. There is indeed growing evidence
of associations between residential location in socially deprived areas and a wide variety of health conditions,1–4 premature and
preventable deaths5–7 and mental health8 and
suicide.9
Socioeconomically disadvantaged areas are more likely to amplify conditions of material deprivation through a number of under-lying interconnected mechanisms, leading to cumulative vulnerabilities4: (1)
neigh-bourhoods that concentrate low- income
groups with higher potential for poor health outcomes;10 (2) environments with high
exposure to risk factors such as air pollution and road traffic11 and (3) environments that
discourage healthy behaviours, for example, due to low access to green areas, shops and facilities.12
Since these disturbances are common, although not systematically associated to social deprivation,13 the geography of public
healthcare facilities is normally expected to attenuate socio- spatial discrepancies by providing equal opportunities for at- risk popu-lation. This is not always the case, however, as the so- called ‘inverse care law’ prevails in many settings, meaning that deprived areas tend to have worse geographical access to
Strengths and limitations of this study
► This study addresses geographical access to both emergency medical services (EMSs) (emergency vehicles) and hospital emergencies simultaneously.
► Potential travel time is estimated from the moment of the emergency call to arrival at the hospital, tak-ing into account the location of EMS.
► Deprivation Index and access times are measured at geographical level, not at the individual level.
► Availability and levels of emergency medical struc-tures were not taken into account.
► The study did not consider time variability of traffic and service availability on a daily or weekly scale. by copyright.
on November 11, 2020 at Universidade de Lisboa. Protected
http://bmjopen.bmj.com/
healthcare.6 14 15 Contrasting with these conclusions,
other studies have found that disadvantaged areas are actually better served.16
Low geographical accessibility to healthcare services has been found to be a strong factor of reduced utilisa-tion. The well- known distance- decay effect has been iden-tified in the usage of health services.17 This, again, tends
to deepen the gap between better- off and deprived areas. While disparities in access to healthcare and their resulting health outcomes are increasingly well documented, most of the existing literature on travel times to hospital emer-gency services are based either on private car use or on travel time only between patients’ location and hospital.18
Access to emergency services not only depends on the distance to the nearest hospital, but also on how far the patients are from an emergency medical services (EMSs) that can take them to the final destination.19
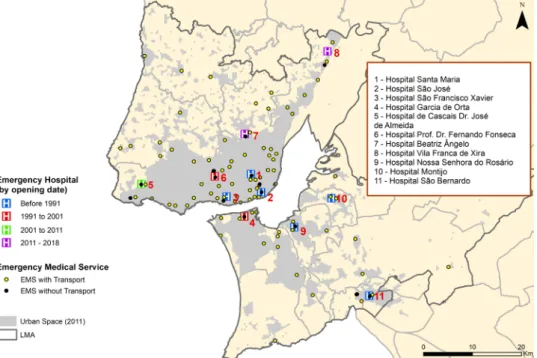
In recent years, the Portuguese healthy system has been under pressure, as the 2008–2012 economic crisis led to a reduction in resources and facilities, with potential effects on health inequalities. Between 2010 and 2018, the Lisbon Metropolitan Area (LMA) has seen some changes in the location of emergency services (two closures, two reloca-tions and one opening) (figure 1). Emergency services in Portugal are, since 1981, directed by the National Insti-tute of Medical Emergency (INEM), which coordinates the Urgent Patients Orientation Centre that connects patients with EMS and hospital emergency units. EMS belonging to the fire stations and delegations of the Portu-guese Red Cross (Cruz Vermelha Portuguesa—CVP) can be activated if the emergency call is located near them. EMS territorial bases therefore include INEM’s own bases, fire stations, CVP and emergency hospital units. More details are provided in online supplemental table 1.
The objective of this study is therefore to analyse geographical access to EMS and hospital emergencies across the LMA. This focus on EMS and hospital emer-gency services is important, first because of the relevance of time to survival, and second because successive political interventions have caused significant changes in hospital emergencies locations in the LMA, with unknown conse-quences to equality in access. Geographical access to EMS was analysed by the travel time of the nearest service in minutes, relative to the general population, and differ-entiated by levels of material deprivation. We hypothe-sise that potential travel times to EMS and hospital- based emergency services are higher from socially deprived areas than from other areas.
DATA AND METHODS Study design
This cross- sectional, ecological study examines potential access to EMSs and emergency hospitals by EMS across deprivation levels, using network- based times estimates and non- parametric analysis of variance (ANOVA).
Study area
The LMA extends over 3015 km2 and accounts for
2.8 million inhabitants (27% of the national population). High dispersion and spatial fragmentation of the built environment is a leading cause of accessibility issues, which makes this case study all the more pertinent to other contexts. Analysing the region was preferred over the entire country due to the difficulty of using aggre-gate methods and indicators for both rural and urban regions, and because of LMA’s territorial specificities when compared with the rest of the country.
Figure 1 Functional hospital units in the LMA (2018). Sources: National Institute of Emergency Medical. EMS, emergency medical service; LMA, Lisbon metropolitan area.
by copyright.
on November 11, 2020 at Universidade de Lisboa. Protected
Open access
Outcome
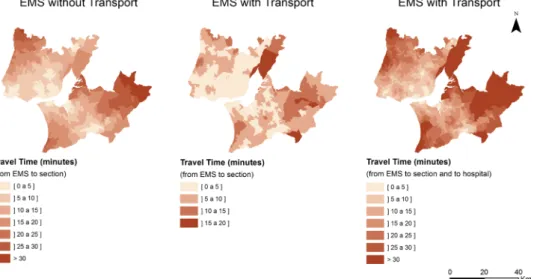
The shortest possible motorised travel time in minutes was estimated between EMSs, statistical sections, and hospi-tals using the Network Analyst tool of the ArcGIS V.10.2 program. Three types of routes were considered: (1) from the EMS to the initial point of care (EMS without trans-port); (2) the same routes, but using EMS with transport (differently located) and (3) the complete route between EMS with transport, the initial point of care (the statis-tical section) and the hospital using EMS with transport.
Data
This study relied on four main data sources. First, the 2011 Census data—the most recent in Portugal—provided population data at the statistical section level. Statistical sections (or just sections—census block groups equiva-lent) are geographical areas of variable size depending on the built environment and the location (LMA average 66.4 ha, median 6.6 ha, n=4521). Each section has approx-imately 300 dwellings (table 1). In mainland Portugal, there are 17.337 sections (average area and population: 5.13 km2 and 579, respectively).
Second, the INEM provided the georeferenced loca-tion of all EMSs. Among the existing 10 types of EMS, only non- specialised and terrestrial EMS were included. Here, we distinguish between: (1) EMS without transport services (n=14), including VMERs (Resuscitation and Emergency Medical Vehicles, crewed by an emergency medical physician and a nurse, and advanced features of life support equipment) and MEMs (Medical Emergency Motorcycles, crewed by a single medical emergency tech-nician and basic life support materials); (2) EMS with transport services (n=94), including AEMs (Basic Life Support Ambulances, crewed by two emergency medical technicians), ASs (Rescue Ambulance works in comple-mentarity with other EMS and staffed by crew trained in emergency medical techniques) and SIVs (Immediate Life Support Ambulances, similar to an AEM, also performing resuscitation and including an emergency medical nurse in its crew). More details are provided in online supple-mental table 1. Although travel times are estimated for EMS with transport and without transport separately, in practice the triggered EMS can be one of the two types, according to their availability at the moment of the emer-gency call.
Third, all addresses of hospitals with emergency services were collected and georeferenced for the year 2018. In this study, only intermediate (known as SUMC—Emergency Medical- Surgical Service, in Portugal) and more complex (SUP—Polyvalent Emergency Service) emergency hospi-tals were considered. The most basic emergency depart-ments (known as Basic Emergency Service) operating in the primary health centre were not considered because of cause of their limited diagnostic and therapeutic capacity.
Fourth, the road network was based on TomTom (2012) GPS freeway and national roads networks, and on a previously modelled road network,20 which includes
major urban roads and local roads network. The resulting network was modelled using Network Analyst in ArcGIS V.10.2. Travel times were estimated in minutes based on the legal top speeds of all infrastructures: freeways (120 km/hour), national roads (90 km/hour) and major roads (50 km/hour). Regarding local roads, speed was set at 30 km/hour based on comparison tests20 between
travel time using GPS TomTom road network and the modelled network.
Patient and public involvement
No patients involved.
Analysis
To assess area- level social vulnerability, a Material Depri-vation Index (MDI) was created, drawing on three census data variables: population unable to read or write (per cent of individuals aged 10 and over), unemployment rate (per cent of unemployed among the active population) and substandard housing rate (per cent of houses without a toilet). This index was preferred to the EDI- PT (Portu-guese version) —a more complex indicator adapted from the European Deprivation Index (EDI)21—because some
of the variables used for building it are not free of charge at the statistical section level at the National Statistics Institute. The index used here has been associated to a variety of health outcomes and behaviours.3 8 9 22
All three indicators were standardised to the LMA means and then added together to form the Multiple Deprivation Index, in accordance to the z- score- based Carstairs and Morris’ method.23 Such composite indices
have been widely used with some variations, and generally include variables related to education, housing condition, income, car ownership and/or employment.23 24 Here, we
did not include car ownership, as its use in social depri-vation indices is now increasingly debatable, first because the generalisation of cars has now made the indicator less powerful than it was for measuring poverty, and second because forced car ownership is frequently experienced as a financial burden that increases social vulnerability.
After calculating the MDI, statistical sections were divided into five MDI- based categories (or quintiles)
(figure 2): Very Low (with MDI ranging from −1.43
to −0.56), Low (from −0.56 to −0.26), Medium (from −0.26 to 0.00), High (from 0.00 to 0.41) and Very High MDI (from 0.41 to 8.86). Very High MDI equates to the Table 1 General characterisation of sections LMA (2011)
Average Median Min Max SD
MDI 0.0 −0.1 −1.4 8.9 0.7 Housing 329 324 0 884 80.3 Residents 624 613 0 2114 209.5 Population 65+ 114 112 0 515 54.3 Population<15 97 85 0 558 56.4
Sources: National Institute of Statistics (INE), authors’ calculations. LMA, Lisbon metropolitan area; MDI, material deprivation index.
by copyright.
on November 11, 2020 at Universidade de Lisboa. Protected
http://bmjopen.bmj.com/
most deprived 20%; Very Low MDI equates to the least deprived.
Network- based access times between EMS, statistical sections and hospital emergency services were then esti-mated. The destination point corresponds to the nearest hospital unit with emergency services, with the journey measured in minutes. This is a common approach in studies of geographical accessibility to emergency services, primary care or ongoing treatment.17
Finally, MDI- based categories of sections were
compared in relation to travel times. The analysis was performed using a Kruskal- Wallis test and a post hoc Dunn test, with statistical significance set at an alpha level of 0.05, to examine the differences between the various categories of MDI compared with access time, EMS/ section access and EMS/section/hospital unit. This is a non- parametric version of ANOVA, designed to deter-mine whether the medians of the categories are different. This test has the added advantage of being insensitive to both normality and variance heterogeneity assumptions; however, it is a less powerful test than the classic ANOVA or the Welch’s test.25 The Kruskal- Wallis test was chosen
due to homogeneity of variance issues and normality issues when compared with first attempts based on a clas-sical ANOVA and a Welch’s ANOVA approach, even after log- transformation of data. Homogeneity of variance was examined with Bartlett’s test (Bartlett’s K2=134.5, df=4,
p value <0.001; K2=380.7, df=4, p value <0.001; K2=283.1,
df=4, p value <0.001, respectively, for EMS without trans-port, EMS with transport from EMS to section and EMS
with transport, from EMS to section and to hospital). A Shapiro- Wilk test was performed for normality: W=0.9, p value <0.001; W=0.8, p value <0.001; W=0.9, p value <0.001, respectively). This led us to choose the non- parametric test. In addition, a multiple comparison test was performed using Holm procedure26 in order to test
the potential age structure effect as a covariate. Several variables have been tested as a covariate (old- age and young- age dependency ratios, per cent of residents under age 25, per cent of residents 65 or over). The reporting of this study follows guidelines from the STROBE statement (Strengthening the Reporting of Observational Studies in Epidemiology), except non- applicable items (6, 12- c, 13, 16- c).27
RESULTS
Global access times
Based on travel times, 82.4% of the population of the LMA has access to an EMS without transport within a 10- minute drive, 15.3% live between 10 and 20 min and 2.1% in the range between 20 and 30 min. The maximum access time is 34.9 min. Regarding EMS with transport, 99.1% is acces-sible within a 10- minute drive. Maximum access time is only 18.5 min. This is due to the greater number of EMS with transport than EMS without transport. Regarding full travel (from EMS with transport to section and from section to hospital), maximum access time is 44.7 min (more details are provided in online supplemental table 2). A total of 24 860 residents, corresponding to 0.9% of Figure 2 Geographical distribution of Material Deprivation Index (2011). Sources: National Institute of Statistics (INE), authors’ calculations.
by copyright.
on November 11, 2020 at Universidade de Lisboa. Protected
Open access
the total resident population of the LMA, live beyond the 30- minute threshold (full travel): 20.4% of them are aged 65 or over, and 15.8% are aged under 15. As expected, remote areas have longer access times (figure 3).
By MDI category
Based on deprivation levels, three findings can be high-lighted. First, maximum access times are systematically higher in Very High MDI sections (most deprived areas) than in lower MDI sections. The biggest disadvantage of the most deprived areas is in accessing hospital emer-gencies via ambulance, rather than in accessing EMS. EMS without transport: MDI Very High 34.9 min and Very Low 23.3 min; EMS with transport: MDI Very High 18.5 min and Very Low 11.3 min. Regarding full travel (from EMS with transport to section and from section to hospital): MDI Very High 44.7 min and Very Low
27.3 min (figure 4). Maximum access times also show a gradient—although not always regular—from Very Low MDI sections to Very High MDI sections. The percentage of inhabitants living within 5 min of an EMS considered is higher in the most affluent areas than in the most deprived for the three routes (EMS without transport, EMS with transport and full itinerary): MDI Very Low 58.7%, 97.7% and 26.0%; and MDI Very High 39.6%, 85.6% and 15.0%, respectively.
Second, distribution of residents living beyond the 30 min threshold (full itinerary) shows that populations living in Very High MDI sections have worse access to emergency care than other deprivation levels: Very High MDI (63.1%/15 703 persons), High MDI (18.8%/4673), Medium MDI (13.3%/3308), MDI Low (4.7%/1176) and Very Low MDI (0%).
Figure 3 Access time estimates. Sources: Network Analyst, authors’ calculations. EMS, emergency medical service.
Figure 4 Cumulative per cent of residents included in each access time class, and maximum access times. Sources: EMS, emergency medical service; National Institute of Statistics (INE), network analyst, authors’ calculations.
by copyright.
on November 11, 2020 at Universidade de Lisboa. Protected
http://bmjopen.bmj.com/
Third, the proportion of the population which expe-riences better access is always that with Very Low MDI, while the most deprived areas are almost always further from these services (figure 4). For example, 79.3% of people living in the least deprived areas (Very Low MDI) have a potential total transport time of less than 10 min (full itinerary), but only 63.8% of people living in the most deprived areas (Very High MDI) have an equiva-lent access time. Differences are apparent in almost every access time bracket. More details are provided in online supplemental table 3.
Analysis of variance
The Kruskal- Wallis test shows that there is a statistically significant difference between MDI- based categories, regardless of the type of itinerary: (1) EMS without transport (H(4)=99.866, p<0.01); (2) EMS with trans-port (EMS to section only) (H(4)=71.737, p<0.01) and (3) EMS with transport (full itinerary, from EMS to the nearest hospital) (H(4)=112.250, p<0.01).
Performing a post hoc Dunn test to the three itiner-aries allowed us to identify pairwise relationships between MDI- based categories and thus determine which of the medians are different from the others (online supple-mental tables 4–9 provide a global view of descriptive statistics, including confidence intervals for means at a 95% level). The results do not fully support the hypoth-esis of unequal access to the EMS without transport, as there is no significant difference between, for instance, Low MDI sections (6.3±0.3 min) and Very High MDI sections (6.8±0.3 min). However, difference between Very Low MDI sections (5.1±0.2 min) and the remaining ones is highly significant, and so is the difference between Low MDI sections and Medium and High MDI sections (6.9±0.3 min).
The second set of relations (EMS with transport- based EMS sections itineraries) shows slightly shorter access times due to a stronger presence of available EMS with transport (n=94). Here, it becomes clear that there is a significant difference between Very Low MDI sections (2.2±0.1 min) and all other ones, while Low MDI sections (2.4±0.1 min) differ significantly from High (2.7±0.1 min) and Very High (3.1±0.2 min) sections. Differences are not all significant in the middle group composed of Low, Medium and High MDI sections; however, Very High MDI sections, which gather the poorest 20% of the sections, differ from almost every other.
Finally, based on the full itinerary with EMS with trans-port, three groups are clearly identifiable. First, Very Low MDI sections display the shortest times (7.5±0.3 min) and are significantly different from the others. Second, Low MDI sections are slightly less accessible (8.8±0.3 min) but still differ statistically from all other categories. Third, the Medium, High and Very High MDI sections (60% of the LMA population) statistically differ from the remaining ones, with longer access times to the nearest hospital: 9.5±0.4 min, 9.8±0.4 min and 10.0±0.4 min, respectively. The greater the MDI value, the longer the accumulated
access time (EMS to section, and section to hospital). Again, more details are provided in online supplemental tables 4–9.
The findings are confirmed when adjusting for age structure using Holm procedure.26 Among age struc-ture variables tested, the variable pc65 (per cent of resi-dents aged 65 or over) provided the best adjustment. A 1% increase in the percentage of residents aged 65 or over results in a reduction of the total travel time, which varies according to the EMS considered. More details are provided in online supplemental tables 10–13.
DISCUSSION
This study contributes to the literature on socioeconomic inequalities and access to healthcare services. It shows that 82.4% of the population of the LMA is within a 10 min drive from an EMS without transport and 99.1% from an EMS with transport, while total travel time from EMS with transport to hospital is less than 20 min for 95.2% of the population. However, when deprivation levels are taken into account, the worst access times are associated with the highest deprivation levels as the proportion of people living beyond a 20 and 30 min threshold (full itin-erary, EMS with transport) is greater in Very High MDI sections than in any other. The relationship between MDI and access times was confirmed through non- parametric ANOVA.
These findings extend current knowledge on the iden-tification of small areas with lower access to healthcare and their association with deprivation levels, by relying not only on the location of people and hospitals, but by taking into account the location of EMSs and estimating the total travel time needed from the call to arrival at the hospital. This is important because the incorporation of the location of EMS in travel times can substantially rein-force or attenuate access discrepancies. EMS bases offer higher flexibility than hospitals, and their provision can more easily be adapted to the distribution of needs across space. The existence of discrepancies in total travel times may not be without consequences, first because in many emergency cases survival is time sensitive,28 and second
because with increased distance the utilisation of emer-gency units diminishes, particularly when deprivation levels are accounted for.29
Our findings are in accordance with several studies showing associations between deprivation areas and low geographical access to different types of healthcare services. In the Portuguese context, a study that covered a wide range of health services, at the national level and the scale of the municipality, also found evidence of injustice in access to healthcare, which is more scarce in the most impoverished areas.6 Other studies found that the areas
with the highest deprivation level were those with the worst geographical access to general practice and acute hospital,30 perinatal healthcare and hospitals.4 A few other
studies—not focusing on emergency services—concluded
by copyright.
on November 11, 2020 at Universidade de Lisboa. Protected
Open access
differently, however, as healthcare provision appears to be more equally distributed in some contexts.16
Reduced access time to both the nearest EMS and the nearest hospital is important to ensure an efficient and inclusive healthcare service. In that sense, geograph-ical access to EMS is as crucial for the survival rates of socioeconomically disadvantaged individuals as access to hospitals, either for urgent cases, chronic disease patients who need ongoing treatment or those who use hospital services regularly such as patients with diabetes.31
Maxi-mising geographical access to EMS in highly deprived areas could be achieved by a shift towards the logic of the positive care law in the organisation of EMS.15 Any
improvement should begin from enhancing geographical access to the first point of contact with EMS and hospital emergency services for groups at risk. This points to the need for a more comprehensive research on the location of EMS that takes into account socio- spatial inequities.
In Portugal, the benchmark geographical access time to any unit with emergency service is 60 min.32 However,
this can be an overestimate as it does not include time spent on scene before transfer to hospital. In 2007, the Technical Commission for Support to the Emergency Requalification Process proposed 30 min as the bench-mark for any unit within the emergency services and 45 min for an emergency SUMC or SUP. It was also argued that, in urban areas, 90% of prehospital service responses should ideally occur within 15 min.33 While our
study shows that the LMA context fits these recommen-dations, we also argue that any recommendations should take into account the geographical distribution of social strata, instead of merely using general population levels.34
This study has several limitations, the first of which is related to locations of both demanders and providers. The use of population- weighted centroids of statis-tical sections raises the well- known aggregation error bias issue,35 although it is a widely accepted method in
the absence of more accurate data.34 EMS locations are
more problematic since they can be activated when they are off base. EMS are likely to be located fairly close to hospitals at any given time, so it is possible that access is underestimated in the case of poorer neighbourhoods. Moreover, this study assumes geographical proximity as the single factor determining which hospital is the desti-nation. Emergency services utilisation can be modified by administrative boundaries. It might happen that in some cases hospital catchment areas do not coincide with what would be network- based areas of influence. A possible consequence is that travel times may be underes-timated in our analysis. However, emergency services are significantly less constrained within such boundaries than primary care services.
The second limitation relates to the estimated travel times reflecting potential geographical access, first because the time spent travelling to the hospital by the EMS does not account for the time initially dedicated to on- site care by the EMS, and second because daily and weekly variability of traffic is not considered here. Finally, this study did not
consider the actual availability of emergency medical hospi-tals to receive patients, as well as the availability of medical specialties in each structure. More research should consider overcoming these limitations.
Further research is needed to improve accessibility measurements and to acknowledge spatial injustice issues related to specific medical causes. While our study includes all potential causes resulting in travel to an EMS, it does not distinguish between them. Spatial injustice patterns may be different for different health conditions. Deepening the discussion of spatial justice in health would also include assessing the delivery of emergency services (outputs) and their results (outcomes). Future research should focus on some vulnerable groups such as older adults and migrant groups. In the context of both ageing populations and increasing migration (migrant populations are often asso-ciated with poorer health), the availability of pre- emergency care will be increasingly under pressure.
CONCLUSION
This study contributes to a better evaluation of inequal-ities in access to healthcare and complements previous studies conducted in Portugal.1 6 36–38 To our knowledge, no
previous study specifically addresses travel times to EMS and to hospital emergency service by EMS in Portugal. The anal-ysis presented here gives support to the notion that space can act to reinforce of health inequalities. It thus becomes increasingly necessary to rethink EMS distribution in a way that counteracts spatial injustice and improves geographical access to the first point of contact for emergency services in the most impoverished areas. This study draws attention to the importance of considering the socioeconomic charac-teristics of the population when planning for EMS location. This is particularly relevant for households without a private vehicle that depend exclusively on the availability of EMS to get to the nearest hospital.
Twitter Katielle Susane do Nascimento Silva @katiellesusane
Acknowledgements The authors are grateful to the Portuguese National
Institute of Medical Emergency for graciously providing the data. The authors are also grateful to Marcos Correia for providing the road network that was used in the study and Archie Davies for the linguistic reviewing of the manuscript. The authors also thank Luís Henrique Gama Dore de Araújo and Bruna Bronhara for the statistical review of the methods and findings. Finally, the authors are grateful to the reviewers for their helpful comments.
Contributors KSdNS conceptualised the study and undertook the literature
review, collected the data, built the database and analysed the general results. MP designed the statistical analysis and analysed the results. At different stages KSdNS and MP were involved in the development of the methods, data analysis and interpretation. KSdNS led the drafting of the manuscript. MP reviewed the manuscript, and KSdNS revised it. All authors approved the final version.
Funding This work was supported by the Centre of Geographical Studies of the
Institute of Geography and Spatial Planning at the University of Lisbon funded by the Fundação para a Ciência e aTecnologia (FCT, I.P.), under the grants «UIDB/ GEO/00295/2020» and «UIDP/GEO/00295/2020»; and the Coordination for the Improvement of Higher Education Personnel, a Foundation within the Ministry of Education in Brazil with the research project Health and Spatial Justice: The Geography of the Emergency Services in the Lisbon Metropolitan Area approved under the agreement number 1685-13-9.
by copyright.
on November 11, 2020 at Universidade de Lisboa. Protected
http://bmjopen.bmj.com/
Map disclaimer The depiction of boundaries on the map(s) in this article does not imply the expression of any opinion whatsoever on the part of BMJ (or any member of its group) concerning the legal status of any country, territory, jurisdiction or area or of its authorities. The map(s) are provided without any warranty of any kind, either express or implied.
Competing interests None declared.
Patient consent for publication Not required.
Provenance and peer review Not commissioned; externally peer reviewed.
Data availability statement Access time estimates and Material Deprivation
Index categories are available from the Figshare repository, DOI: 10.6084/ m9.figshare.13153952. The sections IDs have been removed from the dataset; they can be provided upon request. Other data are available upon reasonable request. We are however unable to provide the EMS dataset, as this is a proprietary dataset (National Institute of Medical Emergency- INEM). We also are unable to provide the road network dataset, as it was graciously provided by our colleague Marcos Correia.
Supplemental material This content has been supplied by the author(s). It has
not been vetted by BMJ Publishing Group Limited (BMJ) and may not have been peer- reviewed. Any opinions or recommendations discussed are solely those of the author(s) and are not endorsed by BMJ. BMJ disclaims all liability and responsibility arising from any reliance placed on the content. Where the content includes any translated material, BMJ does not warrant the accuracy and reliability of the translations (including but not limited to local regulations, clinical guidelines, terminology, drug names and drug dosages), and is not responsible for any error and/or omissions arising from translation and adaptation or otherwise.
Open access This is an open access article distributed in accordance with the
Creative Commons Attribution Non Commercial (CC BY- NC 4.0) license, which permits others to distribute, remix, adapt, build upon this work non- commercially, and license their derivative works on different terms, provided the original work is properly cited, appropriate credit is given, any changes made indicated, and the use is non- commercial. See: http:// creativecommons. org/ licenses/ by- nc/ 4. 0/. ORCID iD
Katielle Susane do Nascimento Silva http:// orcid. org/ 0000- 0001- 5935- 9390
REFERENCES
1 Apolinário D, Ribeiro AI, Krainski E, et al. Tuberculosis inequalities and socio- economic deprivation in Portugal. Int J Tuberc Lung Dis
2017;21:784–9.
2 Semenza JC, Suk JE, Tsolova S. Social determinants of infectious diseases: a public health priority. Euro Surveill 2010;15:19608. 3 Santana P, Costa C, Marí-Dell'Olmo M, et al. Mortality, material
deprivation and urbanization: exploring the social patterns of a metropolitan area. Int J Equity Health 2015;14:55.
4 Macintyre S, Macdonald L, Ellaway A. Do poorer people have poorer access to local resources and facilities? the distribution of local resources by area deprivation in Glasgow, Scotland. Soc Sci Med
2008;67:900–14.
5 Almendra R, Santana P, Vasconcelos J. Evidence of social deprivation on the spatial patterns of excess winter mortality. Int J Public Health 2017;62:849–56.
6 Ribeiro AI, Krainski ET, Carvalho MS, et al. The influence of socioeconomic deprivation, access to healthcare and physical environment on old- age survival in Portugal. Geospat Health
2017;12:581.
7 Hoffmann R, Borsboom G, Saez M, et al. Social differences in avoidable mortality between small areas of 15 European cities: an ecological study. Int J Health Geogr 2014;13:8.
8 Loureiro A, Santana P, Nunes C, et al. The role of individual and neighborhood characteristics on mental health after a period of economic crisis in the Lisbon region (Portugal): a multilevel analysis.
Int J Environ Res Public Health 2019;16:2647–18.
9 Santana P, Costa C, Cardoso G, et al. Suicide in Portugal: spatial determinants in a context of economic crisis. Health Place
2015;35:85–94.
10 White K, Haas JS, Williams DR. Elucidating the role of place in health care disparities: the example of racial/ethnic residential segregation.
Health Serv Res 2012;47:1278–99.
11 Fleury D, Peytavin JF, Alam T, et al. Excess accident risk among residents of deprived areas. Accid Anal Prev 2010;42:1653–60.
12 Hamano T, Kawakami N, Li X, et al. Neighbourhood environment and stroke: a follow- up study in Sweden. PLoS One 2013;8:e56680. 13 Bocquier A, Cortaredona S, Boutin C, et al. Small- area analysis of
social inequalities in residential exposure to road traffic noise in Marseilles, France. Eur J Public Health 2013;23:540–6. 14 Hart JT. The inverse care law. The Lancet 1971;27:406–12. 15 Shaw M, Dorling D. Who cares in England and Wales? the positive
care law: cross- sectional study. Br J Gen Pract 2004;54:899–903. 16 Todd A, Copeland A, Husband A, et al. The positive pharmacy care
law: an area- level analysis of the relationship between community pharmacy distribution, urbanity and social deprivation in England.
BMJ Open 2014;4:e005764.
17 Alford- Teaster J, Lange JM, Hubbard RA, et al. Is the closest facility the one actually used? an assessment of travel time estimation based on mammography facilities. Int J Health Geogr 2016;15:1–10. 18 Pedigo AS, Odoi A. Investigation of disparities in geographic
accessibility to emergency stroke and myocardial infarction care in East Tennessee using geographic information systems and network analysis. Ann Epidemiol 2010;20:924–30.
19 Patel AB, Waters NM, Blanchard IE, et al. A validation of ground ambulance pre- hospital times modeled using geographic information systems. Int J Health Geogr 2012;11:42.
20 Correia M. The influence of transportation Infrastructures and policies on urban sprawl expansion. A longitudinal study of the Lisbon metropolitan area, 2019: 188.
21 Ribeiro AI, Launay L, Guillaume E, et al. The Portuguese version of the European deprivation index: development and association with all- cause mortality. PLoS One 2018;13:e0208320.
22 Santana P, Santos R, Nogueira H. The link between local environment and obesity: a multilevel analysis in the Lisbon metropolitan area, Portugal. Soc Sci Med 2009;68:601–9.
23 Carstairs V, Morris R. Deprivation and health in Scotland. Health Bull
1990;48:162–75.
24 Townsend P, Phillimore P, Beattie A. Health and deprivation: inequality and the North. Abingdon: Routledge, 1988.
25 Ostertagová E, Ostertag O, Kováč J. Methodology and application of the Kruskal- Wallis test. Applied Mechanics and Materials
2014;611:115–20.
26 Holm S. A simple sequentially rejective multiple test procedure. Scandinavian J Statistics 1979;6:65–70.
27 von Elm E, Altman DG, Egger M, et al. Strengthening the reporting of observational studies in epidemiology (STROBE) statement: guidelines for reporting observational studies. BMJ 2007;335:806–8. 28 Sund B. Developing an analytical tool for evaluating EMS system
design changes and their impact on cardiac arrest outcomes: combining geographic information systems with register data on survival rates. Scand J Trauma Resusc Emerg Med 2013;21:8. 29 Rudge GM, Mohammed MA, Fillingham SC, et al. The combined
influence of distance and neighbourhood deprivation on emergency department attendance in a large English population: a retrospective database study. PLoS One 2013;8:e67943.
30 Jordan H, Roderick P, Martin D, et al. Distance, rurality and the need for care: access to health services in South West England. Int J Health Geogr 2004;3:21.
31 Brabyn L, Skelly C. Modeling population access to new Zealand public hospitals. Int J Health Geogr 2002;1:3.
32 Portugal, Despacho ministerial n.° 10438/2016, de 19 de agosto. Gabinete do secretário de estado adjunto E dA saúde., 2016. Diário dA RepúblicaSaúde - Gabinete do Secretário de Estado Adjunto e da Saúde. Available: https:// dre. pt/ pesquisa/-/ search/ 75166597/ details/ normal? l=1 [Accessed 23 July 2019].
33 Relatório Proposta da Rede de Urgência - Comissão Técnica de Apoio ao Processo de Requalificação das Urgências. Ministério da Saúde. Portugal. Available in the library archive of the Escola Superior de Enfermagem of Lisbon 2007:1–24.
34 Law MR, Dijkstra A, Douillard JA, et al. Geographic accessibility of community pharmacies in Ontario. Healthc Policy 2011;6:36–45. 35 Langford M, Higgs G. Measuring potential access to primary
healthcare services: the influence of alternative spatial representations of population. The Geogr 2006;58:294–306. 36 Santana P. Utilização dos cuidados hospitalares: uma abordagem da
geografia da saúde. In: Vaz A, Ramos F, Pereira J, eds. As reformas DOS sistemas de saúde. Lisboa: APES, 1996: 182–208.
37 Ribeiro V. A (in)equidade no acesso aos serviços de saúde: uma abordagem exclusão social no município de Braga. In: Remoaldo P, Nogueira H, eds. Desigualdades Socioterritoriais E Comportamentos em Saúde, Braga, Edições Colibri. Lisboa: Colibri, 2013: 200–43. 38 Padeiro M. Comparing alternative methods to measuring pedestrian
access to community pharmacies. Health Serv Outcomes Res Method 2018;18:1–16.
by copyright.
on November 11, 2020 at Universidade de Lisboa. Protected