ARTÍCULO ORIGINAL ACEPTADO
Revista Contaduría y Administración
Journal of Accounting and Management
Editada por la División de Investigación de la Facultad de Contaduría y Administración de la UNAM
http:www.cya.unam.mx
Artículo original
aceptado
(en corrección)
Título:
Compliance with intangible assets aisclosure requirements: study of Portuguese non-financial companies
Autor: Graça Maria do Carmo Azevedo, Jonas Silva
Oliveira, Maria Arnanda Freitas Couto
Fecha de recepción: 1.10.2017 Fecha de aceptación: 4.06.2018
El presente artículo ha sido aceptado para su publicación en la revista Contaduría y Administración. Actualmente se encuentra en el proceso de revisión y corrección sintáctica, razón por la cual su versión final podría diferir sustancialmente de la presente. Una vez que el artículo se publica ya no aparecerá más en esta sección de artículos de próxima publicación, por lo que debe citarse de la siguiente manera:
Azevedo,G. M. C., Oliveira, J. S., Couto, M. A. F.(2019). Compliance with intangible assets disclosure requirements: study of portuguese non-financial companies. Contaduría y Administración, próxima publicación.
ARTÍCULO ORIGINAL ACEPTADO
Compliance with intangible assets disclosure requirements: study of
Portuguese non-financial companies
Graça Maria do Carmo Azevedo a1, Jonas Silva Oliveira b, Maria Arnanda Freitas Couto a
a Institute of higher learning in accounting and administration b Instituto universitário de Lisboa
Abstract
The present study aims to identify the degree of compliance with the intangible assets disclosure requirements outlined in the Accounting and Financial Reporting Standard (Norma Contabilística de Relato Financeiro – NCRF) 6 - Intangible Assets. It also seeks to analyse the factors influencing compliance with intangible assets mandatory disclosure requirements. An analysis of the 500 largest companies ranked by Exame Magazine, 2010, which are subject to the general Portuguese Accounting Standards System (Sistema de Normalização Contabilística - SNC), was conducted to check whether their Financial Statements for the years 2010 (transition year) and 2011 were made available on their websites. The methodology chosen to answer the research questions and achieve the proposed objectives was the content analysis of the financial statements of a sample of 37 Portuguese unlisted companies. The data collected in 2010 and 2011 allowed the construction of an index of intangible assets and the identification of disclosure explanatory factors. We tested six hypotheses for a possible association between the disclosure index and six explanatory variables through analysis, descriptive statistics, normality, differences in means, correlation and regression. Our results show an average of 30% in the disclosure index for intangible assets. Contrary to what was expected, results confirm that the adoption of SNC did not cause a higher level of disclosure over time. Companies’ size is the most influencing factor, indicating that larger companies disclose information on intangible assets basically to reduce agency costs, political costs related to
ARTÍCULO ORIGINAL ACEPTADO
their public visibility, and in such a way manage the relationship with their relevant stakeholders.
Keywords: Disclosure; intangible assets; transition and degree of compliance with
disclosure requirements. JEL Classification: M21; M40
Resumen
El presente estudio tiene como objetivo identificar el grado de cumplimiento de los requisitos de divulgación de activos intangibles descritos en el Estándar de Contabilidad y Presentación de Informes Financieros (Norma Contabilística de Relato Financeiro - NCRF) 6 - Activos intangibles. También busca analizar los factores que influyen en el cumplimiento de los requisitos de divulgación obligatoria de los activos intangibles. Se realizó un análisis de las 500 empresas más grandes clasificadas por la Revista Exame, 2010, que están sujetas al Sistema de Normalización Contable (Sistema de Normalização Contabilística - SNC), para verificar si sus Estados Financieros para los años 2010 (año de transición) y 2011 estuvieron disponibles en sus sitios web.
La metodología elegida para responder a las preguntas de investigación y alcanzar los objetivos propuestos fue el análisis de contenido de los Estados Financieros de una muestra de 37 empresas portuguesas no cotizadas. Los datos recopilados en 2010 y 2011 permitieron la construcción de un índice de activos intangibles y la identificación de factores explicativos de divulgación. Probamos seis hipótesis para una posible asociación entre el índice de divulgación y seis variables explicativas a través del análisis, la estadística descriptiva, la normalidad, las diferencias de medias, la correlación y la regresión.
Nuestros resultados muestran un promedio de 30% en el índice de revelación de activos intangibles. Al contrario de lo que se esperaba, los resultados confirman que la adopción de SNC no causó un mayor nivel de divulgación en el tiempo. El tamaño de las empresas es el factor que más influye, lo que indica que las empresas más grandes divulgan información sobre activos intangibles básicamente para reducir los costos de agencia, los
ARTÍCULO ORIGINAL ACEPTADO
costos políticos relacionados con su visibilidad pública y de esa manera gestionar la relación con sus stakeholders relevantes
Palabras clave: divulgación; activos intangibles; transición y grado de cumplimiento de
los requisitos de divulgación. Código JEL: M21; M40
Introduction
Knowledge is considered the new and main source of value for organisations and it can be included in the concepts of either intellectual capital or intangible assets. Oliveira, Rodrigues, and Craig (2006) argue that intellectual capital comprises several components (knowledge of human resources, experience, information, and learning abilities). Therefore, knowledge is not a definition for intellectual capital.
However, there is no consensus in defining intellectual capital and intangible assets. In this regard, the Meritum (2002) establishes that intellectual capital is used to identify those organisational resources capable of generating future economic benefits, with no physical substance, and which can either be or not recognised in the financial statements. On the other hand, the concept of intangible assets used in accounting is subject to specific accounting requirements.
The present study analyses the factors that might explain the level of mandatory disclosure of intangible assets information in 37 Portuguese non-financial companies not listed in the regulated stock exchange market for the years 2010 and 2011.
In 2002, the European Commission issued Regulation (EC) 1606/2002 required the adoption of International Accounting Standards / International Reporting Standards (IAS/IFRS) by all companies with securities traded on European stock exchange regulated markets in the preparation of their consolidated financial statements. The same regulation also allowed member states to extend this requirement to other companies (such as non-listed companies).
Based on this regulation, in July 2009, the Portuguese Accounting Committee (CNC - Comissão de Normalização Contabilística) approved a new accounting frame of reference entitled Portuguese Accounting Standardization System (SNC – Sistema de
ARTÍCULO ORIGINAL ACEPTADO
Normalização Contabilística). Consistent with Regulation (EC) 1606/2002, the SNC’s accounting standards were based on IAS/IFRS, which superseded the previous Portuguese Accounting Plan (POC – Plano Oficial de Contabilidade), and were first adopted by Portuguese unlisted companies in January 2010.
The SNC’s accounting standard dealing with intangible assets is Accounting and Financial Reporting Standard (NCRF – Norma Contabilística de Relato Financeiro) 6 – Intangible Assets.
In 2015, the Decree-Law No. 98/2015 of June 2 transposed the Directive 2013/34/EU of the European Parliament and of the Council, of 26 June 2013, into the Portuguese jurisdiction, regarding the annual financial statements, the consolidated financial statements and related reports of certain types of companies. The Decree-Law No. 98/2015 was also intended to proceed with the unification and clarity of the SNC, approved by Decree-Law No. 158/2009. However, the disclosure requirements for intangible assets remained unchanged and similar to those required by IAS 38 (Intangible Assets) and IFRS 3 (Business Combinations) for those intangible assets acquired in a business combination (Appendix 1).
At an international level, studies are mainly focused on voluntary disclosure of intangible assets in different settings across the globe: Australia (Guthrie & Petty, 2000; Woodrock & Whitiny, 2009); Germany (Goebel, 2015) Ireland (Brennan, 2001); Italy (Bozzolan, Favotto & Ricceri, 2003); Saudi Arabia (Razak, Mohammad & Tobiagi, 2016); South Africa (April, Boonia & Deglon, 2003); Malaysia (Goh & Lim, 2004); Sri Lanka (Abeysekera & Guthrie, 2005); Spain (Oliveras, Gowthorp, Kasperskaya & Perramon, 2008); New Zealand (Wong & Gardner, 2004; Whiting & Miller, 2008; De Silva, Stratford & Clark, 2014) and even among different countries in the European Union (André, Dionysiou & Tsalavoutas, 2017). However, even after the changes that have occurred in SNC between 2009 and 2015, there are still no research studies on the extent of mandatory disclosures based on IAS/IFRS adapted standards by unlisted companies during the transition period to a new accounting frame of reference based on IAS/IFRS.
The present study tries to fill this void by examining the level of compliance with the disclosure requirements of intangible assets by Portuguese non-finance unlisted companies specifically in the years 2010 and 2011. The choice of this time frame period is
ARTÍCULO ORIGINAL ACEPTADO
particularly interesting for two main reasons: a) first, it correspond to the two years of application of the new accounting frame of reference, with a different institutional logic regarding financial reporting. The previous accounting frame of reference, the Portuguese Accounting Plan (POC – Plano Oficial de Contabilidade) followed a code law institutional logic. However, since SNC is based on IAS/IFRS standards it is characterised by a common-law institutional logic. Moreover, since 2005, Portuguese listed companies have been adapting their financial reporting practices to a common-law institutional logic (Guerreiro et al. 2012). However, Portuguese unlisted companies only performed this change in 2010. Thus, this research setting is interesting to assess the consequences of this change of financial reporting practices institutional logic and understand which companies are better prepared to comply with this new accounting frame of reference; b) second, it corresponds to a period of specific financial distress for Portuguese companies due to the deep consequences of the recent global financial crisis of 2007-2008 and the recent European sovereign debt crisis. Therefore, it is useful to analyse if companies used disclosures on intangible assets to manage their relations with relevant stakeholders in order to manage corporate reputation during a period of financial distress.
Prior literature reveals that intangible assets play an increasingly significant role in the decision-making process of several users of annual reports, essentially at the level of voluntary disclosure. But the present study shows that the level of mandatory disclosure of intangible assets is low in Portugal and basically restricted to information on useful lives, amortisation rates and methods, and gross carrying amounts and any accumulated amortization at the beginning and end of the reporting period. Moreover, larger companies basically disclose more information to reduce agency costs, manage political costs or even to mitigate non-compliance costs associated with organizational legitimacy purposes. Thus, this study may be fruitful to Portuguese regulatory entities to assist them in understanding and improving the real impact of accounting standards (Trombetta et al., 2012). It will also be helpful to Portuguese companies to explore the areas of disclosure of intangible assets capable of providing more useful and relevant information to the users of annual reports.This paper includes, besides the introduction, a literature review and development of hypotheses for testing, followed by an explanation of the research method
ARTÍCULO ORIGINAL ACEPTADO
used, presentation and discussion of results, conclusions, study limitations and future research.
Literature Review and Development of Hypotheses
Literature Review
Knowledge has been described as the new and main source of value creation within an organisation and it can be conceived in many ways, such as intellectual capital and intangible assets (Oliveras et al., 2008; Canibano, 2018; Canibano, García-Ayuso & Sanchez, 2000; Martins & Lopes, 2016).
Canibano and Sanchéz (2004) stated that traditional financial reporting is not enough to satisfy the information needs of stakeholders regarding intangible assets, leading, thus, to the devaluation of companies and bias in analysts’ predictions. Góis (2013) argued that financial reporting is an incentive for managers to manipulate financial information, with consequences for the economic decision-making process.
Several authors have argued that this kind of financial reporting is highly emphasised in the field of intangible resources, such as human resources and relationships with customers (Lev & Zarowin, 1999; Canibano, García-Ayuso, Sanchez, Chaminade & Escobar, 1999; Hedlin & Adolphson, 2000; Oliveira et al., 2006).
According to Lev and Zarowin (1999), this type of financial reporting is associated with excessive costs of capital, strong volatility in corporate stock prices, bias in analysts’ predictions, and finally, corporate reputation losses.
IAS/IFRS and financial reporting have led to an extensive range of studies developed by financial analysts and academics on a global scale. The present literature review will address the first impacts of IAS/IFRS, associated disclosure theories, and studies on the determinants of intangible assets disclosure.
First Impacts of IAS/IFRS Adoption
As from 1 January 2005 and in accordance with Article 4 of Regulation (EC) 1606/2002, entities with securities admitted to trading on a regulated market of any European Union Member State are required to submit their consolidated financial statements according to IAS/IFRS adopted by the EU.
ARTÍCULO ORIGINAL ACEPTADO
Therefore, to provide some empirical evidence on the impacts of IAS/IFRS, we will examine some of the studies that focus on the following topics:
i) Compliance/convergence with IAS/IFRS
Thomaz, Kronbauer, Ott, and Rojas (2015) examined the level of convergence of accounting practices related to the measurement and disclosure of fixed and intangible assets in Mercosur and Andean Community industrial companies. The results showed that: different practices prevail in different countries, and that the adoption of IASB standards related to fixed and intangible assets does not necessarily imply compliance and convergence, meaning that full harmonisation among the Mercosur and Andean Community countries is far from being achieved. Coste, Tudor, and Pali-Pista (2014) investigated the degree of compliance with the disclosure of IAS 16, IAS 36 and IAS 38 in Romania and Hungary, for 2011, and found that entities show, on average, a compliance of 55.55% with the IAS/IFRS disclosure requirements. The authors also argued that the implementation process of IAS/IFRS in Romania is expensive, and a long term investment should be considered. Liao, Chan, and Seng (2013) analysed the association between the level of intellectual capital disclosure and the mandatory adoption of IFRS in high technology companies in the UK. Their findings showed a significant association between the level of intellectual capital disclosure and IFRS adoption (up to 78.2 percent, which is the IFRS compliance level in high technology companies), in the post-adoption period.
Tsalavoutas (2011) examined the compliance level with all IAS/IFRS mandatory disclosure requirements, in 2005, in 153 Greek companies listed on the Greek Stock Exchange, and demonstrated that about 20% of the companies comply with 90% of IAS/IFRS mandatory disclosure requirements. Morais and Fialho (2008) analysed the level of harmonisation between IAS 39 – Financial Instruments and the reporting practices of financial instruments, in a large sample of 203 listed European companies, in 2005. Results showed a high degree of compliance with the IAS 39 measurement requirements in the first year of mandatory adoption. Gomes, Serra and Ferreira (2005) examined the degree of adaptation to IAS 38 – Intangible Assets in a sample of 49 Portuguese companies with securities listed on Euronext Lisbon, in 2003. A low degree of adjustment (approximately 30%) to IAS 38 requirements was observed. This result is explained by a reduced
ARTÍCULO ORIGINAL ACEPTADO
awareness of international accounting standards, as a result of the lack of mandatory standards in Portugal, which only occurred in 2005, and also because IAS 38 requirements are restrictive. Fontes, Rodrigues and Craig (2005) also analysed the progress of the Portuguese accounting standards system (towards the harmonisation of standards with IFRS). This convergence was appraised for the period between 1977 and 2003, and results showed a partial convergence of Portuguese standards with IFRS.
ii) Disclosure determinants in the transition to IAS/IFRS
Devalle and Rizzato (2014) analysed the quality determinants of mandatory disclosure of IAS 38 – Intangible Assets, based on a sample of 165 Italian Stock Exchange companies. Data was collected from consolidated financial statements for 2010 and results demonstrated that: a) the amount of intangible assets, firm size, and return on equity are positively associated with the quality of IAS 38 disclosure; b) the financial sector has a higher disclosure level of information on intangible assets - IAS 38; and c) the requirements outlined by IAS 38 are not fully accomplished by all companies in the sample. Tsalavoutas (2011) found that auditing, industry, and changes in shareholders’ equity/net profit explain the compliance with IAS/IFRS mandatory disclosure requirements. Morais and Fialho (2008) analysed the reporting practices for financial instruments (IAS 39), and neither institutional factors, nor business characteristics (size, type of industry or sector, profitability, listing status and type of auditor) seem to influence the level of compliance with IAS 39 requirements, contradicting prior studies. Finally, Lopes and Rodrigues (2007) show that the disclosure level for financial instruments is significantly related to size, auditor type, listing status, and economic sector (before the mandatory adoption of IAS, which only occurs in 2005). In larger companies, listed on more than one stock exchange market and with audited accounts by one of the Big Four auditing firms, there is a higher level of compliance with IAS requirements.
iii) Quantitative consequences of IAS/IFRS Adoption
Denicolai, Ramusino, and Sotti (2015) examined the effects of intangibles on firm growth in 294 European listed companies and concluded that intangibles are “crucial in fostering firm performance”. This effect is likely to be stronger if externally generated
ARTÍCULO ORIGINAL ACEPTADO
intangible assets are used, and firm size appears to be a determinant factor. Misirlioglu, Tucker, and Yükseltürk (2013) analysed the extent of changes in the measurement criteria and disclosure in 106 Turkish listed companies after mandatory adoption of IFRS (financial firms and investment institutions were excluded) and the main conclusions were: new standards significantly affect certain accounts and IFRS adoption is not uniform across accounts. Moreover, auditing firms, company’s size and foreign ownership structure have a positive effect on the improvement of overall disclosures. Ferreira, Cravo, and Azevedo (2012) analysed the effects of NCRF 6 adoption on the value of intangible assets, economic/financial indicators and company’s performance. They concluded that the adoption of NCRF 6 had significant effects on the value of intangible assets and no relevant effects on the economic/financial indicators and company’s performance. Tsalavoutas (2011) also investigated the association between mandatory disclosure of IFRS (during the transition period to IAS/IFRS) and changes on the income of shareholders and in company’s net income. Findings confirmed both hypotheses.
iv) Level of preparedness to adopt IAS/IFRS
Misirlioglu et al., (2013) show that a low level of items disclosed under IFRS could mean inappropriate preparation to accomplish all IFRS requirements by Turkish companies. In a study conducted by Guerreiro, Rodrigues, and Craig (2012), among large unlisted Portuguese companies, the authors found low levels of preparedness to adopt IAS/IFRS and this level of preparedness was affected “by resistance within the Portuguese accounting profession and by the embeddedness of code-law practices in the prevailing logic”.
Associated Theories
Many studies on disclosure and its determinants concluded that there is not a single explanatory and comprehensive theory for corporate disclosure, but several theories. Each theory develops a different point of view regarding corporate disclosure, showing that in practice mandatory and voluntary disclosures are correlated (Alberti-Alhtaybat, Hutaibat & Al-Htaybat, 2012;Shiemann, Ritcher & Gunther, 2015). The work developed by these authors had the purpose of mapping corporate explanatory disclosure theories to tackle
ARTÍCULO ORIGINAL ACEPTADO
both information asymmetry and adverse selection. The authors support the existence of various explanatory disclosure theories: free markets theory, market failure theory, environmental theory, regulatory theory, and manager incentives theory. The manager incentives theory is considered as the remaining part of the solution for disclosure problems and comprises the following theories: agency, political costs, legitimacy, capital needs, signalling and cost-benefit analysis, which will be addressed below. Agency, political costs, legitimacy and signalling theories form the background of the present study. The first and fourth theories are concerned with the maximisation of firm’s value, while company image or reputation is the focus of the second and third theories.
Agency theory deals with the relationship between shareholders and managers, who may act in their own interests at the expense of shareholders. Hence, the need to monitor management procedures might imply costs, referred as agency costs. Such costs increase as the ownership structure becomes more diffuse, because there is a greater probability of conflicts of interest between managers and owners (Fama & Jensen, 1983). So, to reduce such agency costs, managers disclose more information (Cooke, 1989a; Raffournier, 1995). Based on agency theory, which explains disclosure variations, many other authors have addressed this issue (Białek-Jaworska & Matusiewicz, 2015; Biscotti & D’Amico, 2016; Cotter, Lokman & Najah, 2011; Dumay & Guthrie, 2017; Martins, 2012 ; Oliveira, Rodrigues & Craig, 2011; Oliveira et al., 2006; Ousama, Fatima & Hafiz-Majdi, 2012; Wallace & Naser, 1995; Wallace, Naser & Mora, 1994).
Political costs theory sustains that companies face costs as a result of the attention they get from the government or other groups, in the form of increased taxes and fees, payments or boycotts to their products. Thus, financial, social and environmental disclosures are used to avoid those costs. This theory is commonly mentioned in research studies on disclosure level variation when corporate size is the explanatory variable (Alberti-Alhtaybat et al., 2012; Kang & Gray, 2011; Li, Pike & Haniffa, 2008; Lopes & Rodrigues, 2007; Macagnan, 2009; Oliveira et al., 2006; Tsalavoutas, 2011; Wallace et al., 1994; Williams, 2001).
Legitimacy theory suggests that corporation’s activities are subject to certain rules and standards issued by regulatory authorities, and non-compliance implies either adjustment costs, political costs or asymmetric information costs. Therefore, companies
ARTÍCULO ORIGINAL ACEPTADO
are encouraged to disclose information to mitigate non-compliance costs (Silva, Rodrigues & Muñoz Dueñas, 2012). This theory states that there is a social contract between business and society, and companies must implement actions in order to convey a true and fair view of their business. Through disclosure practices, companies seek to ensure that their operations and activities are perceived by stakeholders as legitimate, contributing to the general welfare of society (Cotter et al., 2011; Ousama et al., 2012).
Signalling theory describes how asymmetric information problems can be reduced by managers through the disclosure of more information to relevant stakeholders. It is based on the assumption that companies with a low leverage ratio are motivated to give signals to the market about their financial structure and that is why they are expected to disclose more information voluntarily. In other words, to retain and attract new investors, companies signal their performance disclosing more information to increase investor confidence (Biscotti & D’Amico, 2016; Ousama et al., 2012). However, this assumption has been questioned in a study whose results show a positive relationship among highly leveraged Australian firms (Whiting & Woodcock, 2011). Other authors defend that firms have incentives to disclose bad news, in order to avoid litigation costs. In addition, markets respond more strongly to bad news than to good news (Białek-Jaworska & Matusiewicz, 2015; Kothari, Shu & Wysocki, 2009).
Despite knowing the effects of corporate reporting explained by the previous four theories, due to the variety and breadth of different types of intangible assets, there is still a lack of an empirically proven relationship between extant theories and the results of studies on intangible assets (Castilla-Polo and Gallardo-Vásquez, 2016).
Determinants of Intangible Assets Disclosure
The terms intangible, intellectual capital and knowledge can be used to qualify the organisation’s resources capable of generating corporate earnings (Frederick, 2009; Mohd-Saleh & Rahman, 2009).
There is no consensus regarding the conceptualisation of intellectual capital, and several definitions have to be considered (Beattie & Thomson, 2007; Branco, Delgado, Sá & Sousa, 2010; Choong, 2008; Guthrie, Petty, Yongvanich & Ricceri, 2004). Intellectual capital is defined as the possession of professional knowledge and skills, experiences, good
ARTÍCULO ORIGINAL ACEPTADO
relationships and technological capacities which may generate competitive advantages for organisations when applied (Li et al., 2008). The majority of studies divide intellectual capital into three categories: structural capital, relational capital and human capital. These three categories can include a highly variable number of elements or sub-categories. For example, the study conducted by Whiting and Woodcock (2011) show that this number can vary between 18 and 25. In addition, Beattie and Thomson (2007) have identified 128 components of intellectual capital.
Nowadays, intangible investments seem to be one of the main corporate concerns in order to develop or maintain competitive advantages and enable future earnings growth (Li, Tsai & Lin, 2010). However, there are cases of intangible investments which are not recognised as assets (such as installation costs, research costs, training costs, promotion and marketing costs), but as costs. There are also other investments which are not reflected in companies’ financial statements, such as corporate culture, customer loyalty, employee satisfaction, experience and know-how.
According to IAS 38 – Intangible Assets, an intangible asset is presented as an identifiable, non-monetary asset, without physical substance. They can be controlled and used by a firm in its activity of producing goods and services, or for rental to third parties, or for administrative purposes, and as a source of potential future economic benefits.
The decision to disclose corporate information is very important and its practice is complex. It is influenced by both internal factors (which include company characteristics, such as firm size, industry, listing status and audit quality) and external factors (the environmental context in which the company operates, such as culture, the legal system and the institutional basis) (Cuozzo, Dumay, Palmaccio & Lombardi, 2017; Khlifi & Bouri, 2010).
One of the aims of our study is to identify the specific explanatory factors of intangible assets disclosure. There is vast literature on this topic. From the analysis of several studies addressing the issue of disclosure determinants, we have created a map of twenty studies (in Appendix 2) which allows the selection of factors influencing mandatory intangible assets disclosure: firm size, type of auditor, indebtedness, profitability, type of industry and foreign activity. These factors have been previously identified in a wide range of studies carried out by financial analysts and academics from around the world
ARTÍCULO ORIGINAL ACEPTADO
(Boubaker, Lakhal & Nekhili, 2012; Cooke,1989a; Cooke, 1992; Debreceny & Rahman, 2005; De Silva, Stratford & Clark, 2014; García-meca et al., 2005; Goebel, 2015; Lopes & Ferraz, 2016; Lopes & Rodrigues, 2007; Morariu, 2012; Oliveira et al., 2006; Ousama et al., 2012; Raffournier, 1995; Razak, Mohammad & Tobiagi, 2016; Tsalavoutas, 2011; Wallace et al., 1994; Whiting & Woodcock, 2011; Williams, 2001).
Hypotheses Development
Firm Size
Previous literature has found an association between firm size and disclosure level. (Boubaker et al., 2012; Branco et al., 2011; Cooke, 1989a; García-meca et al., 2005; Goebel, 2015; Lopes & Rodrigues, 2007; Macagnan, 2009; Oliveira et al., 2006; Orens, Aerts & Lybaert, 2009; Ousama et al., 2012; Raffournier, 1995; Wallace & Naser, 1995; Wallace et al.,1994).
The larger the firm size, the higher the need for information on the part of internal and external stakeholders (García-Meca et al., 2005). Agency theory predicts that larger companies are more subject to conflicts between managers and investors, implying more agency costs. To reduce these costs, companies are prone to disclose more information.
According to the studies conducted by Lopes and Rodrigues (2007) and Oliveira et al. (2006) another explanation for the link between firm size and disclosure is associated with political costs. Because political costs are higher in larger companies, they will present higher levels of disclosure to improve investor confidence and decrease political costs associated with their public visibility (Oliveira et al., 2006; Wallace et al., 1994).
Thus, a positive association is expected between firm size and the level of compliance with intangible assets disclosure requirements.
H1 – There is a positive association between firm size and the level of compliance with intangible assets disclosure requirements.
Type of Auditor
Previous empirical evidence has shown that auditing is a way of reducing agency costs and increase disclosure credibility (Ousama et al., 2012). Larger auditing firms (the Big Four) stimulate their customers to often disclose more information, either in volume or extent, to preserve their reputation, develop their own skills and ensure customer’s
ARTÍCULO ORIGINAL ACEPTADO
loyalty. In some aspects they function as agency monitoring mechanisms. To safeguard their reputation they recommend extended levels of disclosure capable of reducing agency costs and potential litigation costs. In fact there is empirical evidence on the statistically significant relationship between the size of the auditing firm and the financial information disclosed (Boubaker et al., 2012; Depoers, 2000; Lopes & Rodrigues, 2007; Oliveira et al., 2006; Raffournier, 1995; Tsalavoutas, 2011; Wallace & Naser, 1995; Whiting & Woodcock, 2011). However, there are studies that document the lack of a strong association (Morais & Fialho, 2008; Ousama et al., 2012; Wallace et al., 1994). Thus, according to agency theory companies are expected to disclose more information if they are audited by one of the Big Four auditing firms.
H2 - There is a positive association between the type of auditor and the level of compliance with intangible assets disclosure requirements.
Indebtedness
Agency theory is commonly used to explain the relationship between indebtedness and disclosure. According to several studies, highly indebted companies are more subject to higher risks, making it more urgent to reduce information asymmetry between shareholders and creditors, as they support higher agency costs (Kang & Gray, 2011; Macagnan, 2009; Orens et al., 2009; Tsalavoutas, 2011; Wallace & Naser, 1995; Williams, 2001). To reduce those costs, companies are stimulated to greater information disclosure, which, in turn, allows the decrease of borrowing/financing costs. On the other hand, signaling theory explains that companies with a low debt ratio are encouraged to disclose more information about their financial structure as a signal of good performance, reputation, and financial health. However, there is empirical evidence showing a lack of association between financial disclosure and debt (Oliveira et al., 2006; Ousama et al., 2012; Raffournier, 1995; Wallace et al., 1994; Whiting & Woodcock, 2011).
H3 - There is an association between indebtedness and the level of compliance with intangible assets disclosure requirements.
ARTÍCULO ORIGINAL ACEPTADO
There is empirical evidence that supports the hypothesis of a positive relationship between disclosure and firm performance. According to agency theory, disclosure serves as a control mechanism and managers are encouraged to disclose information to maintain their position and compensations. In turn, according to signaling theory, more profitable companies may have the incentive to disclose information to distinguish themselves from other companies and avoid shares undervaluation. Some papers demonstrate this positive relation, namely, the higher the company performance, the greater the information disclosure (Debreceny & Rahman, 2005; Macagnan, 2009; Ousama et al., 2012; Raffournier, 1995; Wallace & Naser, 1995). But this disclosure is limited to a certain profitability threshold level Verrecchia (1983), and they do not disclose information below that limit. However, other studies found opposite relationships between disclosure and profitability (Boubaker et al., 2012; Cooke, 1989a; García-meca et al., 2005; Oliveira et al., 2006).
H4 – There is an association between profitability and the level of compliance with intangible assets disclosure requirements.
Type of industry
Signaling, legitimacy and political costs theories can explain the relationship between disclosure and the type of industry. According to these theories, companies which belong to the same industry are interested in the same level of disclosure to avoid competitive pressures or a negative market reaction. There is a relationship between disclosure and the activity sector or type of industry because disclosure in itself is a way to legitimise an entity. Previous studies results demonstrate that this variable behavior varies from a positive association (Boubaker et al., 2012; Branco et al., 2011; Kang & Gray, 2011; Macagnan, 2009; Oliveira et al., 2006; Ousama et al., 2012; Williams, 2001) to any relationship between disclosure and the type of industry (Debreceny & Rahman, 2005; García-meca et al., 2005; Morariu, 2012; Wallace et al., 1994).
H5 - There is an association between the type of industry and the level of compliance with intangible assets disclosure requirements.
ARTÍCULO ORIGINAL ACEPTADO
There is empirical evidence showing that company managers who work with external markets control a greater amount of information because of the higher complexity of operations and the major number of stakeholders, so the amount of information required is also superior, even if these companies do not have their shares listed on foreign markets. Therefore, and according to signaling theory, managers that are responsible for external activities are more interested in higher levels of disclosure, so that investors can recognise the presence of the company in international markets. This kind of disclosure is thus considered a “good sign” (Cooke, 1989b; Depoers, 2000; Raffournier, 1995).
H6 - There is a positive association between the level of internationality and the level of compliance with intangible assets disclosure requirements.
Research Methodology
Sample selection and data collection
This study focuses on the level of compliance with the requirements of intangible assets disclosure outlined in NCRF6i, as well as its explanatory factors, for 2010 and 2011, using the annual reports collected from a population composed by the 500 largest Portuguese firms ranked by Exame Magazine in 2010, and which are subject to the new SNC. Company selection was based on the easiness of accessing and collecting data, namely annual reports, available on the company’s website. It was possible to collect data from the websites of 64 unlisted entities. We excluded a total of 13 companies, which had not published their 2011 annual report, 12 other companies, which had no information on intangible assets, and 2 other organisations which were not-for-profitable entities. Thus, our final sample consists of a total of 37 companies that have adopted the SNC.
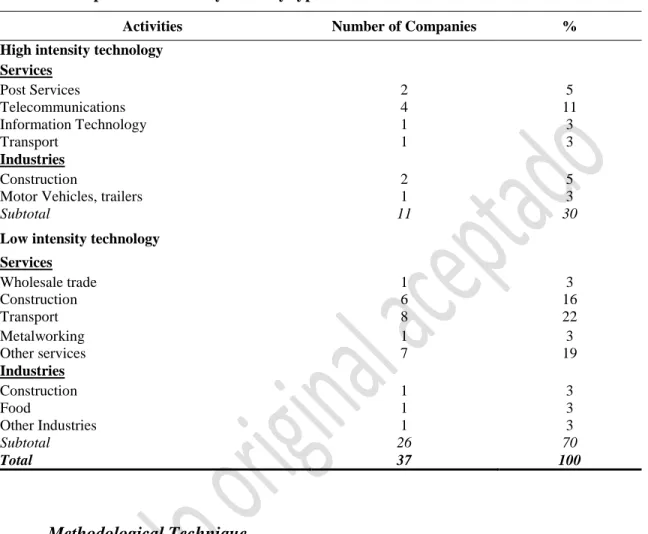
For a better sample characterisation, companies are organised by type of industry, based on the study of Oliveira et al. (2006) which used the European Union standard classification according to NACE Rev1 and the “2003 STI Scoreboard” from the Organization for Economic Co-operation and Development. However, there are other high-tech industries not included in the above classifications which invest heavily in R&D activities. Therefore, we have also included the list of companies with the highest spending on R&D, in 2010, published by the Direção-Geral de Estatísticas da Educação e Ciência (Mendonça, 2012). Table I presents our sample distribution by type of industry.
High-ARTÍCULO ORIGINAL ACEPTADO
technology companies make up for 30 percent of the sample and the remaining companies (70 percent) belong to low-technology or knowledge industry.
Table I – Sample distribution by industry type
Activities Number of Companies %
High intensity technology Services Post Services 2 5 Telecommunications 4 11 Information Technology 1 3 Transport 1 3 Industries Construction 2 5
Motor Vehicles, trailers 1 3
Subtotal 11 30
Low intensity technology Services Wholesale trade 1 3 Construction 6 16 Transport 8 22 Metalworking 1 3 Other services 7 19 Industries Construction 1 3 Food 1 3 Other Industries 1 3 Subtotal 26 70 Total 37 100 Methodological Technique
In accordance with previous research (Branco et al., 2010; Ferreira, 2008; Kateb, 2012; Li et al., 2008; Martins, 2012; Oliveira et al., 2006; Orens et al., 2009; Striukova et al., 2008), the methodological technique used to achieve the research objectives was the content analysis of financial statements and notes of the sampled companies for 2010 (transition year from POC to SNC) and 2011. Content analysis was done manually, as we searched for each intangible assets disclosure requirements.
Definition of Intangible Assets Disclosure Index
The content analysis used a codification instrument comprising 33 items of mandatory disclosure requirements. This list of disclosures was built through the analysis of disclosures recommended in paragraphs 117-123 of NCRF6. Regarding the disclosure
ARTÍCULO ORIGINAL ACEPTADO
requirements of intangible assets associated with business combination paragraphs 42, 47-49 of NCRF14 (Business Combinations) were also analysed. This codification instrument was used to perform the content analysis of the 2010 and 2011 financial statements and notes in order to construct a disclosure index. This disclosure index represents the dependent variable in our study and will assist all the research analysis.
Consistent with prior literature (Cooke, 1989a, 1989b; Raffournier, 1995; Williams, 2001), the disclosure index is a dichotomous variable that takes the value “1” if the company complies with the disclosure requirement and the value “0” otherwise. Judgmental procedures were adopted in the reading of all financial statements and notes, and cases of “Not Applicable” were not considered in our work. This allowed us to assess whether a particular item of disclosure was relevant to a particular company and it did not penalize nondisclosure (Cooke, 1992).
The index of intangible assets disclosure (IIAD) for each company included in the sample is calculated as follows:
IIAD = ∑ di / m
where, di = 0 (if the item i is not disclosed) or 1 (if the item i is disclosed) and di may vary between 1 and m = maximum number of company disclosed items (33).
Definition of the Explanatory Factors of Disclosure
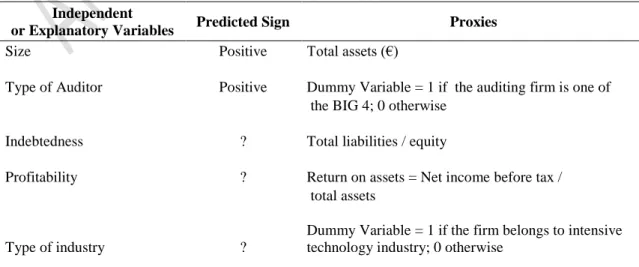
Consistent with our hypotheses, Table II summarises the independent or explanatory variables included in our econometric model, the proxies used and predicted signs for the relationship between each variable and the disclosure index.
Table II –Independent or explanatory variables, proxies and expected sign
Independent
or Explanatory Variables Predicted Sign Proxies
Size Positive Total assets (€)
Type of Auditor Positive Dummy Variable = 1 if the auditing firm is one of the BIG 4; 0 otherwise
Indebtedness ? Total liabilities / equity
Profitability ? Return on assets = Net income before tax / total assets
ARTÍCULO ORIGINAL ACEPTADO
Internationality Positive Ratio = Exports / total sales
Estimation Model
The estimation model will test if the determinant factors influence the level of compliance with the intangible assets mandatory requirements provided by NCRF 6:
IIADjt = 0 + 1 Sizejt + 2 Type of Auditorjt + 3 Indebtednessjt + 4 Profitabilityjt + 5 Type of Industryjt + 6 Internationalityjt + it,
where t = 2010, 2011 and j = 1, 2, …, n=37
Presentation and Discussion of the Results
Descriptive Analysis
Table III presents two kinds of results for each year of analysis: the percentage of companies that disclose a particular item (number of companies that disclose each item / total number of companies = 37) and the mean value for each disclosure item (number of disclosures for each item per year / total of items disclosed per year = 22).
ARTÍCULO ORIGINAL ACEPTADO
Ite m
Mandatory Disclosure Requirements of IA
2011 2010
% of companies disclosing items
Disclosure Mean for Each Item
% of companies disclosing items
Disclosure Mean for Each
Item
1 Is there separate disclosure of separately acquired assets and internally generated assets? 0.811 0.038 0.784 0.037 2 Periods of useful life for each class of intangible
asset: 0.919 0.043 0.892 0.042
3 Finite? 0.919 0.043 0.919 0.043
4 Amortization Rates 0.811 0.038 0.757 0.036 5 Amortization Methods 0.892 0.042 0.865 0.041 6 Gross carrying amount and any accumulated
amortization at the beginning and end of the period 0.946 0.044 0.892 0.042
7 Indefinite? 0.054 0.003 0.054 0.003
8 Carrying amount 0.054 0.003 0.054 0.003 9
The reasons that justify the assessment of an indefinite useful life and detailed description of significant factors
0.027 0.001 0.027 0.002
10 Is there any reconciliation of the carrying
amount at the beginning and end of the period? 0.054 0.002 0.054 0.003 11
Is there a description, display of the carrying amount, and the remaining period for individual intangible assets considered materially relevant?
0.027 0.001 0.027 0.002
Intangible assets acquired in a business
combination:
12 Description of the factors contributing to a cost which results in goodwill recognition 0.000 0.000 0.000 0.000 13 Description of each intangible asset which was
not recognized separately from goodwill 0.000 0.000 0.000 0.000 14
Explanation of the reasons that made the measurement of intangible assets by fair value impossible
0.000 0.000 0.000 0.000
15 Description of the origin of any excess
recognized in the income statement 0.000 0.000 0.000 0.000 16 Description of information which enables users
to evaluate changes in carrying amount of goodwill 0.108 0.005 0.108 0.006 17 Is there a reconciliation of RA of goodwill at
the beginning and end of the period? 0.162 0.008 0.162 0.008 18 Is there information about the recoverable
amount and goodwill impairment? 0.108 0.004 0.108 0.004 Intangible assets acquired by a government grant: 19 Initially recognized by a nominal amount 0.000 0.000 0.000 0.000 20 Initially recognized by fair value 0.054 0.003 0.081 0.004 21 Is initially recognized fair value disclosed? 0.054 0.003 0.081 0.004 22 Is the carrying amount disclosed? 0.054 0.003 0.081 0.004 23 Subsequent Measurement Model: 0.027 0.001 0.054 0.003 24 Cost Model 0.027 0.001 0.054 0.003 25 Revaluation Model 0.000 0.000 0.000 0.000 26
Identification of intangible assets and their carrying amounts whose ownership is restricted or have been given as collateral for liabilities
0.027 0.001 0.027 0.002
27 Description of contractual commitments
amounts for the acquisition of intangible assets 0.054 0.003 0.027 0.002
The company adopts the revaluation model and for
each intangible assets class discloses the following: 28 Date of the revaluation effect 0.000 0.000 0.000 0.000 29 Revalued intangible assets 0.000 0.000 0.000 0.000 30
The registered amount that would be recognized if revalued intangible assets were measured after recognition using cost model
0.000 0.000 0.000 0.000
31
The amount of revaluation surplus related to intangible assets at the beginning and end of the period, and subsequent changes
0.000 0.000 0.000 0.000
32 Methods and significant assumptions applied in
estimating fair value of assets 0.000 0.000 0.000 0.000
ARTÍCULO ORIGINAL ACEPTADO
Findings from Table III reveal that regarding business combinations companies do not disclose the following information: a) the factors that make up the goodwill recognized; b) intangible assets that do not qualify for separate recognition; c) the reasons that made the measurement of intangible assets at fair value impossible; and d) the description of the nature of any surplus recognized in the income statement. On this subject companies only present information on changes in the carrying amount of goodwill, including a reconciliation of the carrying amount at the beginning and end of the reporting period, the disclosure of its recoverable amount, and impairment of goodwill.
Companies do not use the revaluation model to measure their intangible assets. On the other hand, most common disclosures relate to information on the useful lives (2010: 0.892; 2011: 0.919), amortization rates (2010: 0.757; 2011: 0.811), amortization methods (2010: 0.865; 2011: 0.892), and gross carrying amounts and any accumulated amortization at the beginning and end of the reporting period (2010: 0.892; 2011: 0.946), associated with intangible assets with finite lives.
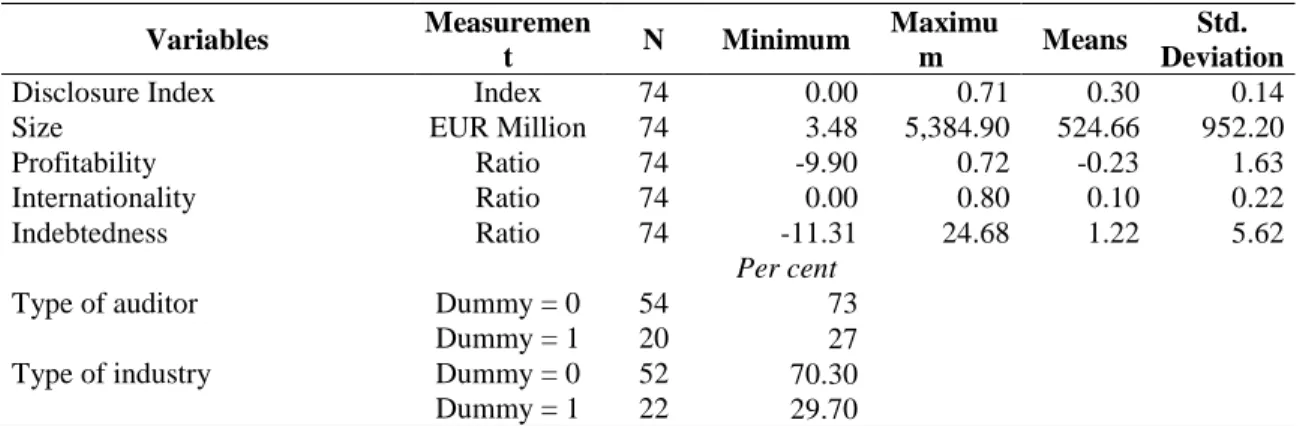
Table IV reports the descriptive statistics for the dependent and independent variables.
Results indicate that:
Companies, on average, have an index of intangible assets disclosure of 0.3. In other words, on average, companies comply with 0.3 of intangible assets mandatory disclosure requirements. At least one company shows no results for intangible assets disclosure and the maximum level of intangible assets disclosure is 0.71; 33 Is the aggregate amount of research and
development expenditure recognized as an expense? 0.135 0.006 0.135 0.007
Table IV – Descriptive Statistical Analysis
Variables Measuremen t N Minimum Maximu m Means Std. Deviation
Disclosure Index Index 74 0.00 0.71 0.30 0.14
Size EUR Million 74 3.48 5,384.90 524.66 952.20
Profitability Ratio 74 -9.90 0.72 -0.23 1.63
Internationality Ratio 74 0.00 0.80 0.10 0.22
Indebtedness Ratio 74 -11.31 24.68 1.22 5.62
Per cent
Type of auditor Dummy = 0 54 73
Dummy = 1 20 27
Type of industry Dummy = 0 52 70.30
ARTÍCULO ORIGINAL ACEPTADO
The average value of total assets is approximately EUR 525 million, although there is a wide value variation in this variable (about EUR 5,381 million);
Return on assets varies between a minimum value of 9.90 negative and a maximum of 0.79 positive. The mean value for Return on assets is 0.23 negative. This result is a consequence of including in our sample companies with a negative net income before tax (twelve in 2011 and ten in 2010). As mentioned in their annual reports this low level of financial performance is a consequence of the period of financial crisis companies faced in 2010 and 2011, both at national and international levels;
The average value for Internationality variable is 0.1, meaning that foreign activities for the sampled companies represent 0.1 of their turnover. The Internationality variable goes from zero to 0.8;
The Indebtedness variable varies between -11.31 and +24.68. But, on average, debt capital exceeds equity by 1.22;
It can also be noted that only 0.27 of companies are audited by one of the BIG4 auditing firms and approximately 0.3 of companies belong to intensive technology or knowledge industry.
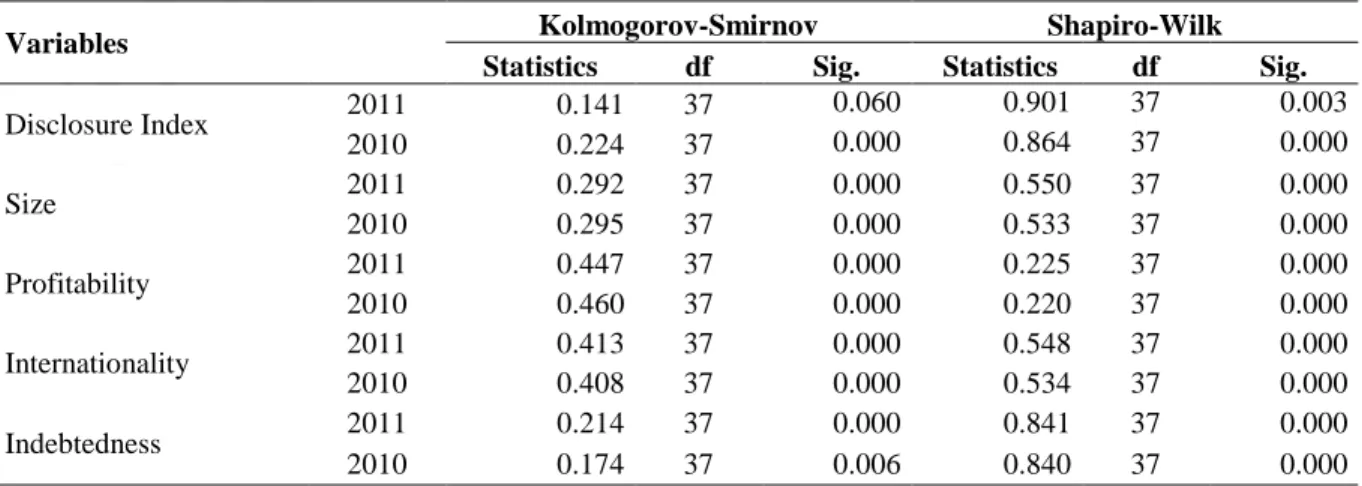
Normality Statistical Analysis
Table V shows if the continuous dependent and independent variables follow a normal distribution.
Table V – Normality Statistical Analysis
Variables Kolmogorov-Smirnov Shapiro-Wilk
Statistics df Sig. Statistics df Sig.
Disclosure Index 2011 0.141 37 0.060 0.901 37 0.003 2010 0.224 37 0.000 0.864 37 0.000 Size 2011 0.292 37 0.000 0.550 37 0.000 2010 0.295 37 0.000 0.533 37 0.000 Profitability 2011 0.447 37 0.000 0.225 37 0.000 2010 0.460 37 0.000 0.220 37 0.000 Internationality 2011 0.413 37 0.000 0.548 37 0.000 2010 0.408 37 0.000 0.534 37 0.000 Indebtedness 2011 0.214 37 0.000 0.841 37 0.000 2010 0.174 37 0.006 0.840 37 0.000
ARTÍCULO ORIGINAL ACEPTADO
Results from Table V show that both dependent and independent variables do not follow a normal distribution (p-value < 0.05).
Analysis of Differences in Means
Table VI reports the results on the analysis of differences in means of both continuous dependent and independent variables between the two years of analysis: 2010 and 2011. Since these variables do not follow a normal distribution, we used nonparametric tests of Mann-Whitney U.
Table VI – Means Differences Analysis
Variables Mean Mann-Whitney
U Wilcoxon W Z Asymp. Sig. (2-tailed) 2010 2011 Disclosure Index 0.301 0.296 662.00 1,365.00 -0.245 0.807 Size 522.339 526.986 680.00 1,383.00 -0.049 0.961 Profitability -0.222 -0.238 640.50 1,343.50 -0.476 0.634 Internationality 0.101 0.104 682.00 1,385.00 -0.035 0.972 Indebtedness 1.201 1.235 673.00 1,376.00 -0.124 0.901
Results indicate that between the two years there are no statistically significant differences in all dependent and independent variables (p-value > 0.05). This suggests that potential endogeneity problems are minimal.
Correlation Analysis
The pairwise correlation coefficients among dependent and independent variables are presented in Table VII.
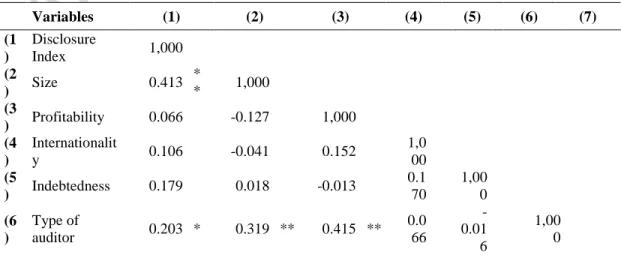
Table VII – Correlation Analysis
Variables (1) (2) (3) (4) (5) (6) (7) (1 ) Disclosure Index 1,000 (2 ) Size 0.413 * * 1,000 (3 ) Profitability 0.066 -0.127 1,000 (4 ) Internationalit y 0.106 -0.041 0.152 1,0 00 (5 ) Indebtedness 0.179 0.018 -0.013 0.1 70 1,00 0 (6 Type of 0.203 * 0.319 ** 0.415 ** 0.0 -0.01 1,00
ARTÍCULO ORIGINAL ACEPTADO (7 ) Type of industry 0.167 0.041 0.301 ** 0.1 47 -0.04 9 0.25 7 * 1,00 0 Correlations statistically significant at a significance of: **0.01 e *0.05
Results indicate that the disclosure index is positively and significantly correlated with size (p-value < 0.01) and with type of auditor (p-value < 0.05). These preliminary results seem to corroborate hypotheses H1 and H2. Results also indicate that the disclosure index is not correlated with profitability, internationality, indebtedness, and type of industry. Among independent variables the correlation coefficient is low, indicating that multicollinearity problems are minimal.
Regression Analysis
To test our hypotheses we used an OLS multiple regression analysis. As the dependent and independent variables do not follow a normal distribution, they were transformed into normal scores using Blom’s method, as recommended by Cooke (1988). Model assumptions were checked for outliers, autocorrelation, multicollinearity, heteroscedasticity and normality of residuals.
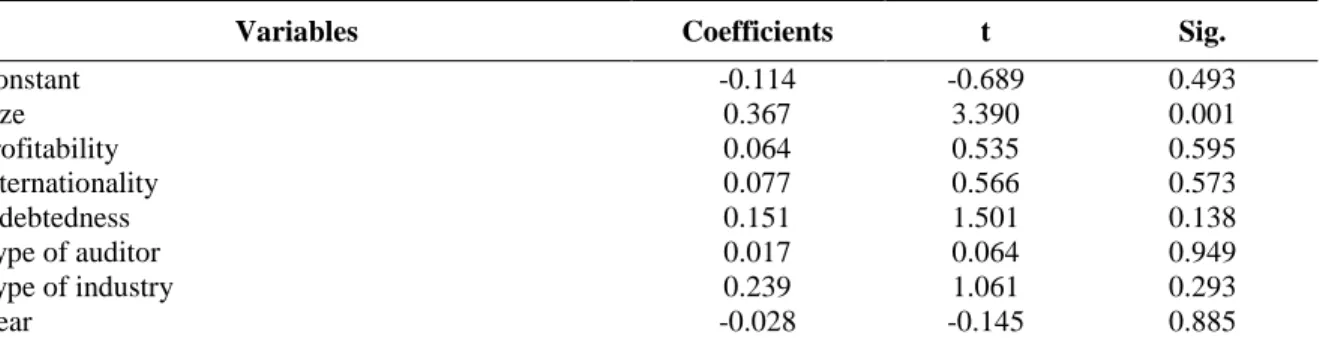
Table VIII shows the regression analysis results. The estimation model is statistically significant (F = 2.766; p-value < 0.05). The adjusted R2 of 0.15 indicates that the explanatory power of independent variables for the variation of intangible assets disclosure is 15%.
Discussion
Table VIII results show a statistically significant positive association between the level of intangible assets disclosure and company size (p-value < 0.01).
Table VIII - Regression Analysis
Variables Coefficients t Sig.
Constant -0.114 -0.689 0.493 Size 0.367 3.390 0.001 Profitability 0.064 0.535 0.595 Internationality 0.077 0.566 0.573 Indebtedness 0.151 1.501 0.138 Type of auditor 0.017 0.064 0.949 Type of industry 0.239 1.061 0.293 Year -0.028 -0.145 0.885
ARTÍCULO ORIGINAL ACEPTADO Adjusted model: R2 0.235 Adjusted R2 0.150 F 2.766 0.014 Durbin Watson 1.093
Therefore, hypothesis H1 is supported. Larger companies in our sample are more likely to comply with more intangible assets disclosure requirements. This result corroborates previous literature studies (Cooke, 1989a, 1989b, 1992; García-Meca et al., 2005; Goebel, 2015; Lopes & Rodrigues, 2007; Oliveira et al., 2006). According to agency theory, larger firms tend to have higher agency costs, so they need to disclose more information to reduce those costs. These results are also consistent with legitimacy theory, which argues that larger firms disclose more information to legitimate their activities and to manage stakeholder perceptions concerning image and reputation because they are more watched by the public. These results are also supported by political costs theory: the larger the size of the company, the higher the political costs, leading companies to disclose more information to reduce those costs.
Results also indicate that the level of intangible assets disclosure is not statistically associated (p-value > 0.05) with the type of auditor, indebtedness, profitability, type of industry and internationality. The hypothesis H2 is rejected, meaning that the intangible assets disclosure index and the type of auditor are not associated. Other previous studies have also highlighted that lack of relationship (Ousama et al., 2012; Wallace et al., 1994). One of the possible reasons for the present study results seems to be the fact that only 27 % of the companies in our sample are audited by one of the Big 4.
The hypothesis H3 of this study predicted a relationship between the disclosure index and indebtedness, which is not supported, as in other studies (García-meca et al., 2005; Lopes & Rodrigues, 2007; Oliveira et al., 2006; Ousama et al., 2012; Raffourmier, 1995; Wallace et al., 1994; Whiting & Woodcock, 2011). Our findings seem to confirm that the most common funding mechanism of Portuguese companies (even those which are listed on the Portuguese stock exchange market) is bank loans at the expense of financing in the securities market. It is also known that banks access company information through annual reports or by direct contact between companies and bank managers, which provide additional information for a better perception of company risks. Therefore, a higher or
ARTÍCULO ORIGINAL ACEPTADO
lower indebtedness level seems not to influence disclosure, because there are other ways to obtain financial information beyond the traditional financial reporting mechanisms.
The hypothesis H4 is also rejected. The disclosure index and profitability are not associated. This result is consistent with some previous studies (Cooke, 1989a; García-meca, et al., 2005; Morais & Fialho, 2008; Oliveira et al., 2006; Wallace et al., 1994) but also contradicts others (Debreceny & Rahman, 2005; Ousama et al., 2012; Raffournier, 1995; Wallace & Naser, 1995). In line with Verrecchia (1983), the lack of a possible relationship may be due to the existence of a threshold below which companies do not find incentives to disclose information. Thus, companies in our sample are likely to be below the profitability threshold.
The hypothesis H5 is not supported. The lack of a relationship between the disclosure index and the type of industry is sustained by previous literature (Debreceny & Rahman, 2005; García-meca, et al., 2005; Morais & Fialho, 2008; Morariu, 2012; Wallace et al., 1994). However, some studies show the opposite (Lopes & Rodrigues, 2007; Oliveira et al., 2006; Raffournier, 1995; Wallace & Naser, 1995). These results can be attributed to various factors, such as the type of industry (higher knowledge or technology intensive sectors represent only 30% of the sample).
Finally, the hypothesis H6 is not supported. The disclosure index is not associated with the company’s internationality. This finding is consistent with previous literature (Lopes & Rodrigues, 2007; Oliveira et al., 2006).
Conclusion, limitations and future research
This study analyses the degree of compliance with intangible assets mandatory disclosure requirements outlined in paragraphs 177 to 123 of NCRF 6 (Intangible Assets) and paragraphs 42, 47-49 of NCRF14 (Business Combinations) regarding the intangible assets acquired in business combinations for the years 2010 (normative transition year) and 2011. Based on the content analysis of annual reports available on the websites of 37 companies included in the 500 largest Portuguese companies list published by Exame Magazine, 2010, we have calculated an index of intangible assets disclosure with 33 items of disclosure requirements. Results are expected to show an increase in disclosure level
ARTÍCULO ORIGINAL ACEPTADO
from 2010 to 2011. However, results do not confirm this expectation, since the index for intangible assets disclosure shows a mean of 30% in both years.
Hypothesis development was based on previous literature, which is diverse and varied, and on disclosure theories, such as agency, signaling, legitimacy and political costs theories. The results show that only size presents a statistically significant positive influence on intangible assets disclosure index and indicates that larger firms disclose more information on intangible assets to reduce agency costs, to avoid political costs associated with their public visibility, or even to mitigate non-compliance costs related to their organizational legitimacy agenda, and therefore manage stakeholders perceptions on their corporate image and reputation. All the other independent variables (type of auditor, profitability, type of industry, indebtedness and internationality) have no significant relationship with the disclosure index, that is, they are not explanatory factors for intangible assets disclosure.
As mentioned above, the mean value of intangible assets disclosure is a relatively low value (30%) since the target of this study is mandatory disclosure. This may be due to the fact that managers and accounting professionals from the sample companies are not yet fully endowed with the skills required by the new SNC standards, regarding intangible assets. In addition, managers and accounting professionals may not be aware of the recognition, accountability and disclosure of intangible assets benefits. Moreover, they may have a perception of disclosure as a source of competitive disadvantage and information costs.
The results of this study should be interpreted taking the following limitations into consideration. The first limitation is related to the small sample size, which is due to disclosure channel choices. We have selected companies which chose to disclose their annual reports on their websites, since it is easier to access information. The second limitation is related to the inherent subjectivity in the manual use of content analysis methodological technique that allowed the construction of a disclosure index from the reading and subsequent encoding of information. The two-year period under review is another limitation, as it does not allow the conjecture of disclosure increments. It will be necessary to carry out further long-term research, which was impossible in our study, since the study was based on data available for 2010 and 2011 exclusively. The fourth, and
ARTÍCULO ORIGINAL ACEPTADO
perhaps the most important limitation, is the selection of independent or explanatory variables and proxy variables used in this model, as the result of 15% for the Adjusted R2 shows that there may be other explanatory factors for intangible assets disclosure that are not included in this model.
This study is the first intrepid step to understand the phenomenon of mandatory disclosure of intangible assets in Portugal. The four limitations identified above should be regarded as future research opportunities on intangible assets disclosure.
References
Abeysekera, I., & Guthrie, J. (2005). An empirical investigation of annual reporting trends of intellectual capital in Sri Lanka. Critical Perspectives on Accounting, 16(3), 151-163. doi:10.1016/S1045-2354(03)00059-5
Alberti-Alhtaybat, L., Hutaibat, K., & Al-Htaybat, K. (2012). Mapping corporate disclosure theories. Journal
of Financial Reporting and Accounting, 10(1), 73-94. doi:10.1108/19852511211237453
André, P., Dionysiou, D., & Tsalavoutas, I. (2017). Mandated Disclosures Under IAS 36 Impairment of Assets and IAS 38 Intangible Assets: Value Relevance and Impact on Analysts’ Forecasts. Applied
Economics, Forthcoming. Available at SSRN: https://ssrn.com/abstract=2982297
April, K., Boonia, P., & Deglon, D. (2003). Intellectual Capital measurement and reporting: establishing a practice in South African inning. Journal of Intellectual Capital, 4(2):165-180.
doi.org/10.1108/14691930310472794
Beattie, V., & Thomson, S. (2007). Lifting the lid on the use of content analysis to investigate intellectual capital disclosures. Accounting Forum, 31(2), 129-163. doi.org/10.1080/0969160X.2013.766417 Białek-Jaworska, A., & Matusiewicz, A. (2003). Determinants of the level of information disclosure in
financial statements prepared in accordance with IFRS. Accounting and Management Information
Systems, (14)3, 453-482.
Biscotti, A., & D’Amico, E. (2016). What are political leaders' environmental intentions? The impact of social identification processes and macro-economic conditions. Ecological Economics, 129, 152– 160.doi.org/10.1016/j.ecolecon.2016.06.004
Boubaker S., Lakhal, F., & Nekhili, M. (2012). The determinants of web-based corporate reporting in France.
Managerial Auditing Journal, 27(2), 126-155. doi:10.1108/02686901211189835
Bozzolan, S., Favotto, F., & Ricceri, F. (2003). Italian Annual Intellectual Capital Disclosure: An Empirical Analysis. Journal of Intellectual Capital, 4(4), 543-58.
Branco, M., Delgado, C., Sá, M., & Sousa, C. (2010). An analysis of intellectual capital disclosure by Portuguese companies. EuroMed Journal of Business, 5(3), 258-278. doi:10.1108/14502191011080809
Branco, M., Delgado, C., Sousa, C., & Sá, M. (2011). Intellectual capital disclosure media in Portugal.
Corporate Communications:An International Journal, 16(1), 38-52.
doi:10.1108/13563281111100962
Brennan, N. (2001). Reporting Intellectual Capital in Annual Reports: Evidence from Ireland. Accounting,
Auditing and Accountability Journal, 14(4), 423-436). doi.org/10.1108/09513570110403443 Canibano, L. (2018). Accounting and Intangibles, Revista de Contabilidad, 21(1), 1-6.