ASSOCIAÇÃO DE POLITÉCNICOS DO NORTE (APNOR)
INSTITUTO POLITÉCNICO DE BRAGANÇA
Intangible assets, influence on the
“
return on equity
”
- evidence
from S&P 100 Index
Jair Alejandro García y García
Final Dissertation submitted to
Instituto Politécnico de Bragança
To obtain the Master Degree in Management, Specialization in Business
Management
Supervisors:
Prof. Doutor Jose Carlos Lopes
Prof. Vladimir Zefirov
ASSOCIAÇÃO DE POLITÉCNICOS DO NORTE (APNOR)
INSTITUTO POLITÉCNICO DE BRAGANÇA
Intangible assets, influence on the
“
return on equity
”
- evidence
from S&P 100 Index
Jair Alejandro García y García
Supervisors:
Prof. Dr. Jose Carlos Lopes
Prof. Vladimir Zefirov
i
Abstract
In the 21st century, the most valuable strategic resources for business enterprises will no longer be physical assets such as land and machines, as was the case at the beginning of the 20th century, but rather intangible assets (IA) such as knowledge, patents, and intellectual property rights. This shift responds to a transition towards a knowledge-based economy (Ipate & Pârvu, 2016; Park, 2015). Nowadays, as companies are acquiring and developing more non-physical assets, the question arises: what is the effect of IA in companies’ performance? Therefore, this study aims to analyze the effect of IA (exclusively those that are recognized and shown in the balance sheet) on the return on equity (ROE). In order to analyze the influence of IA on ROE, the study used components of the Standard and Poor 100 Index (S&P100). The S&P100 index comprises 101 companies across multiple industry groups; however, due to the research restrictions, only 68 companies were selected as the study’s sample. The Three-Step DuPont Model, comprising of three factors - net profit margin, asset turnover and equity multiplier - was used to analyze the effect of IA on ROE. For the research purposes, the Dupont model was modified to isolate IA. The analysis was done using book and market values for the dependent variable. The research results were obtained using the Ordinary Least Square (OLS) method. According to our findings, with ROE at book value the influence of IA on ROE is 34% excluding goodwill and 31% including goodwill. At market value, the influence of IA on ROE is almost 20%. Additionally, the results indicated a significant gap between the financial Information and the market assessment of shareholders equity.
ii
Resumo
No século XXI, os recursos estratégicos mais valiosos para as empresas não serão mais os ativos físicos, como a terra e as máquinas, como ocorreu no início do século XX (Bratianu, 2017), mas sim os ativos intangíveis (AI), como o conhecimento, patentes e direitos de propriedade intelectual. Este comportamento corresponde a uma transição para uma economia baseada no conhecimento (Ipate & Pârvu, 2016; Park, 2015). Atualmente, as empresas vêm adquirindo e desenvolvendo cada vez mais ativos intangíveis, o que faz surgir a questão de qual é o efeito destes ativos no desempenho das empresas. Este estudo considera os AI relevantes para o desempenho das empresas, no entanto, tem como objetivo analisar o efeito dos AI reconhecidos contabilisticamente nos balanços das empresas sobre a rentabilidade dos capitais próprios (ROE). Para analisar a influência dos AI no ROE, o estudo utilizou um conjunto de empresas pertencentes ao índice “Standard &Poor 100” Index (S&P100). O índice S&P100 é composto por 101 empresas de vários sectores de atividade; no entanto, devido aos requisitos do estudo, apenas 68 empresas foram selecionadas para comporem a amostra. O modelo de três etapas DuPont foi utilizado para analisar o efeito dos IA no ROE. O modelo inclui três fatores: a rentabilidade das vendas, a rotação dos ativos face às vendas (vendas/ativo total) e a relação do ativo total face aos capitais próprios (ativo total/capital próprio). O referido modelo foi modificado para introduzir como fator os AI e foram utilizados valores contabilísticos e valores de mercado na variável dependente. O método dos mínimos quadrados foi utilizado na análise. Os resultados obtidos demostram uma influência de 34% dos AI no ROE, utilizando valores contabilísticos, das empresas quando o goodwill esta a ser excluído e dum 31% quando está o goodwill incluído, , e uma influência de 20% dos AI no ROE, utilizando valores de mercado e excluindo o goodwill. Por outro lado, os resultados indicam um desfasamento significativo em termos contabilísticos e de mercado na avaliação no âmbito do ROE.
Palavras-chave: Ativos intangíveis, retorno sobre o património, economia do conhecimento, valor de
iii
Resumen
En el siglo XXI, los recursos estratégicos más valiosos para las empresas comerciales ya no serán los activos físicos como la tierra y las máquinas, como fue el caso a principios del siglo XX, más bien activos intangibles (AI) como el conocimiento, patentes y derechos de propiedad intelectual, este comportamiento responde a la transición hacia una economía basada en el conocimiento (Ipate & Pârvu, 2016; Park, 2015). Hoy en día, las empresas están adquiriendo y desarrollando más activos no físicos, entonces surge una pregunta: ¿cuál es el efecto de los AI en el desempeño de las empresas? Por lo tanto, este estudio tiene como objetivo analizar el efecto de los AI (exclusivamente aquellos que se reconocen y muestran en el balance general) en el rendimiento del capital (ROE). Con el fin de analizar la influencia de los AI en el ROE, el estudio utilizó empresas que componen en el índice Standard and Poor 100 (S & P100). El índice S&P 100 comprende 101 compañías en múltiples grupos
industriales; sin embargo, debido a los requisitos del estudio solo fueron seleccionadas 68 empresas como muestra para este estudio. El modelo de tres pasos de DuPont se usó para analizar el efecto de AI en el ROE. El modelo comprende tres factores: el margen de beneficio neto, la rotación de activos y el multiplicador del patrimonio. Para fines de esta investigación el multiplicador del patrimonio fue modificado para aislar los AI. El análisis fue realizado usando el valor en libros y el valor de mercado para las variables dependientes. Los resultados de esta investigación fueron obtenidos usando el método del Mínimo Cuadrado Ordinario (MCO). En concordancia con nuestros hallazgos, la influencia de los AI en el ROE es del 34% excluyendo el goodwill (fondo de comercio) y 31% incluyendo el goodwill (fondo de comercio), cuando el ROE utiliza el valor en libros; cuando el ROE utiliza el valor del mercado la influencia de los AI es cerca del 20%. Adicionalmente, los resultados también mostraron una brecha significativa entre la información financiera y la valuación de mercado en el capital.
Palabras clave: Activos intangibles, rentabilidad de los fondos propios, economía del conocimiento,
iv
v
Acknowledgements
First and foremost, I would like to thank the International Credit Mobility Programme (ICM ERASMUS+) for providing me with a scholarship to carry out my studies in Instituto Politécnico de Bragança and giving me an opportunity to undertake a double degree program.
vi
Abbreviations and Acronyms
BV Book Value
FAS Financial Accounting Standard
FASB Financial Accounting Standards Board FL Financial leverage book value
IA Intangible Assets IAR Intangible Assets Ratio
IARg Intangible assets ratio plus goodwill IAS International Accounting Standard
IASB International Accounting Standards Board IAT Intangible assets turnover
IATg Intangible assets turnover plus goodwill IFRS International Forms of Reporting Standards
KE Knowledge-based Economy
MV Market Value
OLS Ordinary Least-Squares
PM Profit margin
vii
Table of Contents
List of Tables ... viii
List of Figures ... viii
Introduction ... 1
1. Literature Review ... 2
1.1. Intangible Assets ... 2
1.2. Return on Equity ... 11
2. Methodology ... 13
2.1. Objective of the Study ... 13
2.2. Data and Sample ... 13
2.3. Methods ... 15
2.3.1. DuPont... 15
2.3.2. Ordinary Least Squares (OLS) ... 19
3. Empirical Results ... 22
3.1. Descriptive Statistical Analysis ... 22
3.2. Pearson Correlation ... 24
3.3. OLS Regression Analysis Results ... 26
3.4. Accounting Versus Market Value ... 30
Conclusions, Limitations and Future Research Lines ... 32
References ... 34
viii
List of Tables
Table 1. Previous studies on IA using cross-sectional analysis. ... 9
Table 2. Description of all variables, book value. ... 17
Table 3. Description of all variables, market value. ... 18
Table 4. Descriptive statistics of all variables. ... 23
Table 5.Results of Pearson correlation for both sets. ... 25
Table 6. Results of Pearson correlation for both sets, including goodwill. ... 25
Table 7. Results of the OLS analysis of book value... 26
Table 8. Results of the OLS analysis of book value, including goodwill. ... 27
Table 9. Results of the OLS analysis of market value. ... 28
Table 10. Results of the OLS analysis of market value, including goodwill. ... 29
Table 11. OLS comparison between sets, excluding goodwill. ... 30
List of Figures
Figure 1. Global Enterprise Value - Absolute Breakdown ... 41
Introduction
At the beginning of the 20th century, physical assets such as land and machines were the predominant form of resources (Bratianu, 2017). However, in the 21st century these have been progressively displaced by intangible assets such as knowledge, patents, and intellectual property rights. This trend corresponds to the shift to a knowledge-based economy (Ipate & Pârvu, 2015; Park, 2015). Nowadays, companies are acquiring and develop more non-physical assets. Therefore, a question arises – what is the effect of the intangible assets in companies’ performance? A study performed by Aboody and Lev (2000) shows that companies who had intense research and development programs (R&D) obtained bigger gains than those without them. Considering the relevance of the issue, this research aims to study the influence of the Intangible Assets (IA) - exclusively those that are recognized and showed in the balance sheet - on the Return on Equity (ROE). Due to the accounting segregation of the IA and the goodwill, the analysis considers both IA and “IA including goodwill”. Therefore, the main research question can be stated as follows: what is the influence of IA (recognized in the balance sheet) on companies’ performance, and, in particular, on the return on equity? In order to answer the question, five operational objectives were established: i) Analyze the impact of IA on ROE, measured at book values, ii) Analyze the impact of “IA, including goodwill”, on ROE, measured at book values, iii) Analyze the impact of IA on ROE, measured at market values, iv) Analyze the impact of “IA including goodwill” on ROE, measured at market values and v) Compare the results of book and market values approaches. In order to analyze the influence of the IA on ROE, the study is based on a group of companies that are components of Standard and Poor 100 Index (S&P100). The S&P100 index comprises 101 companies across multiple industry groups; however, due to the requirements established for this project, only 68 companies were selected as the study’s sample. The Three-Step Dupont Model, which lies in a broken form of Return on Equity (ROE) original formula, is used as a starting point. The model comprises the three following factors: net profit margin, asset turnover and equity multiplier. For the study purposes the equity multiplier was modified to isolate the intangible assets, obtaining a modified version of the Dupont model. Next, the Ordinary Least Square (OLS) was used to analyze the impact of the intangible assets (recognized in the balance sheet) over the return equity.
2
1. Literature Review
The following will first define the concepts of IA and ROE before presenting the relevant literature regarding intangibles and equity returns. Then the study looked for literature regarding IA, in specific for articles and studies where the effects of intangible resources on the company’s returns were the objective.
The following method were used in conducting the relevant research: an exploration was performed on B-On, EBSCO, Research Gate, Taylor & Francis and Web of Science online databases. The keywords looked for were: "Intangible Assets", "Return on Equity", "Results on Equity", “Intangibles Tax Treatment” and "Intangibles and Equity". Though there is a substantial amount of information available, included in the following review are only those articles and studies most relevant to the study’s main goal: to analyze the impact of the intangibles on the return on equity.
1.1. Intangible Assets
3
by several organizations such as the Appraisal Institute, the American Society of Appraisers, the USA Internal Revenue Service or the International Valuation Standards Council, in addition many jurisdictions define IA in local law (Understanding Intangible Assets and Real Estate: A Guide for Real Property Valuation Professionals, 2016). This standard outlines the recognition, valuation and disclosure of IA on
financial statements. Additionally, the IAS 38 provides the scope were the IA are to be found. The issue of this standard was in responds to the demand of an international demand on recognizing intangible resources. This demand came along with the surge of the Knowledge -based Economy (KE) The IA gained more importance after the surge of the KE. Aligned to the globalized economy, this microeconomic model is focused on intangible resources such as expertise, patents, data and information (Bratianu, 2017; Carrillo, 2015). This economy framework is stimulating firms to drive their business from massive production processes to fostering knowledge that produces innovative and cutting-edge products. Furthermore, this framework promotes a change in businesses’ sources of value pivoting to intangibles (Pucci, Simoni, & Zanni, 2015). KE is habitually associated with technological,
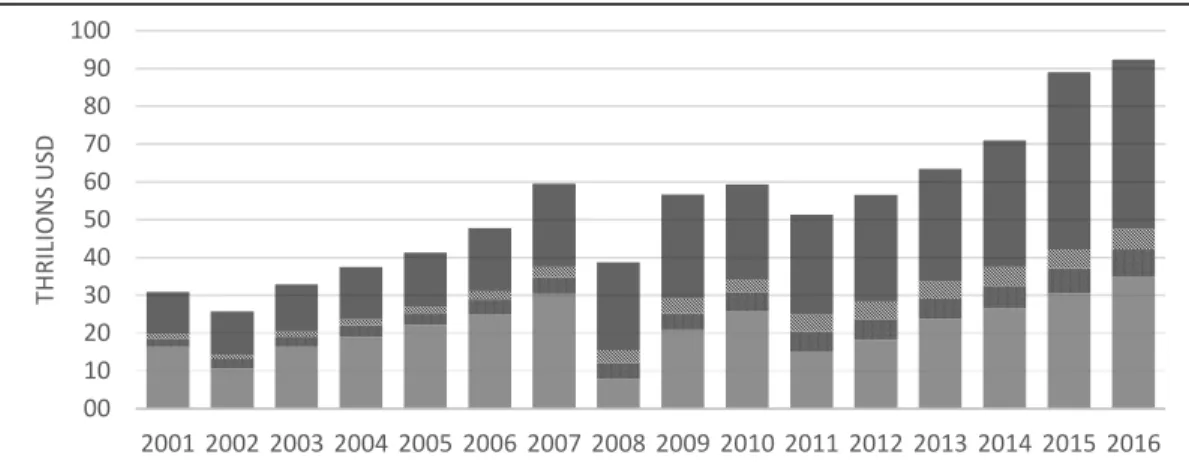
media, financial and medical industries. Nevertheless, this economic model affects all industries. The influence of this model can be seen by in the rise of IA, which has almost doubled in the last 16 years, from $19.8 trillion to $47.6 trillion ,see Figure 1. Most of the high-tech and pharmaceutical companies in 2005 had more than 90% of their assets in intangibles (Bryan et al., 2017). One of the key factors about KE is ownership of the intangibles, as Bratianu (2017) mentioned: knowledge is created by people and is stored in their minds. This process of creating knowledge can be considered an intangible resource. Since an idea cannot be show as part of the IA in the balance sheet financial statement, companies keep these intangibles resources as expenditures of R&D programs until the ideas are mature enough to be recognized as IA on the IAS 38 boundaries.
4
In traditional accounting framework it is to see a direct relationship between IA and future earnings. Whereas early research failed to establish a strong relationship between IA and the ROE, more in detail regarding R&D, and outlays and future earnings (Ballester, Garcia-Ayuso, & Livnat, 2003), novel studies promote and prove the benefits of IA on companies’ performance.
Figure 1. Global Enterprise Value - Absolute Breakdown
Figure 1. Global Enterprise Value - Absolute Breakdown From 2001 to 2016 for the largest
multinational companies in the globe.
Source: Adapted from Global Intangible Finance Tracker (2017, p. 29).
Most of the studies use financial information disclosed by companies and third parties’ publications, i.e. stock exchange information. A widespread practice is to allocate IA on low- tax countries/jurisdictions, also called “tax havens” where regulations allow companies to transfer intangibles to subsidiary companies in order to reduce the tax impact on the consolidated financial statements (Bridgman, 2014). Despite tangible assets, intangible capital and other intangibles, IA could have international headquarters for legal purposes. The study conducted by Bridgman (2014) shows a decay of IA investments in the USA from 1994 to 2010. Bridgman’s study used information from the most important multinational firms in the USA. The study’s statistics do not include many IA held by multinationals, such as trade secrets or organization capital. The results provide a better understanding of IA tax treatment and show the importance of IA in firms, and, furthermore, the need for new strategies to tax multinational’s intangibles. The study conducted by Heiens et al., (2007) regarding the implication of IA on firms’ holding returns suggests that IA other than goodwill have a significant positive impact. In contrast, high accumulation of goodwill and R&D expenditures have a negative impact on shareholders’ returns. Heinens’ study proceeded using the resource-based view. The mentioned study obtained data from 1.675 companies recorded by the Center for Research in Security Prices in 2001. The results support the premise of a positive relationship between IA and shareholders’ returns, specifically those intangibles resources that
00 10 20 30 40 50 60 70 80 90 100
2001 2002 2003 2004 2005 2006 2007 2008 2009 2010 2011 2012 2013 2014 2015 2016
T H R IL IO N S US D
5
are used for advertising that have a positive but slight impact on long-term returns. The study did not use traditional ratio measures since it is argued that ROE cannot help in market adjusted periods of time. One study focused on IA such as trademarks and the acquisition of those types of intangibles. Sinclair and Lane Keller (2014) studied the disagreement between the accounting and financial standards regarding intangibles, specifically trademarks and self-generated IA. Sinclair and Lane (2014) studied the P&G corporation due to its importance in the financial market and because of the corporation intense acquisition of brands. They tested the inconsistency of accounting tools for measuring those IA owned by the company. The results exhibit a basic conceptual conflict between those standards and the need for an accounting framework that fits the new dimension of IA. Further, the results suggest that higher accumulation of IA, trademarks in this case, is a sight of growth.
Tahat et al., (2017) studied the impact of intangibles on firms’ current and future financial and market performance within the companies constituting the United Kingdom’s Index FTSE 150 from 1995 to 2015. The study was focused on the role of goodwill and R&D on firms’ performance. The authors support the idea that financial statements are not revealing accurate present information regarding financial performance. Moreover, the study emphasizes the need for studies targeting future performance. The proxies employed in earnings per share were ROA and ROE. The findings display a positive impact of investments in intangibles on company’s future performance, yet for the short term, the relationship goes in the opposite way. The results are consistent with market-based and resource-based theories, assuming IA are a relevant factor for sustainability of earnings and boost future performance. Additionally, the study though not significantly negative relationship between R&D and companies’ current market operation.
Intangibles affecting the present value and growth options were the aim of the study performed by Makrominas (2017). The study investigated the effects of present value growth options by IA apart from goodwill. Accompanying, the study correspondingly shows that the relation between the level of IA disclosure and market perception of growth options was positive. Makrominas’ study used a cross-section of publicity trade US firms from 1976 to 2010. The data was obtained from the North American Annual Compustat. Overall, the results show an effective relationship between recognized IA and firms' growth options.
6
Intangibles play a critical role in business’ planning. Therefore, many scholars have confidence in the power of IA to develop business, guarantee firms’ subsistence and project superior shareholders returns (Ciprian, Valentin, Mădălina, & Lucia, 2012; Heiens et al., 2007; Tahat et al., 2017, sec. 2.1).
Globalization, knowledge economy and the management approaches in the late 2000’s shifted the treatment of IA and business transactions. A variety of studies support the positive effects of IA on business performance and long-term success (Heiens et al., 2007; Nakamura, 2008). Moreover, several studies mention the necessity of singularity in business and predict that in a non-distant future each firm will opt to acquire a unique combination of intangible investments to step forward and distinguish themselves in the market. Further, authors and practitioners foretell management methods will be focused on IA treatment.
Assets are more than possessions that add value to the company. As El-Tawy & Tollington (2013) said, one should see assets as more than just their ability to generate future income, one should also see the power within assets, a power that could provide companies the opportunity to negotiate and trade. A universal definition of IA has not been established hitherto, however identifiable IA have much in common with tangible long-lived assets. Assets are recognized only if they will bring future benefit to the firm (Tahat et al., 2017), yet intangibles have the peculiar characteristic that besides providing future benefit, they are also recognized if they could prevent or block other competitors to enter in the market, e.g., patents, or licenses. The following characteristics must be present to qualify an item as an asset (Wittsiepe, 2008):
• The asset must provide probable future economic benefits that enable it to provide future net cash inflows.
• The entity is able to receive the benefit and restrict other entities’ access to that benefit.
• The event that provides the entity with the right to the benefit has occurred.
As it was said before, a more complex framework is used to define IA. One case study had to integrate the federal court, local real estate laws, international financial standards and industry literature about IA to provide not a definition but a scheme to identify intangibles as assets (Understanding Intangible Assets and Real Estate: A Guide for Real Property Valuation Professionals, 2016). This exercise produced a
4-step test that helps managers and assessors to recognize easily if an intangible is subject to be considered part of the assets.
1. Intangibles should be identifiable.
2. Intangibles should possess evidence of legal ownership.
7
These four qualifications in addition to the 3 previously mentioned must be present to determine an intangible as an asset. For example, a hotel chain business is a fitting example to apply these 4-step test. The hotel’s brand name is “True”, and the firm has a trademark license describing the firm’s logo, font type, colour and design. The firm decides to sell one of its hotels to a different hotel chain. The firm sells the facility, equipment and the land but not the brand. The True brand can be legally transferred, separate from the real estate, as it has a legal ownership and is identifiable.
The IAS 38 (IFRS Foundation, 2014) defines an “intangible asset as an identifiable non-monetary asset without physical substance”. For the purposes of this study, IA are defined as all identifiable resources that lack of physical substance that could be self-generated or traded, and for those intangibles that were acquired by past trade transactions their usage could last for a limited or unlimited period and are shown in the balance sheet financial statement. It is necessary to mention that only those IA which are recognized in the financial statements were used in this study. Intangible resources provide a composition of knowledge, information, intellectual property, and experience. IA could be acquired as a result of market transactions or self-generated and they could have a definitive or indefinite life (El-Tawy & Tollington, 2013; Wittsiepe, 2008).
As it was said before, intangible resources are classified after being recognized, because they must meet the following conditions to be categorized as IA: Be able to be separated and measured. For accounting and tax purposes the classification found in the IAS 38 outlines the types of intangibles that could be part of the assets recognized on the balance sheet statement (IFRS Foundation, 2014). They are as follows:
• Computer Software • Patents
• Copyrights
• Motion Picture Films • Customer Lists
• Mortgage Servicing Rights
• Fishing Licenses • Import Quotas • Franchises
• Customer or Supplier Relationships • Customer Loyalty
• Market Share and Marketing Rights The standard requires proof of future benefits from the asset and a clearly measurable cost of development or acquisition.
8
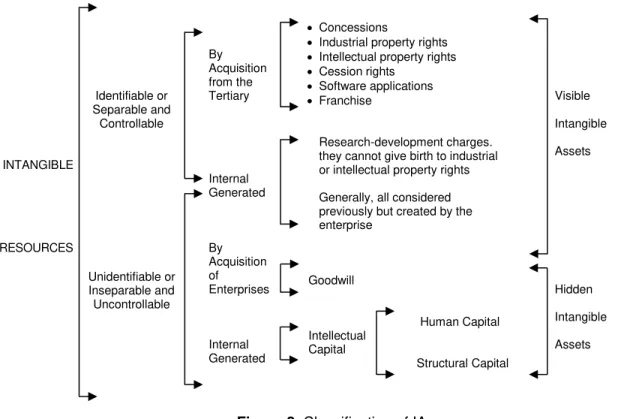
The following scheme summarizes accurately the classification of IA (Vilora, Nevado, & Lopez, 2009), see Figure 2. From right to left, the scheme divides IA into visible or hidden assets. From left to right, the mapping categorizes intangibles for separability, acquisition, (internally generated or acquired) and ends with the most common examples.
Figure 2. Intangible assets classification scheme.
INTANGIBLE RESOURCES Identifiable or Separable and Controllable Unidentifiable or Inseparable and Uncontrollable By Acquisition from the Tertiary Internal Generated By Acquisition of Enterprises Internal Generated
• Concessions
• Industrial property rights
• Intellectual property rights
• Cession rights
• Software applications
• Franchise
Research-development charges. they cannot give birth to industrial or intellectual property rights Generally, all considered previously but created by the enterprise Goodwill Human Capital Intellectual Capital Structural Capital Visible Intangible Assets Hidden Intangible Assets
Figure 2. Classification of IA.
Source: G. Vilora, D. Nevado and V. R. Lopez (2009, p. 22).
The literature reviewed of IA point towards IA as a strong component of a company’s financial potential However, it should be pointed out that IA by themselves are not enough to maximize profit or significantly increase ROE. IA must come along with tangible assets to develop continuous growth. Is also necessary to emphasize the need for proper classification and early recognition of IA.
9
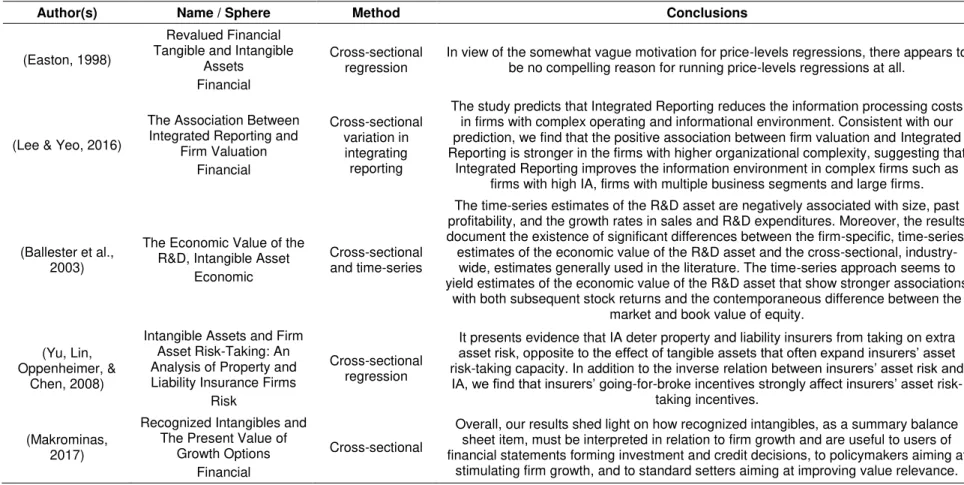
Table 1. Previous studies on IA using cross-sectional analysis.
Author(s) Name / Sphere Method Conclusions
(Easton, 1998)
Revalued Financial Tangible and Intangible
Assets Financial
Cross-sectional regression
In view of the somewhat vague motivation for price-levels regressions, there appears to be no compelling reason for running price-levels regressions at all.
(Lee & Yeo, 2016)
The Association Between Integrated Reporting and
Firm Valuation Financial Cross-sectional variation in integrating reporting
The study predicts that Integrated Reporting reduces the information processing costs in firms with complex operating and informational environment. Consistent with our prediction, we find that the positive association between firm valuation and Integrated Reporting is stronger in the firms with higher organizational complexity, suggesting that
Integrated Reporting improves the information environment in complex firms such as firms with high IA, firms with multiple business segments and large firms.
(Ballester et al., 2003)
The Economic Value of the R&D, Intangible Asset
Economic
Cross-sectional and time-series
The time-series estimates of the R&D asset are negatively associated with size, past profitability, and the growth rates in sales and R&D expenditures. Moreover, the results document the existence of significant differences between the firm-specific, time-series, estimates of the economic value of the R&D asset and the cross-sectional,
industry-wide, estimates generally used in the literature. The time-series approach seems to yield estimates of the economic value of the R&D asset that show stronger associations
with both subsequent stock returns and the contemporaneous difference between the market and book value of equity.
(Yu, Lin, Oppenheimer, &
Chen, 2008)
Intangible Assets and Firm Asset Risk-Taking: An Analysis of Property and Liability Insurance Firms
Risk
Cross-sectional regression
It presents evidence that IA deter property and liability insurers from taking on extra
asset risk, opposite to the effect of tangible assets that often expand insurers’ asset
risk-taking capacity. In addition to the inverse relation between insurers’ asset risk and
IA, we find that insurers’ going-for-broke incentives strongly affect insurers’ asset risk-taking incentives.
(Makrominas, 2017)
Recognized Intangibles and The Present Value of
Growth Options Financial
Cross-sectional
Overall, our results shed light on how recognized intangibles, as a summary balance sheet item, must be interpreted in relation to firm growth and are useful to users of financial statements forming investment and credit decisions, to policymakers aiming at
10
Continue of Table 1. Previous Studies on IA using Cross-Sectional Regression Method
Author(s) Name / Sphere Method Conclusions
(Li, Liu, & Xue, 2014)
Intangible Assets and Cross-Sectional Stock Returns: Evidence
from Structural Estimation Financial
Cross-sectional regression
The estimation shows that incorporating intangible investments into the q-theory framework is critical for the model to explain cross-sectional stock returns and generate a reasonable estimate of the adjustment costs of tangible investments. It is
costlier to accumulate IA than tangible assets.
(Heiens et al., 2007)
The Contribution of Intangible Assets and Expenditures to Shareholder
Value. Manufacturing Firms
Cross-section
Overall, our research indicates that for the manufacturing firms in our sample, advertising, goodwill, and research and development do not have a significant positive impact on shareholder value as measured by holding period returns. Only intangible assets other than goodwill appeared to have a statistically significant and
positive impact on shareholder value.
(Mehralian & Reza, 2012)
The Impact of Intellectual Capital Efficiency on Market Value: An
Empirical Study from Iranian Pharmaceutical Companies
Pharmaceutical
Cross-sectional and
time series
The results of this research did not confirm that companies with higher value-added intellectual coefficient have a higher market valuation. The current research also
implies that an insignificant relation exists between human capital and the company’s
market value in Iran.
11
1.2. Return on Equity
Many financial tools are available to measure companies’ financial performance. On the one hand, investors, managers and shareholders can perform a financial statement analysis to determine if a company is profitable or not. On the other hand, ratios are useful tools to measure the extent of profit earned by companies in a certain period of time (Jensen, 2008). Financial ratios were created to provide quick indicators regarding companies’ financial situation and to measure economic effectiveness. Most ratios use book values. This means that information is taken from companies’ financial statements. Some other ratios use market value for forecasting purposes and better decision making. Financial ratios that use market values provide more accurate information about companies in “real time”, compared to the historical information provided by financial statements. A study by Cañibano, Garcia-Ayuso and Sánchez, (2000) provided significant information about market value usage. One of the most used and well-known profitability ratios is the return on shareholders’ equity (ROE). This ratio has been used to measure companies’ efficiency in profit generation, and due to the ratio uses the net income as a benchmark to measure profitability (Kijewska, 2016). Profitability ratios, as ROE is, are likely to confirm that a company is able to efficiently use available resources available to increase sales or/and net profit (Ciurariu, 2015). The simple formula for this ratio is as the Eq. 1 displays:
𝑅𝑒𝑡𝑢𝑟𝑛 𝑜𝑛 𝐸𝑞𝑢𝑖𝑡𝑦 =𝑇𝑜𝑡𝑎𝑙 𝐸𝑞𝑢𝑖𝑡𝑦𝑁𝑒𝑡 𝑖𝑛𝑐𝑜𝑚𝑒 [1]
Approximately a century ago, the DuPont Corporation designed a formula to understand companies profitability and performance, the formula was first called return on equity. Thereafter, this ratio was fragmented into several more sub-ratios to obtain a better analysis of companies’ corporate performance. Due to their simplicity and versatility in fulfilling almost every company's needs, these ratios were easily implemented (Stockert, Kavan, & Gruber, 2016). Measuring profitability responds to the need of every firm’s intention: to increase profit. Therefore, how to maximize ROE? the question could not be answered without identifying the factors that affect net income and the relation to equity. These factors are known as profit margin (PM), assets turnover and equity multiplayer. Eq. 2 shows the 3 factors described affecting ROE.
12
PM presents how much profit the company can generate per unit sold (net income/sales). AT shows the percentage of sales a company produces from a unit of assets (sales/assets). Equity multiplayer represents the leverage used by the company to finance its assets (assets/equity). Having the ratios separated enables a precise examination of the factors that affect the companies’ increment of profit. Furthermore, by analyzing those ratios separately, a company’s strategies are clearly revealed: for each of the previously mentioned ratios - PM, assets turnover and equity multiplayer - correspond to the following financial strategies: volume of sales strategy, margin assets strategy or leverage strategy. These strategies play an important role in the organization’s planning, and managers should wisely consider which of those strategies would fulfil the company’s demands. For example, a company could use leverage to finance more equipment; by doing this, the assets turnover rate would be reduced while the equity multiplayer would increase. This example exhibits the correlation between the ratios, and hence the strategies, to maximize ROE. A high result of ROE represents a favourable financial position of a studied company (Rutkowska-Ziarko, 2015).
13
2. Methodology
2.1. Objective of the Study
IA are the object of this study due to the remarkable increasing within companies over the last 3 decades, as mentioned by Lev and Daum (2004). The intention of this study is to add knowledge to the scientific community regarding how IA influence the ROE. According to some literature, the IA has a positive effect on income generation, while other research has not found this positive effect in relation to those IA recognized on the balance sheet. Thus, it is important to add new knowledge and to answer the question: what is the influence of IA, recognized in the balance sheet, on companies’ ROE?
Therefore, to answer the question, and considering only the IA recognized in the financial statements, the main objectives of this study are:
1) Analyze the impact of IA on ROE, measured at book values.
2) Analyze the impact of “IA, including goodwill” on ROE, measured at book values. 3) Analyze the impact of IA on ROE, measured at market values.
4) Analyze the impact of “IA, including goodwill” on ROE, measured at market values. 5) Compare the results of book and market value approach.
2.2. Data and Sample
14
groups. The S&P 100 index was chosen due to the relevance of the USA economy and its impact on the global economy.
For this study, the full list of the companies comprising the S&P 100 index was obtained from the official website of Standard and Poor Index (Appendix n°1 shows the list of the 101 companies). The software Microsoft® Excel® 2016 was used to create a database that displays the companies’ name, net profit, sales, total assets, IA, goodwill, total equity, shares outstanding and price per share. This information was collected from the firms’ financial statements. The financial statements were extracted from the annual report known as the 10k form of the U.S. Securities and Exchange Commission. The 10k forms were obtained using the Electronic Data Gathering, Analysis, and Retrieval system (EDGAR)1. Regarding the price per share, the information was taken from the website Yahoo Finance.2. All the information was collected in the 3rd week of November 2017.
Most of the financial statements are issued for the calendar year, from January 1st to December 31st of 2016. The firms Starbucks, Target, The Home Depot and Wal-Mart Stores issued their financial statements in January 2017, Lowes Companies in March 2017, Medtronic in April 2017. For FedEx, Nike and Oracle the month was May 2017. Microsoft, Procter & Gamble and Twenty-First Century Fox, Inc. issued in June 2017. In July 2017, SISCO Systems issued its financial statements. The companies Accenture, Monsanto Co. and Walgreens Boots Alliance, Inc. issued in August 2017. On September 2017 Qualcomm, Apple, Emerson Electric, Visa and Walt Disney issued theirs.
During the data analysis process, 2 companies were left out of the selection due to a lack of information. The companies were Google Inc (GOOG. Symbol) and Twenty-First Century Fox, Inc. (FOX. Symbol). This was due to the fact that in the 2016-year Twenty-First Century Fox, Inc. changed its symbol to FOXA. Regarding Google Inc., the firm changes its name to Alphabet Inc. using the symbol GOOGL. The following firms were put aside as well: American Intl, Chevron, ConocoPhillips, Costco Whole Sale, Duke Energy, Halliburton, Metlife, Occidental Petroleum, The Allstate and Union Pacific. The mentioned companies did not disclose the amount of their IA on their financial statements nor in their annual reports. The use of tax haven entities (e.g. “patent box” companies) located in low-tax jurisdictions could explain the absence of IA. As Bryan et al. (2017) argued in their study on capital affluence between countries, there is an increase in reallocating capital and IA in foreign countries that have lower taxation rates on intangibles. Thus, these firms were not useful in this study. Three more firms were taken out of the group due to their deficit in total equity, due to a repurchasing of more than 70% of their own shares. The magnitude of this buyback action could affect in a significant manner the financial ratios results. The companies were: Colgate-Palmolive, McDonald’s and Philip Morris. The data presented 4 outliers: these companies exhibit values far outside of the average (mean) of the sample. For this reason, the companies Home Depot, Lockheed Martin, Boeing and United Parcel Service were taken out of the
15
sample. Finally, the financial institution entities were left out due to their particular accounting framework and regulation - American Express, Bank of America, Bank of New York Mellon, Berkshire Hathaway, Capital One Financial, Citigroup, J.P. Morgan Chase, Mastercard, Morgan Stanley, The Goldman Sachs, Group, U.S. Bancorp, Visa and Wells Fargo.
To summarize, 68 organizations comprised the study’s final sample (see appendix n° 2). The data refers to the business year 2016: all variables were measured at the same moment in time, making this a cross-sectional database. This database is constituted by 4 independent variables: Net profit divided by Sales, Sales over Intangible Assets, Intangible Assets divided by Total Assets and Tangible Assets over Shareholders’ Equity. All the variables are presented and defined in detail in the sub-section 2.3.1, where their importance for achieving the objective of the research study is explained. ROE is the dependent variable.
2.3. Methods
The methods used in this thesis are described in the following sub-points. First, the DuPont method is described then the OLS method.
2.3.1. DuPont
The DuPont analysis was chosen for this study because it gives a more in depth financial analysis, recognizing that ROE can be separated into return on sales, asset turnover and equity multiplier. By doing this, the analysis delves deeper into the cause of the ROE results. As was mentioned in the previous chapter, this disaggregation is known as the Three-Step Dupont model. The DuPont Analysis gives strong insight into the reasons for a company’s performance. Perhaps the most important consequence of the DuPont Analysis is that it allows analysts to develop specific ratios that enable them to formulate indicators relevant to a specific analysis being performed or that are particularly relevant to the company being analyzed (Sherman, 2015).
This study used reported information in financial statements, such as balance sheet and income statements. Additionally, stock price and shares outstanding were some of the values used to calculate market ratios. By using the Three-Step DuPont Method this study will evaluate its third objective, the relevance of the IA on the ROE. As was outlined in the previous chapter, by separating the factors composing the net income on the main ROE, Eq. 3, the factors are net profit over sales, sales divided by total assets and total assets over shareholders equity. The formula is as follows:
16
For our purposes, we will break down the formula to separate the IA from the total assets, using the book value. The intangibles were isolated by segregating the assets turnover ratio (Sales/total assets), see Eq. 4. The split formula divides total assets over shareholders’ equity.
Return on Equity 𝑏𝑣 = Net ProfitSales ×Intangible AssetsSales ×Intangible AssetsTotal Assets ×ShareholdersTotal Assets′equity [4]
As the result of this split, we obtained an adjusted formula from the original Dupont Model. The formula provides a framework of the variables that were to be used in this study. The formula above, Eq. 4, shows the 4 independent variables to be used in this study: 1I) Profit Margin, 2I) IA turnover, 3I) IA ratio and 4I) Financial leverage ratio. The formula also shows a dependent variable, 1D) ROEbv. See Table 2 for further description of the variables. IA turnover measures the profit of sales over IA, and the outcome depends on the type of business and the effective use of IA. However, this does not show the weight of IA on the total assets. The variable intangible assets ratio (IAR) represents the weight of IA over total assets and it will measure the effect of the IA on the ROE.
In this study, we also used the market value formula to compare the ROE as an accounting measure to the ROE based on the market value3, Eq. 5. The difference between the previous formula is solely in the ROE; the independent variables remain as in the previous one. Return on equity market value was calculated by multiplying the price per shares and shares outstanding for each company.
Return on Equitiy 𝑚𝑣 = Net ProfitSales ×Intangible AssetsSales ×Intangible AssetsTotal Assets ×ShareholdersTotal Assets′equity [5]
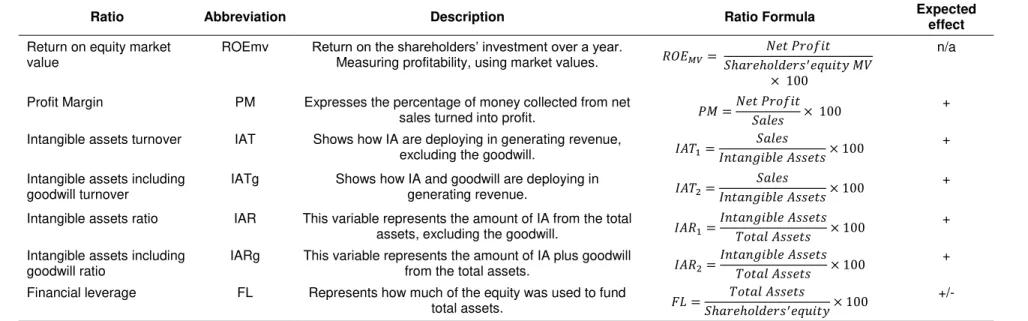
With this procedure we obtained a new modified Dupont model, where the dependent variables are the same as those used in the Eq. 4, but the ROE is measured at market value. An extended description of the variables is found in Table 3, where market values are implemented on the modified ROE formula. One of our main objectives was to study the impact of the “IA including goodwill” on ROE. Therefore, the ratios IATg and IARg were added to Table 2 and Table 3. To summarize, 6 independent variables and 2 dependent variables were recognized to achieve the main aim of the study. All the formulas depicted in Table 2 and Table 3 may differ from other sources, as different studies use diverse ratio formulas to calculate financial indicators.
3The ROE based on the market value of equity is equivalent to a “return on investment” without considering
17
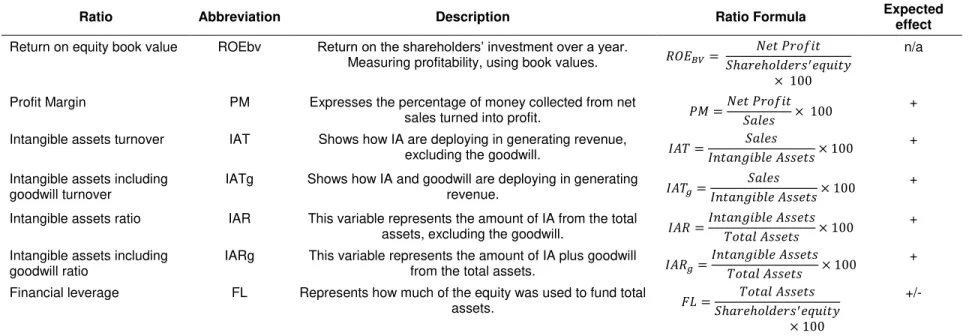
Table 2. Description of all variables, book value.
Ratio Abbreviation Description Ratio Formula Expected
effect
Return on equity book value ROEbv Return on the shareholders’ investment over a year.
Measuring profitability, using book values. 𝑅𝑂𝐸𝐵𝑉= 𝑆ℎ𝑎𝑟𝑒ℎ𝑜𝑙𝑑𝑒𝑟𝑠𝑁𝑒𝑡 𝑃𝑟𝑜𝑓𝑖𝑡′𝑒𝑞𝑢𝑖𝑡𝑦
× 100
n/a
Profit Margin PM Expresses the percentage of money collected from net
sales turned into profit. 𝑃𝑀 =
𝑁𝑒𝑡 𝑃𝑟𝑜𝑓𝑖𝑡 𝑆𝑎𝑙𝑒𝑠 × 100
+
Intangible assets turnover IAT Shows how IA are deploying in generating revenue,
excluding the goodwill. 𝐼𝐴𝑇 =
𝑆𝑎𝑙𝑒𝑠
𝐼𝑛𝑡𝑎𝑛𝑔𝑖𝑏𝑙𝑒 𝐴𝑠𝑠𝑒𝑡𝑠 × 100
+
Intangible assets including goodwill turnover
IATg Shows how IA and goodwill are deploying in generating
revenue. 𝐼𝐴𝑇𝑔=𝐼𝑛𝑡𝑎𝑛𝑔𝑖𝑏𝑙𝑒 𝐴𝑠𝑠𝑒𝑡𝑠 × 100𝑆𝑎𝑙𝑒𝑠 +
Intangible assets ratio IAR This variable represents the amount of IA from the total
assets, excluding the goodwill. 𝐼𝐴𝑅 =
𝐼𝑛𝑡𝑎𝑛𝑔𝑖𝑏𝑙𝑒 𝐴𝑠𝑠𝑒𝑡𝑠 𝑇𝑜𝑡𝑎𝑙 𝐴𝑠𝑠𝑒𝑡𝑠 × 100
+
Intangible assets including goodwill ratio
IARg This variable represents the amount of IA plus goodwill
from the total assets. 𝐼𝐴𝑅𝑔=
𝐼𝑛𝑡𝑎𝑛𝑔𝑖𝑏𝑙𝑒 𝐴𝑠𝑠𝑒𝑡𝑠 𝑇𝑜𝑡𝑎𝑙 𝐴𝑠𝑠𝑒𝑡𝑠 × 100
+
Financial leverage FL Represents how much of the equity was used to fund total
assets. 𝐹𝐿 =
𝑇𝑜𝑡𝑎𝑙 𝐴𝑠𝑠𝑒𝑡𝑠 𝑆ℎ𝑎𝑟𝑒ℎ𝑜𝑙𝑑𝑒𝑟𝑠′𝑒𝑞𝑢𝑖𝑡𝑦
× 100
+/-
Note: Positive expected effect of the independent variables is represented by the symbol “+”. On the contrary, the symbol “-” stands for a negative effect on ROE
by the independent variables. All variables are presented in percentage.
18
Table 3. Description of all variables, market value.
Ratio Abbreviation Description Ratio Formula Expected
effect
Return on equity market value
ROEmv Return on the shareholders’ investment over a year.
Measuring profitability, using market values. 𝑅𝑂𝐸𝑀𝑉= 𝑆ℎ𝑎𝑟𝑒ℎ𝑜𝑙𝑑𝑒𝑟𝑠𝑁𝑒𝑡 𝑃𝑟𝑜𝑓𝑖𝑡′𝑒𝑞𝑢𝑖𝑡𝑦 𝑀𝑉
× 100
n/a
Profit Margin PM Expresses the percentage of money collected from net
sales turned into profit. 𝑃𝑀 =
𝑁𝑒𝑡 𝑃𝑟𝑜𝑓𝑖𝑡 𝑆𝑎𝑙𝑒𝑠 × 100
+
Intangible assets turnover IAT Shows how IA are deploying in generating revenue,
excluding the goodwill. 𝐼𝐴𝑇1=
𝑆𝑎𝑙𝑒𝑠
𝐼𝑛𝑡𝑎𝑛𝑔𝑖𝑏𝑙𝑒 𝐴𝑠𝑠𝑒𝑡𝑠 × 100
+
Intangible assets including goodwill turnover
IATg Shows how IA and goodwill are deploying in
generating revenue. 𝐼𝐴𝑇2=𝐼𝑛𝑡𝑎𝑛𝑔𝑖𝑏𝑙𝑒 𝐴𝑠𝑠𝑒𝑡𝑠 × 100𝑆𝑎𝑙𝑒𝑠 +
Intangible assets ratio IAR This variable represents the amount of IA from the total
assets, excluding the goodwill. 𝐼𝐴𝑅1=
𝐼𝑛𝑡𝑎𝑛𝑔𝑖𝑏𝑙𝑒 𝐴𝑠𝑠𝑒𝑡𝑠 𝑇𝑜𝑡𝑎𝑙 𝐴𝑠𝑠𝑒𝑡𝑠 × 100
+
Intangible assets including goodwill ratio
IARg This variable represents the amount of IA plus goodwill
from the total assets. 𝐼𝐴𝑅2=
𝐼𝑛𝑡𝑎𝑛𝑔𝑖𝑏𝑙𝑒 𝐴𝑠𝑠𝑒𝑡𝑠 𝑇𝑜𝑡𝑎𝑙 𝐴𝑠𝑠𝑒𝑡𝑠 × 100
+
Financial leverage FL Represents how much of the equity was used to fund
total assets. 𝐹𝐿 =
𝑇𝑜𝑡𝑎𝑙 𝐴𝑠𝑠𝑒𝑡𝑠
𝑆ℎ𝑎𝑟𝑒ℎ𝑜𝑙𝑑𝑒𝑟𝑠′𝑒𝑞𝑢𝑖𝑡𝑦 × 100
+/-
Note: Positive expected effect of the independent variables is represented by the symbol “+”. On the contrary, the symbol “-” stands for a negative effect on ROE
by the independent variables. All variables are presented in percentage.
19
2.3.2. Ordinary Least Squares (OLS)
The econometric method used in this study to process the selected data is the OLS method. The OLS is attributed to Carl Friedrich Gauss and is well known as a useful, reliable and compelling regression analysis method. This method is a variation of the Least Squares Principle and is one of the most used linear regression models in econometrics. Heij, De Boer, Franses, Kloek and Dijk, (2004) described the OLS as the first step in estimating economic relations, providing a valuable insight into the relationships between economic variables. The main objective of using the OLS method is to minimize error of estimation.
For this research study, this method was applied to the data selected from the S&P 100 Index to analyze the influence of the IA recognized in the balance sheet financial statement on the ROE. The software GNU Regression, Econometric and Time-Series Library© version gretl 2017d was used to perform the OLS analysis. Along with the main purpose, it was intended to determine which among the four designated variables for this study (Profit Margin, Intangible Assets Turnover, Intangible Assets Ratio and Financial Leverage) influence the ROE for market and book value of companies listed in S&P 100. The equation of the OLS method for a multiple regression, Eq. 6, is as follows:
𝑌 = 𝛼 + 𝛽1𝑋1+ ⋯ + 𝛽𝑘𝑋𝑘+ 𝜀 [6]
where Ystands for the dependent variable, α stands for the constant (intercept), β stands for the coefficient of the independent variable, X stands for an independent variable and ε stands for the error term (the unobserved disturbance).
As was said before, the main objective of this study is to identify whether there is a positive effect of IA on the return of the shareholders’ investments of the 68 selected companies on the S&P100 index, as was outlined in the literature review. Since independent variables are presented in the adjusted formula of DuPont, this study fits the independent variables on a multiple linear regression analysis, if Eq. 4 and 5 were transformed using the logarithmic function, the formulas will represent the logarithmic values of the variables. Of note for this study is that the growth rate of the dependent variable (ROE) is linearly related to the 4 independent variables - profit margin (PM), IA turnover (AT), IA ratio (AR) and financial leverage (FL). The following formulas, Eq. 7, 8, 9 and 10, show the OLS equations adapted for the study purposes using the logarithmic function. Indeed, all the previous variables were transformed into are the logarithmic values (lROE, lPM, lIAT, lIAR and lFL) used in each of the formulas.
20
𝑙𝑅𝑂𝐸𝑏𝑣𝑖= 𝛼 + 𝛽𝑖𝑙𝑃𝑀𝑖+ 𝛽𝑖𝑙𝐼𝐴𝑇 + 𝛽𝑖𝑙𝐼𝐴𝑅𝑖+ 𝛽𝑖𝑙𝐹𝐿𝑖+ 𝜀𝑖 [7]
The following formula, Eq. 8, presents the multiple regression model to explain the growth rate of the ROE using its market value:
𝑙𝑅𝑂𝐸𝑚𝑣𝑖= 𝛼 + 𝛽𝑖𝑙𝑃𝑀𝑖+ 𝛽𝑖𝑙𝐼𝐴𝑇 + 𝛽𝑖𝑙𝐼𝐴𝑅𝑖+ 𝛽𝑖𝑙𝐹𝐿𝑖+ 𝜀𝑖 [8]
The following formula, Eq. 9, presents the multiple regression model to explain the growth rate of ROE at book values adding goodwill to IA:
𝑙𝑅𝑂𝐸𝑏𝑣𝑖= 𝛼 + 𝛽𝑖𝑙𝑃𝑀𝑖+ 𝛽𝑖𝑙𝐼𝐴𝑇𝑔𝑖+ 𝛽𝑖𝑙𝐼𝐴𝑅𝑔𝑖+ 𝛽𝑖𝑙𝐹𝐿𝑖+ 𝜀𝑖 [9]
The following formula, Eq. 10, presents the multiple regression model to explain the growth rate of ROE using its market value adding goodwill to IA:
𝑙𝑅𝑂𝐸𝑚𝑣𝑖= 𝛼 + 𝛽𝑖𝑙𝑃𝑀𝑖+ 𝛽𝑖𝑙𝐼𝐴𝑇𝑔𝑖+ 𝛽𝑖𝑙𝐼𝐴𝑅𝑔𝑖+ 𝛽𝑖𝑙𝐹𝐿𝑖+ 𝜀𝑖 [10]
As in Eq. 6, for these last 4 last equations, the constant is displayed as 𝛼, the coefficient of the estimator of the population intercept of each independent variable is represented by 𝛽, the estimation errors are projected by the OLS method and shows the impact of each independent variable on the dependent one and the error term, 𝜀. Lastly, the symbol 𝑖 represents each one of the observations in the dataset, in other words, it represents every single firm in the study’s sample.
In order to keep the results of the OLS in this cross-sectional study unbiased, the model takes the following assumptions: first, the models (for book values and market values) are linear in their parameters; second, data is a randomly selected sample of the population, in other words, uncorrelated from each other; third, independent variables are measured exactly such that measurement error is negligible; and, finally, independent variables are not too rigidly collinear.
21
homoscedastic. Concerning the third assumption, the variables were measured according to the way they are presented publicly, which leads to the conclusion that the measurement error is insignificant in this research study. The last assumption deserves greeter attention throughout the estimation of the models and presentation of the results.
The last assumption requires data to not be too strongly collinear. The importance of this assumption lies in the statistical problem of multicollinearity. It is frequently presented in regression analysis with more than a single independent variable since this problem occurs when two or more variables are moderately or highly correlated. To corroborate that multicollinearity is not present in this study, the so-called Variance Inflation Factor (VIF) test will be implement: one of the most common tests implemented to test for collinearity among independent variables. The test will be calculated after running an OLS model. The results of the VIF test are easy to interpret. If the value of the VIF test is higher than 10 the independent variable is strongly correlated with other (or others) independent variables. The solution, when it is not possible to add more observations or manipulate the variables, is to withdraw from the model the variable (s) that caused the multicollinearity.
22
3. Empirical Results
The current section contains a descriptive statistical analysis, the results of the Pearson correlation test and finally the results of the OLS method applied to the sample of companies (68 companies). The descriptive analysis is presented first. Then, a Pearson correlation test is presented to show how the variables could be related (as a way to understand the signs of the correlation and the strength of that correlation) and at the end, the results of the OLS method conclude the results section. The results will show the effects of the independent variables, profit margin (lPM), IA turnover (lIAT), IA ratio (lIAR) and financial leverage (lFL), on the return on equity book value and market value.
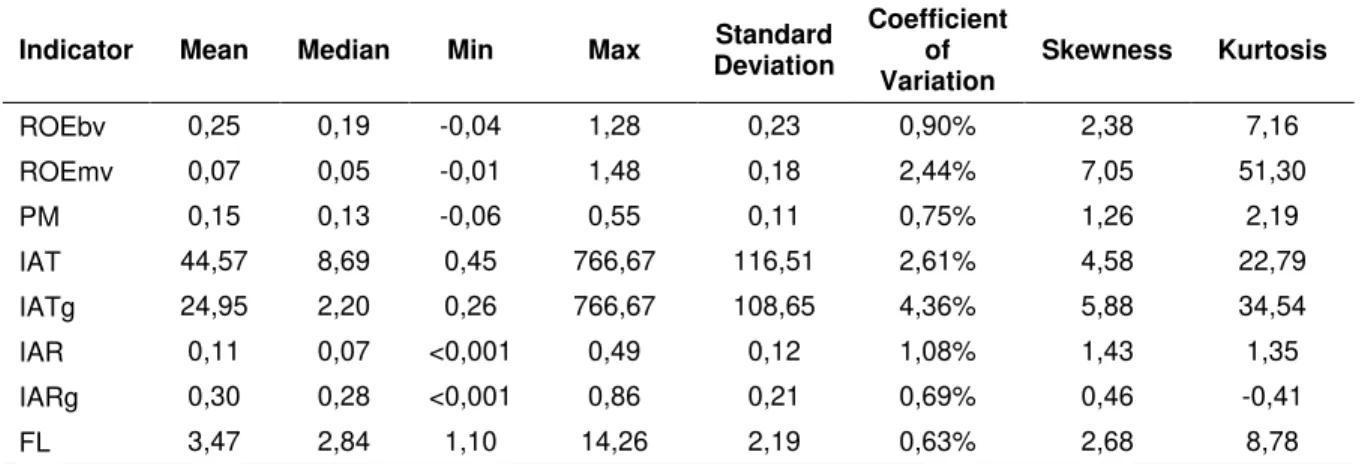
3.1. Descriptive Statistical Analysis
23
Table 4. Descriptive statistics of all variables.
Indicator Mean Median Min Max Standard Deviation
Coefficient of Variation
Skewness Kurtosis
ROEbv 0,25 0,19 -0,04 1,28 0,23 0,90% 2,38 7,16 ROEmv 0,07 0,05 -0,01 1,48 0,18 2,44% 7,05 51,30 PM 0,15 0,13 -0,06 0,55 0,11 0,75% 1,26 2,19 IAT 44,57 8,69 0,45 766,67 116,51 2,61% 4,58 22,79 IATg 24,95 2,20 0,26 766,67 108,65 4,36% 5,88 34,54 IAR 0,11 0,07 <0,001 0,49 0,12 1,08% 1,43 1,35 IARg 0,30 0,28 <0,001 0,86 0,21 0,69% 0,46 -0,41 FL 3,47 2,84 1,10 14,26 2,19 0,63% 2,68 8,78
Note. All results are presented in the same unit of measurement as the variables, excepting the coefficient of
variation
Source: Authors’ calculations.
The variables “intangible assets turnover” and “intangible assets turnover including goodwill” project the longest distance between their means and maximums. Intangible assets turnover excluding goodwill exhibits an outstanding maximum value close to 767% whereas its mean is close to 45%. The distance from the mean to the maximum value is more than 17 times its mean. On the other hand, the minimum values from all the indicators are not far away from their means, with the exception of intangible assets ratio including and excluding goodwill. Intangible assets turnover ratio including and excluding the goodwill present the highest values of standard deviation regarding their means. Therefore, their coefficient of variation shows a high degree of dispersion; in particular, the result of intangible assets turnover including goodwill presented 108,65% of deviation. That means the data for intangible assets turnover adding goodwill (IATg) is broadly spread out. Furthermore, these variables present an abnormal skewness, that is to say, their distributions are asymmetric. Additionally, their long right tails mean that the samples are positively skewed; simply put, the data are distributed mainly around the mean. Nevertheless, some data is distant from the mean representing a longer right tail in a graph. The variables’ kurtosis results exhibit a property known as “fat-tails” due to the spread distribution. Return on equity market value exhibits the highest value with 50% of kurtosis. Fat tails occur where the actual probability of extreme outcomes is greater than the normal distribution: put in short, the extreme outcomes of the data is expected to be greater than the normal distribution.
24
platykurtic or long tail distribution, meaning that the normal distribution is flat. Regarding the Skewness values, the results show a narrow dispersion around the means.
In summary, all variables are positively skewed due to median values being lower than the means, most of them having maximum values in their data far away from their means (outlier values). In other words, thought the majority of the variables’ values that are close to the average, there is a few number of values that are far away from the average. Moreover, the intangible assets ratio and profit margin have narrower dispersions in contrast to intangible assets turnover and financial leverage ratios. To wit, the variables intangible assets turnover and profit margin have values that are close to each other, which is not present in the intangible assets ratio and financial leverage.
Note that the descriptive statistical analysis showed that some variables present high range values. Therefore, the linear functional form adjusted into a logarithmic functional form has another added advantage. Logarithmic values are known to decrease the degree of dispersion of a variable’s values.
3.2. Pearson Correlation
This subsection presents the results of the Pearson correlation test applied on the study’s sample. Performing this test will help the study to answer the research questions, in order to know if the IA recognized according to IAS 38 have a positive impact on the return on equity. As explained in section 2, a set of 68 companies listed on the S&P 100 index in 2016 compose the dataset.
25
Table 5.Results of Pearson correlation for both sets.
Dependent variables Independent variables
lPM lIAT lIAR lFL
Logarithmic ROE Book Value 0,44* 0,05 0,19* 0,37* Logarithmic ROE Market Value 0,15* 0,02 0,12 0,20*
Note. The symbol (*) stands for a 10% level of significance. A set of 66 observations were used to perform this
test, two observations presenting negative values were left out.
Source: Author’s calculations.
The results show an intense and positive relation between the logarithmic version of the variables return on equity book value and profit margin in comparison to the rest of the independent variables; this means that the observations in the profit margin correspond with observations of the return on equity book value. Intangible assets ratio and intangible assets turnover present low correlation coefficient for return on equity while using book and market values, for the market value set the variable intangibles assets turnover is the weakest. Until this point, the IA recognized in the financial statements show almost insignificant influence on neither book or market value of the return on equity.
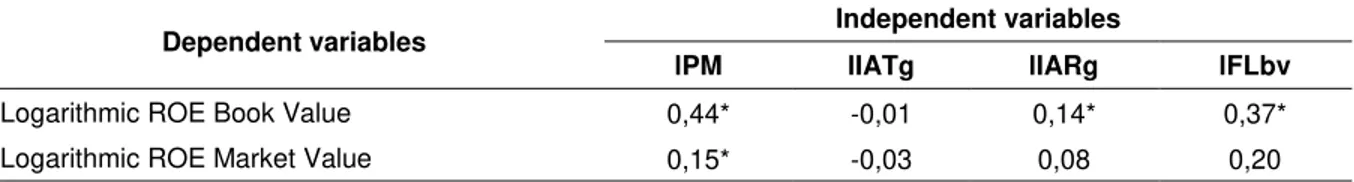
To accomplish the main objectives, the Pearson correlation coefficient test was performed for the variables, adding goodwill value to intangible assets. The following table, Table 6, has the same structure as Table 5, but the variables lIAT and lIAR were substituted for lIATg and lIARg.
Table 6. Results of Pearson correlation for both sets, including goodwill.
Dependent variables Independent variables
lPM lIATg lIARg lFLbv
Logarithmic ROE Book Value 0,44* -0,01 0,14* 0,37* Logarithmic ROE Market Value 0,15* -0,03 0,08 0,20
Note. The symbol (*) stands for a 10% level of significance. A set of 66 observations were used to perform this
test, two observations presenting negative values were left out.
Source: Author’s calculations.
26
3.3. OLS Regression Analysis Results
In this section, the study presents the results of the OLS regression using the Eq. 7, 8, 9 and 10 explained in subsection 2.3.2.
The format of Table 7 displays in the first column the adjusted independent variables that, in this study, are being analyzed to find out if they influence the growth rate of lROE. The second column shows the results obtained for the estimated coefficients – the estimated coefficients indicate how a change of 1% in the independent variable changes, in percentage, the rate of growth of the dependent one. The growth rate of the dependent variable will change in the same direction as the independent variable if the value of the estimated coefficient is positive; on the contrary, it will change in an opposite direction if the estimated coefficient presents a negative sign. This analysis requires that all the other variables remain constant. The third column displays the outcomes of the standard robust errors to assure that the assumption of the homoscedasticity of the error term is not infringed and the results are robust, accurate and it is possible to trust them. The fourth column presents the results of the p-values. This column is related to the fifth column, which indicates the statistical significance of the estimated coefficient. The last column shows the results of the Variance Inflation Factor (VIF) which allow for conclusions about the independent variables’ strong multicollinearity. The table correspondingly displays the number of observations using the letter n, the results for the joint statistical significance test (F-test) and the Adjusted R-squared (adjusted for the degrees of freedom).
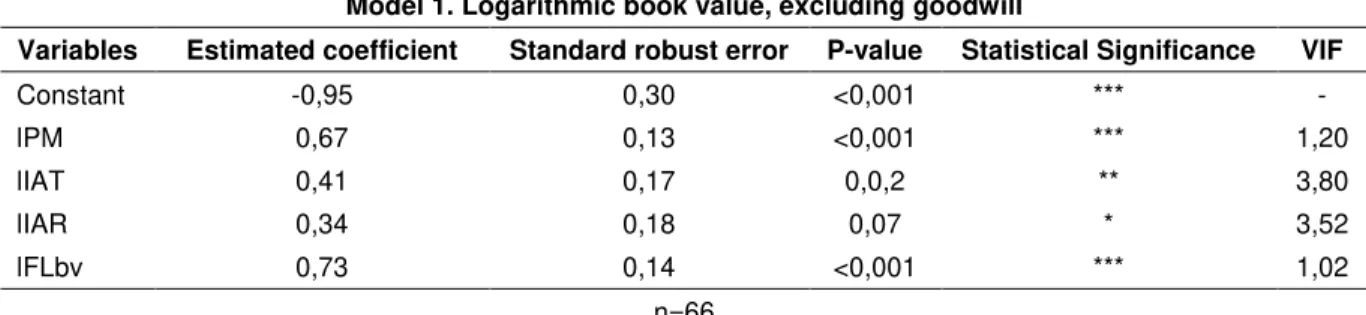
The following tables display the results of the OLS using logarithmic values for the book value set excluding goodwill, Table 7, and including goodwill, Table 8.
Table 7. Results of the OLS analysis of book value.
Model 1. Logarithmic book value, excluding goodwill
Variables Estimated coefficient Standard robust error P-value Statistical Significance VIF
Constant -0,95 0,30 <0,001 *** -
lPM 0,67 0,13 <0,001 *** 1,20
lIAT 0,41 0,17 0,0,2 ** 3,80
lIAR 0,34 0,18 0,07 * 3,52
lFLbv 0,73 0,14 <0,001 *** 1,02
n=66
F-Test (4, 61) = 9,62*** Adjusted R-squared = 0,64
Note. The symbol (***) means 1% level of significance, (**) means 5% of level of significance and (*) means
10% of level of significance. The symbol (-) stands for “not applicable”.
27
From the results shown in Table 7, it is possible to state that all the estimated coefficients are statistically significant, including the estimated coefficient for the constant. Indeed, with a level of confidence of 99% it is possible to trust the values computed for the coefficients of the constant, lPM and lFLbv. With a level of confidence of 95% is possible to trust the value computed for the coefficient of lIAT and with a confidence level of 90% is possible to trust the coefficient computed for the lIAR. This means, for instance, that if the financial leverage (lFLbv) grows 1%, the book value of the return on equity (lROEbv) will grow in the same direction by 0,73%. Regarding the profit margin, if it also grows 1% (lPM) this will cause a 0,67% grow in the book value of the return on equity. With respect to intangible assets turnover (lIAT), if it grows 1% the growth in the return on equity will be almost 0,4%. Finally, as for the intangibles assets ratio, if lIAR increases 1% the lROE will grow 0,35%.
The model presented in Table 7 has been estimated using information from the total sample - 66 companies (two of them were taken out of the test for presenting negative values on the ROE). The results of the F-test (the test for joint statistical significance) indicates the existence of a statistically significance, which means that the variables together compose a good model. This result is supported by the value of the adjusted R-squared. The value of this indicator shows that 64% of the growth on the return on equity is caused by changes that occurred in the independent variables included in the model. Still, 36% of the changes on the return on equity are due to the error term included in the model, this is not explained by the model itself. Finally, it should be noted that the values for the VIF (Variance Inflation Factors) are all smaller than 10, which excludes any collinearity problems among the independent variables.
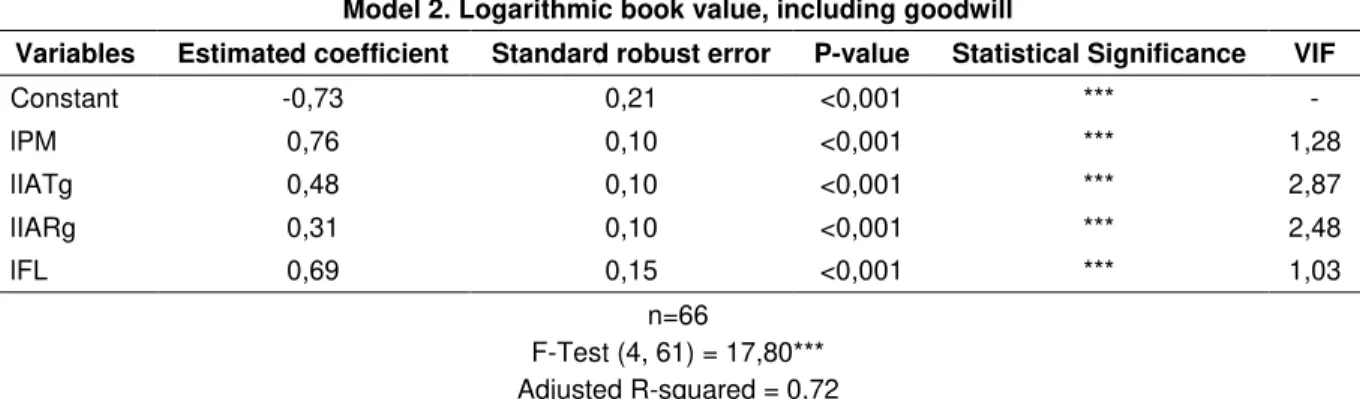
The following table presents the same format as in the previous table. However, this table presents the logarithmic function of the variables including goodwill. See Table 8.
Table 8. Results of the OLS analysis of book value, including goodwill.
Model 2. Logarithmic book value, including goodwill
Variables Estimated coefficient Standard robust error P-value Statistical Significance VIF
Constant -0,73 0,21 <0,001 *** -
lPM 0,76 0,10 <0,001 *** 1,28
lIATg 0,48 0,10 <0,001 *** 2,87
lIARg 0,31 0,10 <0,001 *** 2,48
lFL 0,69 0,15 <0,001 *** 1,03
n=66
F-Test (4, 61) = 17,80*** Adjusted R-squared = 0,72
Note. The symbol (***) means 1% level of significance. The symbol (-) stands for “not applicable”.