A technique using a membrane flow cell to determine
average mass transfer coefficients and tortuosity factors
in biofilms
L.A. García López*, M.C. Veiga*, R. Nogueira**, A. Aparicio* and L.F. Melo*** * Chemical Engineering Laboratory, Faculty of Science, University of A Coruña, Spain (E-mail: veiga@udc.es)
** Center of Biological Engineering, University of Minho, Braga, Portugal
*** LEPAE, Department of Chemical Engineering, Faculty of Engineering, University of Porto, Porto, Portugal
Abstract Average mass transfer coefficients of an inert compound (LiCl) within denitrifying biofilms were monitored during biofilm growth in a membrane flow cell under different flow conditions, until the biofilm reached (pseudo-) steady state. Average effective diffusivities were found to increase with the decrease in tortuosity factors of the biofilm matrix. The lowest tortuosity factor corresponded to the biofilm formed under the highest liquid velocity.
Keywords Denitrifying biofilm; flow cell; mass transfer coefficients; tortuosity factor
Introduction
The importance of quantifying mass transfer inside biofilms is fully justified by the fact that this phenomenon is often the rate-limiting process for substrate consumption in biofilm systems. Additionally, knowledge of mass transfer rates can provide useful information related to the physical structure of the biofilm matrix. The literature reports several meth-ods to measure mass transfer in microbial films. For example, local diffusivities within biofilms have been measured directly by sophisticated techniques such as microelectrodes and FRAP (fluorescence recovery after photobleaching) (Beyenal and Lewandowski, 2000; Bryers and Drummond, 1998). More often, average diffusivities were determined by less expensive indirect methods based on the measurement of substrate consumption rates together with the use of diffusion–reaction biofilm models (Harremoës, 1978), but these results are much dependent on the appropriateness of the mathematical model itself. A direct, non-expensive, non-destructive, on-line technique can be used to compare average mass transfer coefficients in different biofilms during their growth by applying a mass balance to the transport of a non-reactive tracer through the biofilm formed on a porous membrane (Siegrist and Gujer, 1985; Vieira et al., 1993; Zhang et al., 1998; Brito and Melo, 1999).
This technique was used in the present work to monitor mass transfer of LiCl overtime in denitrifying biofilms formed in a flow cell under different liquid velocities. The latter, all in the laminar flow range, were similar to those used in denitrifying biofilm reactors. Additionally, tortuosity factors of the fully grown (pseudo-steady-state) biofilms were also estimated and correlated with the average effective diffusivities of lithium in the microbial layer. It should be noted that the “average effective diffusivity” measured in the present work may represent not only the mechanisms of molecular diffusion but also the phenome-na of advective transport, with possible eddy diffusion effects.
Water Science and Technology
Vol 47 No 5 pp 61–67
© IWA
Publishing 2003
Materials and methods
Experimental system
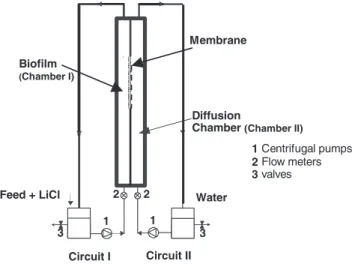
Denitrifying biofilms were grown in a vertical flow cell (Figure 1) consisting of two cham-bers or compartments (I and II), separated by a hydrophilic membrane of cellulose esters, with a mass transfer area and pore diameter of 1.6·10–3m2 and 0.22 µm, respectively. Each chamber of the flow cell was made of plexiglass with a semi-circular cross-section geome-try. A centrifugal pump was connected to each chamber (circuit I and circuit II) in order to recycle the liquid continuously. Sample ports were placed in chambers I and II.
Experiments were carried out by forming biofilms under three different upflow veloci-ties, in laminar regime. Liquid velocities of 0.004 m·s–1(Biofilm 1), 0.01 m·s–1 (Biofilm 2) and 0.04 m·s–1(Biofilm 3) were adjusted with a flow meter on both sides of the membrane. A differential manometer was connected to both sides of the membrane in order to ensure the same pressure and avoid transport due to a pressure gradient across the membrane. The total volume of each circuit was about 800 mL for the two first experiments and 500 mL for the highest velocity. Initially, circuit I was inoculated with a suspension of Alcaligenes
den-itrificans and circuit II was filled with water. After 24 h the inoculum was replaced by
medium solution. The nitrate concentration in the feed of the flow cell was always 50 mg N/L. A C/N ratio of 4, using acetate as carbon source was applied to all biofilms. Inorganic elements were used as nutrients. The pH was adjusted between 7.3 and 7.5. The operating temperature was 20°C.
Mass transfer measurements (henceforth called “diffusion experiments”) within the biofilms were performed by introducing an inert compound (lithium chloride) in the mem-brane flow cell both without biofilm (clean memmem-brane) and during biofilm growth (Vieira
et al., 1993; Brito and Melo, 1999). For that purpose, a fixed amount of LiCl (200 mg
Li+·L–1) was added to vessel I together with the medium. Thus, the lithium concentration was kept in the non-inhibiting range (< 500 mg L–1; Anderson et al., 1991). The first sam-ples were taken after approximately 5 minutes (to achieve homogeneous lithium concentra-tion in circuit I). Further samples were collected at intervals of 30 min, during 8 h, in both circuits, after which LiCl was removed from the system. Lithium concentration was meas-ured by atomic absorption spectroscopy (Varian SpectrAA.250 plus). Biofilm adsorption studies were also carried out to verify whether there was significant lithium adsorption on the biofilm during the mass transfer measurements.
L.A. García López
et al. 62 Feed + LiCl Biofilm (Chamber I) Membrane Water Circuit I Circuit II Diffusion
Chamber (Chamber II)
1 1 2 2 3 3 1 2 3 Centrifugal pumps Flow meters valves
Biofilm characterization
When a steady-state biofilm was developed, the membrane with the biofilm was taken out from the flow cell and the biofilm thickness was measured. Then, the average biofilm thick-ness was determined in Biofilms 1 and 2 with a digital micrometer and a video camera, according to Brito and Melo (1999). In the case of Biofilm 3, the average biofilm thickness was determined with a microscope (Leica Leitz DMRD) at magnification of 5 × 0.12p and with a calibrated ocular micrometer. The biofilm thickness (depth) was calculated as the average of 20 measurements all over the biofilm.
After that, the biofilm was detached from the support by ultrasound treatment. The fol-lowing parameters of the biofilm were measured: total proteins and total polymers accord-ing to the methods of Lowry (Sigma kit 5656) and Dubois et al. (1956), respectively; and dry weight (TS) by Standard Methods (1998). Biomass density was determined as the weight of biomass expressed as TS per unit volume of biofilm. Tortuosity factors were esti-mated according to the definition used in heterogeneous chemical catalysis:
(1) where the biofilm porosity is given by:
(2) where: Dwand Dbare the diffusivities of lithium in water and in the biofilm, respectively; ρwband ρdbare the densities of the wet biofilm and of the dry biomass (mass of dry matter in the biofilm per unit volume of wet biofilm). ρwbwas estimated to be the same as the density of water. The diffusion coefficient of lithium in water, as given by Lide (1995), is 1.03 × 10⁻⁹m2s–1.
Evaluation of mass transfer coefficients
A mass balance for the inert compound in each compartment of the flow cell can be made using the following equations, assuming that the biofilm thickness remains constant during the “diffusion experiments” (i.e., the period when LiCl was introduced in the system):
(3)
(3a) By integrating Eqs. (3) and (3a) it is possible to obtain the change in lithium concentrations in both compartments (chambers) over time during the experiment:
(4)
(5) with the concentration at infinite time being:
(6)
C0and C are the lithium concentrations at the start of and during the diffusion experiment,
L.A. García López
et al. 63 τ ε= D D w b ε ρ ρ ρ = wb− db wb dC dt k A V C C I e T I II I = ⋅ ⋅
(
−)
dC dt k A V C C II e T II I II = ⋅ ⋅ −(
)
C C C C t t k A V V I I e e T I II = +(
−)
⋅ − − ⋅ ⋅ ⋅ + * 0 * exp ( 0) 1 1 C C C C t t k A V V II II e e T I II = −(
−)
⋅ − − ⋅ ⋅ ⋅ + * * 0 exp ( 0) 1 1 C C V C V V V I I II II I II * = ⋅ ++ ⋅ 0 0subscripts I and II indicate circuit I and II, respectively (e.g., VIand VIIare the volumes of the two circuits), A is the mass transfer area, kTthe overall mass transfer coefficient
(includ-ing the biofilm, the membrane and the external mass transfer resistances) and teis the time during which lithium accumulates in circuit II (time of the “diffusion experiment”). The symbol “t” indicates the age of the biofilm (see below, Figures 2 and 3).
The value of kTwas calculated by fitting Eqs. (4) and (5) to the measured concentrations by non-linear regression (minimizing (Cmeas–Cmod)2with the solver routine of MS-Excel). The biofilm mass transfer coefficient at time t (time after the biofilm started to develop),
kb, can be calculated from the overall mass transfer coefficients at time t and at time t = 0, respectively kTand k0
T, where:
(7)
(8) and kIand kIIare the mass transfer coefficients of the solute in the liquids in the compart-ments I and II. LMand Lbare the thickness of the membrane and the biofilm, respectively and DMand Dbare the solute diffusivity though the membrane and the biofilm, respec-tively. The average mass transfer coefficient through the biofilm matrix, kb, is the quotient of the average effective biofilm diffusivity (Db) and the average biofilm thickness:
(9) and kbis obtained by subtracting Eq. (7) from Eq. (8), assuming kIand kIIconstant in time:
(10) Eqs. (7) and (8) describe the overall resistance to mass transfer (1/kT) as the sum of the mass transfer resistances of the liquids I and II, the membrane and, for t> 0, the biofilm.
Results
No significant lithium adsorption on the biofilm was detected. This was verified by using a flow cell (identical to the one used in the present work) where the membrane was replaced with a non-porous flat plate and by letting the biofilm grow in chamber I under the same conditions as the biofilm grown on the membrane. After lithium was introduced, no perma-nent change in lithium concentration in the liquid was observed over time, meaning that lithium stayed mainly in the liquid and was not significantly adsorbed by the biofilm.
Mass transfer measurements were performed during biofilm formation. Data were col-lected for 15 days at different stages of the biofilm development (previous work had shown that pseudo-steady state thickness could be achieved in 10 days). All the experiments were undertaken in duplicate. Figure 2 shows one example of the several diffusion experiments conducted. The change in lithium concentration in both circuits (I and II) is shown. From each of these experiments values for kTand kbcould be estimated by using Eqs. (4)–(10). A number of these diffusion experiments (usually, one every two days) were carried out dur-ing the development of each of the three biofilms, yielddur-ing values of kbas a function of time.
Figure 3 shows the changes in the biofilm mass transfer coefficient kbover time for the tests performed at the three chosen upflow velocities. As expected, kbdecreased with time during biofilm formation, as the thickness of the microbial layer increased. In all cases,
L.A. García López
et al. 64 1 1 1 0 0 k k L D k t T I M M II = + + for = 1 1 1 0 k k L D L D k t T I M M b b II = + + + for > k D L b b b = 1 1 1 0 kb kT kT = −
biofilms reached steady-state after 10–14 days with a final value of kb(t→ ∞) of about 0.9 × 10⁻⁶m s–1for Biofilms 1 and 2, and 1.45 × 10⁻⁶m s–1for Biofilm 3.
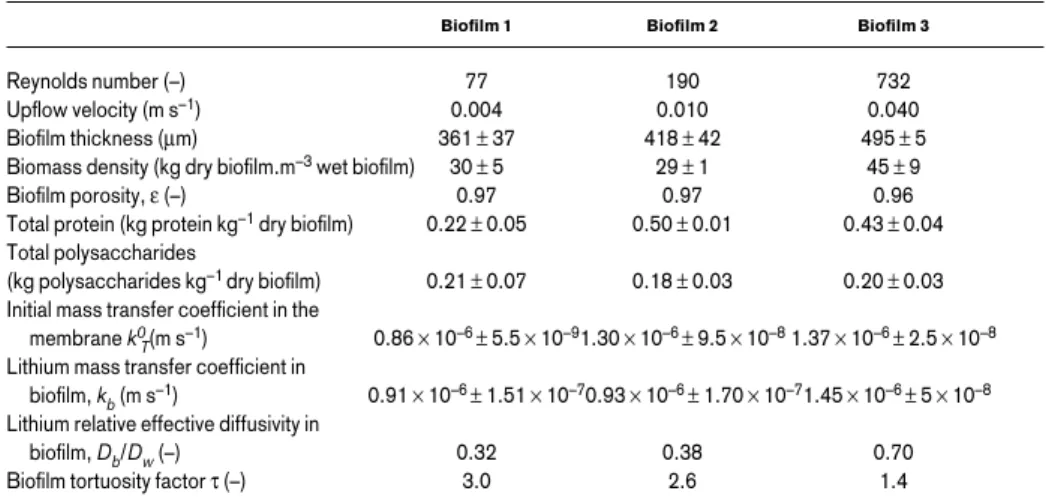
Table 1 presents properties of the three biofilms. Biofilms 1 and 2 have identical densi-ties, in spite of the liquid velocity being 2.5 times higher for Biofilm 2 than for Biofilm 1, whereas Biofilm 3 shows higher values for the density and the kb. The total protein concen-tration increased with the liquid velocity, suggesting higher bacterial concenconcen-trations inside microbial films 2 and 3 than in Biofilm 1. The polysaccharide content was similar in all biofilms. If erosion forces prevailed, bacteria would tend to reinforce their extracellular matrix by producing more polysaccharides per unit volume in Biofilm 3, but this did not seem to be the case here. In laminar flow, hydrodynamic detachment forces are usually not very significant, which also explains the slight increase in biofilm thickness with the flow velocity. It should be noted that although the porosity is practically the same for all biofilms, the tortuosity factor of Biofilm 3 is considerably smaller than the other two. Discussion
The membrane flow cell technique here described provides values of overall average mass transfer coefficients within biofilms and, in conjunction with thickness and density meas-urements, it also yields values of average effective diffusivities and tortuosity factors.
L.A. García López
et al. 65 0 20 40 60 80 100 120 140 160 180 200 0 2 4 6 8 10 Time, te (hours) mg L i + L -1 0,0E+00 2,0E-06 4,0E-06 6,0E-06 8,0E-06 1,0E-05 0 4 8 12 16 Time, t (d) kb (m s -1)
Figure 2 Development of Li+concentration in the two circuits during the experiment with Biofilm 2 (2nd day). Measured concentrations in circuit I (■) and circuit II (●●). Calculated concentration (—) according to Eqs. (4) and (5)
Figure 3 Biofilm mass transfer coefficient (■■) Biofilm 1 (v = 0.0004 m s–1); (▲) Biofilm 2 (v =
0.010 m s–1); (●●) Biofilm 3 (v = 0.040 m s–1)
Table 1 Effect of upflow velocity on biofilm properties and lithium mass transfer (average values and stan-dard deviations)
Biofilm 1 Biofilm 2 Biofilm 3
Reynolds number (–) 77 190 732
Upflow velocity (m s–1) 0.004 0.010 0.040
Biofilm thickness (µm) 361 ± 37 418 ± 42 495 ± 5
Biomass density (kg dry biofilm.m–3wet biofilm) 30 ± 5 29 ± 1 45 ± 9
Biofilm porosity, ε (–) 0.97 0.97 0.96
Total protein (kg protein kg–1dry biofilm) 0.22 ± 0.05 0.50 ± 0.01 0.43 ± 0.04
Total polysaccharides
(kg polysaccharides kg–1 dry biofilm) 0.21 ± 0.07 0.18 ± 0.03 0.20 ± 0.03
Initial mass transfer coefficient in the membrane k0
T(m s–1) 0.86 × 10⁻⁶ ± 5.5 × 10–91.30 × 10–6 ± 9.5 × 10–81.37 × 10–6 ± 2.5 × 10⁻⁸
Lithium mass transfer coefficient in
biofilm, kb(m s–1) 0.91 × 10⁻⁶ ± 1.51 × 10–70.93 × 10–6 ± 1.70 × 10–71.45 × 10–6 ± 5 × 10⁻⁸
Lithium relative effective diffusivity in
biofilm, Db/Dw(–) 0.32 0.38 0.70
The well known heterogeneity of microbial films produces distinct values for the diffu-sivity of the same solute from one location to another in the biofilm matrix, as reported by other authors (de Beer et al., 1994, 1996; Nielsen et al., 1997). Although the knowledge of such local properties is extremely useful for the understanding of the architecture of biofilms and the modelling of the metabolism of biofilm cells, average values of the kinetic parameters are more easily applied to the design of engineered systems containing biofilms (e.g., biofilm reactors, heat exchangers subject to biofouling, etc.). For such purpose, the present technique should be adapted in future to measure actual substrate mass transfer, instead of inert tracers. However, the use of tracers such as lithium chloride contributes to a different goal, which is the comparison of the physical structures of biofilms grown under different conditions (and their effects on mass transfer): biofilms of the same species under different flow velocities and/or flow regimes; biofilms of the same species fed with differ-ent substrates; biofilms of differdiffer-ent strains (or species) under iddiffer-entical environmdiffer-ental con-ditions; etc. It also helps in predicting the penetration of biocides in the biological matrix at distinct times during biofilm development. The technique has therefore the advantages of: i) low cost; ii) enabling the evaluation of average mass transfer parameters; iii) establishing relations between physical structure and mass transfer, and iv) being able to monitor the changes in mass transfer during biofilm growth until the (pseudo)-steady state is reached.
The illustrative data shown in the present paper may shed some light on the relationship between internal diffusivities and biofilm physical properties. Some authors (Fan et al., 1990; Stewart, 1998) proposed correlations indicating lower internal diffusivities for high-er dry biofilm densities. Casey et al. (2000), could not confirm this effect, and neithhigh-er was it observed in the present work. Also, Zhang et al. (1998), using an inert tracer (1,1,2-trichloro-ethane), found that diffusivities in less dense but thick (above 1 mm) biofilms produced by a Pseudomonas species were lower than in thinner and denser biofilms pro-duced by Xanthobacter autotrophicus; however, for Pseudomonas biofilms less than 1 mm thick, diffusivities were higher than in Xanthobacter. Correlating biofilm densities to diffu-sivities may not be as straightforward as it seems.
It should be stressed that biofilms are most often composed of a very high percentage of water (above 95%) and that water channels are in fact predominant in the overall volume and mass. In this work, wet biofilm porosities were around 0.96–0.97, which means that the differences between dry densities may not be particularly relevant for mass transfer, on account of the much higher space (volume) occupied by the water voids (pores, channels) within the biological matrix. Therefore, it seems that the differentiating factor is not the pore/channel volume, but the mass transfer “path” imposed to the molecules or ions when travelling through the biofilm. The “tortuosity factor”, which is a measure of, say, the irreg-ularity (non-linearity) of that path, appears to be a more suitable parameter to explain the differences in the relative effective diffusivities of lithium through the biofilm: lower val-ues of the tortuosity factor are naturally linked to higher valval-ues of the diffusivities. All these are average parameters. As happens with the diffusivity, the local tortuosity factor will obviously vary very much from a cell cluster to a water channel within the same biofilm and throughout the biofilm depth (Bishop et al., 1995).
Conclusions
A non-reactive compound, LiCl, was used as a tracer to measure internal average mass transfer coefficients at different states of growth within denitrifying biofilms formed in a membrane flow cell under different flow conditions. The use of the same inert tracer in all experiments, in conjunction with the determination of density, thickness and protein and polysaccharide content, produced relevant information on the characteristics of the biofilm and of the biofilm processes involved. Tortuosity factors were estimated for the different
L.A. García López
et al.
biofilms and correlated with the internal average effective diffusivities. Additionally, mon-itoring biofilm mass transfer coefficients over time is also an indirect method of estimating the growth of the biofilm until it reaches the steady state.
Acknowledgements
Support was given by project BioToBio (No. ERBFMRXCT97-0114, TMR program of the European Commission) and by the Spanish projects AMB 98-0288 (CICYT) and PR404E 2000/6-0 (Xunta de Galicia).
References
Anderson, G.K., Campos, C.M., Cherchinario, C.A. and Smith, L.C. (1991). Evaluation of the inhibitory effects of lithium when used as a tracer for anaerobic digesters. Wat. Res., 25(7), 755–760.
Beyenal, H. and Lewandowski, Z. (2000). Combined effects of substrate concentration and flow velocity on effective diffusivity in biofilms. Wat. Res., 34(2), 528–538.
Bishop, P.L., Zhang, T.C. and Fu, Y.-C. (1995). Effects of biofilm structure, microbial distributions and mass transport on biodegradation processes. Wat. Sci. Technol., 31(1), 143–152.
Brito, A.G. and Melo, L.F. (1999). Mass transfer coefficients within anaerobic biofilms: effects of external liquid velocity. Wat. Res., 33(17), 3673–3678.
Bryers, J.D. and Drummond, F. (1998). Local macromolecule diffusion coefficients in structurally non-uniform bacterial biofilms using fluorescence recovery after photobleaching (FRAP). Biotechnol.
Bioeng., 60(4), 462–473.
Casey, E., Glennon, B. and Hamer, G. (2000). Biofilm development in a membrane-aerated biofilm reactor: effect of flow velocity on performance. Biotechnol. Bioeng., 67, 476–486.
De Beer, D., Stoodley, P., Roe, F. and Lewandowski, Z. (1994). Effects of biofilm structures on oxygen distribution and mass transport. Biotechnol. Bioeng., 43, 1131–1138.
De Beer, D., Stoodley, P. and Lewandowski, Z. (1996). Liquid flow and mass transport in heterogeneous biofilms. Wat. Res., 30(11), 2761–2765.
Dubois, M., Gilles, K.A., Hamilton, J.K., Rebers, P.A. and Smith, F. (1956). Colorimetric method for determination of sugars and related substances. Anal. Chem., 28, 350–355.
Fan, L.-S., Leyva-Ramos, R., Wisecarver, K.D. and Zehner, B.J. (1990). Diffusion of phenol through a biofilm grown on activated carbon particles in a draft-tube three-phase fluidized-bed bioreactor.
Biotechnol. Bioeng., 35, 279–286.
Harremoës, P. (1978). Biofilm kinetics. In Water Pollution Microbiology. Edited by Mitchell R., Wiley, New York, 71–110.
Lide, D.R. (1996). Handbook of Chemistry and Physics, 76th Edition, CRC Press, Boca Raton, FL. Nielsen, P.H., Jahn, N. and Palmgren, R. (1997). Conceptual model for production and composition of
exopolymers in biofilms. Wat. Sci. Tech., 36(1), 11–19.
Siegrist, H. and Gujer, W. (1985). Mass transfer mechanisms in a heterotrophic biofilm. Wat. Res., 19(11), 1369–1378.
Standard Methods for the Examination of Water and Wastewater (1998). 19th edn, American Public Health Association/American Water Works Association/Water Environment Federation, Washington DC, USA.
Stewart, P.S. (1998). A review of experimental measurements of effective diffusive permeabilities and effective diffusion coefficients in biofilms. Biotech. Bioeng., 59(3), 261–272.
Vieira, M.J., Melo, L.F. and Pinheiro, M.M. (1993). Biofilm formation: Hydrodynamic effects on internal diffusion and structure. Biofouling, 7,67–80.
Zhang, S.-F., Splendiani, A., Freitas dos Santos, L.M. and Livingston, A.G. (1998). Determination of pollutant diffusion coefficients in naturally formed biofilms using a single tube extractive membrane bioreactor. Biotech. Bioeng., 59(1), 80–89.
L.A. García López
et al.